Croatia Magnesia Carbon Bricks Market (2026-2032) | Share, Pricing Analysis, Outlook, Segmentation, Value, Forecast, Analysis, Drivers, Challenges, Competition, Growth, Revenue, Demand, Competitive, Restraints, Consumer Insights, Segments, Industry, Strategy, Supply, Investment Trends, Strategic Insights, Companies, Opportunities, Trends, Size
Market Forecast By Type (High-Carbon, Low-Carbon, Ultra-Low Carbon), By Application (Steelmaking, Electric Arc Furnace, Ladle Furnaces), By End User (Steel Industry, Foundries, Non-Ferrous Metal Industry), By Sales Channel (Direct Sales, Distributors, Online) And Competitive Landscape
| Product Code: ETC12894485 | Publication Date: Apr 2025 | Updated Date: Apr 2026 | Product Type: Market Research Report | |
| Publisher: 6Wresearch | Author: Sachin Kumar Rai | No. of Pages: 65 | No. of Figures: 34 | No. of Tables: 19 |
Croatia Magnesia Carbon Bricks Market Size (2020-2030)
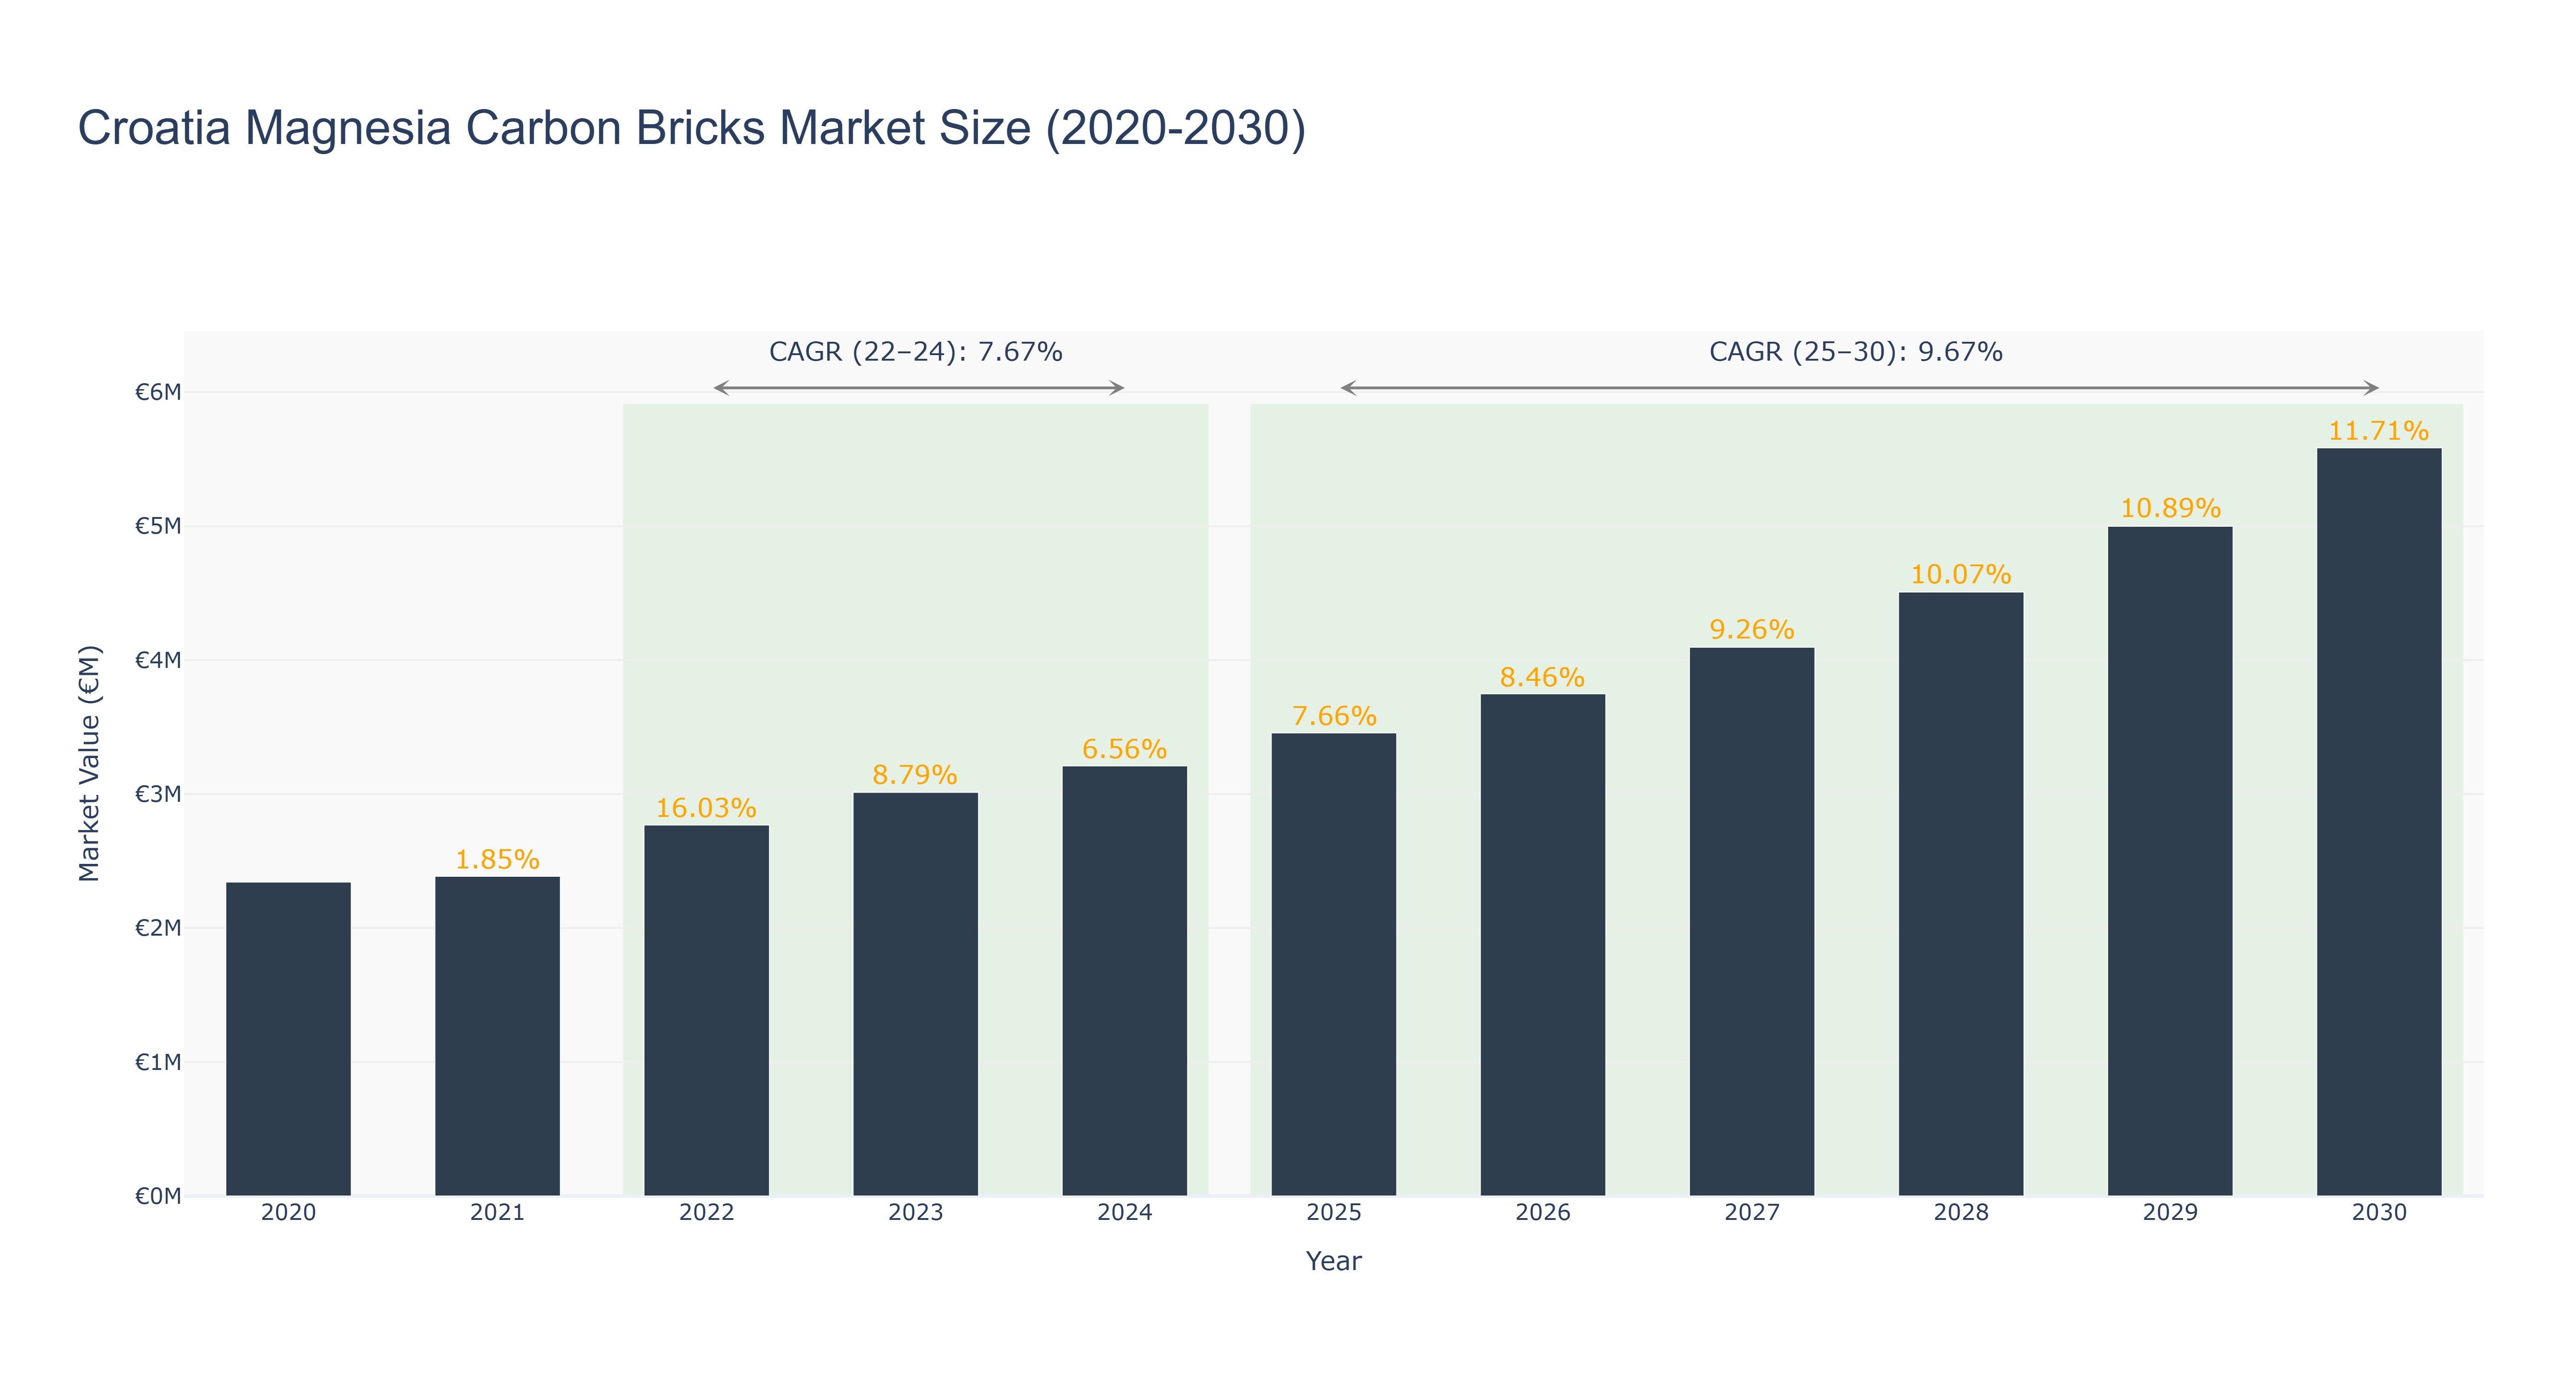
Croatia's Magnesia Carbon Bricks Market has shown a positive growth trend over the years. The market size peaked at €5.58 million in 2030 with a steady increase from €2.34 million in 2020. Notably, the market experienced significant growth from 2025 to 2030 with a forecasted CAGR of 9.67%, driven by increasing demand in the construction and steel industries. The CAGR from 2022 to 2024 stood at 7.67%, indicating a stable growth trajectory during that period. The market's growth can be attributed to the country's infrastructure development projects and the rising demand for high-quality refractory materials. Looking ahead, upcoming infrastructure projects in Croatia, such as the construction of new industrial facilities, are expected to further boost the demand for magnesia carbon bricks in the market.
Croatia Magnesia Carbon Bricks Market: Production & Trade Performance (2019-2025)
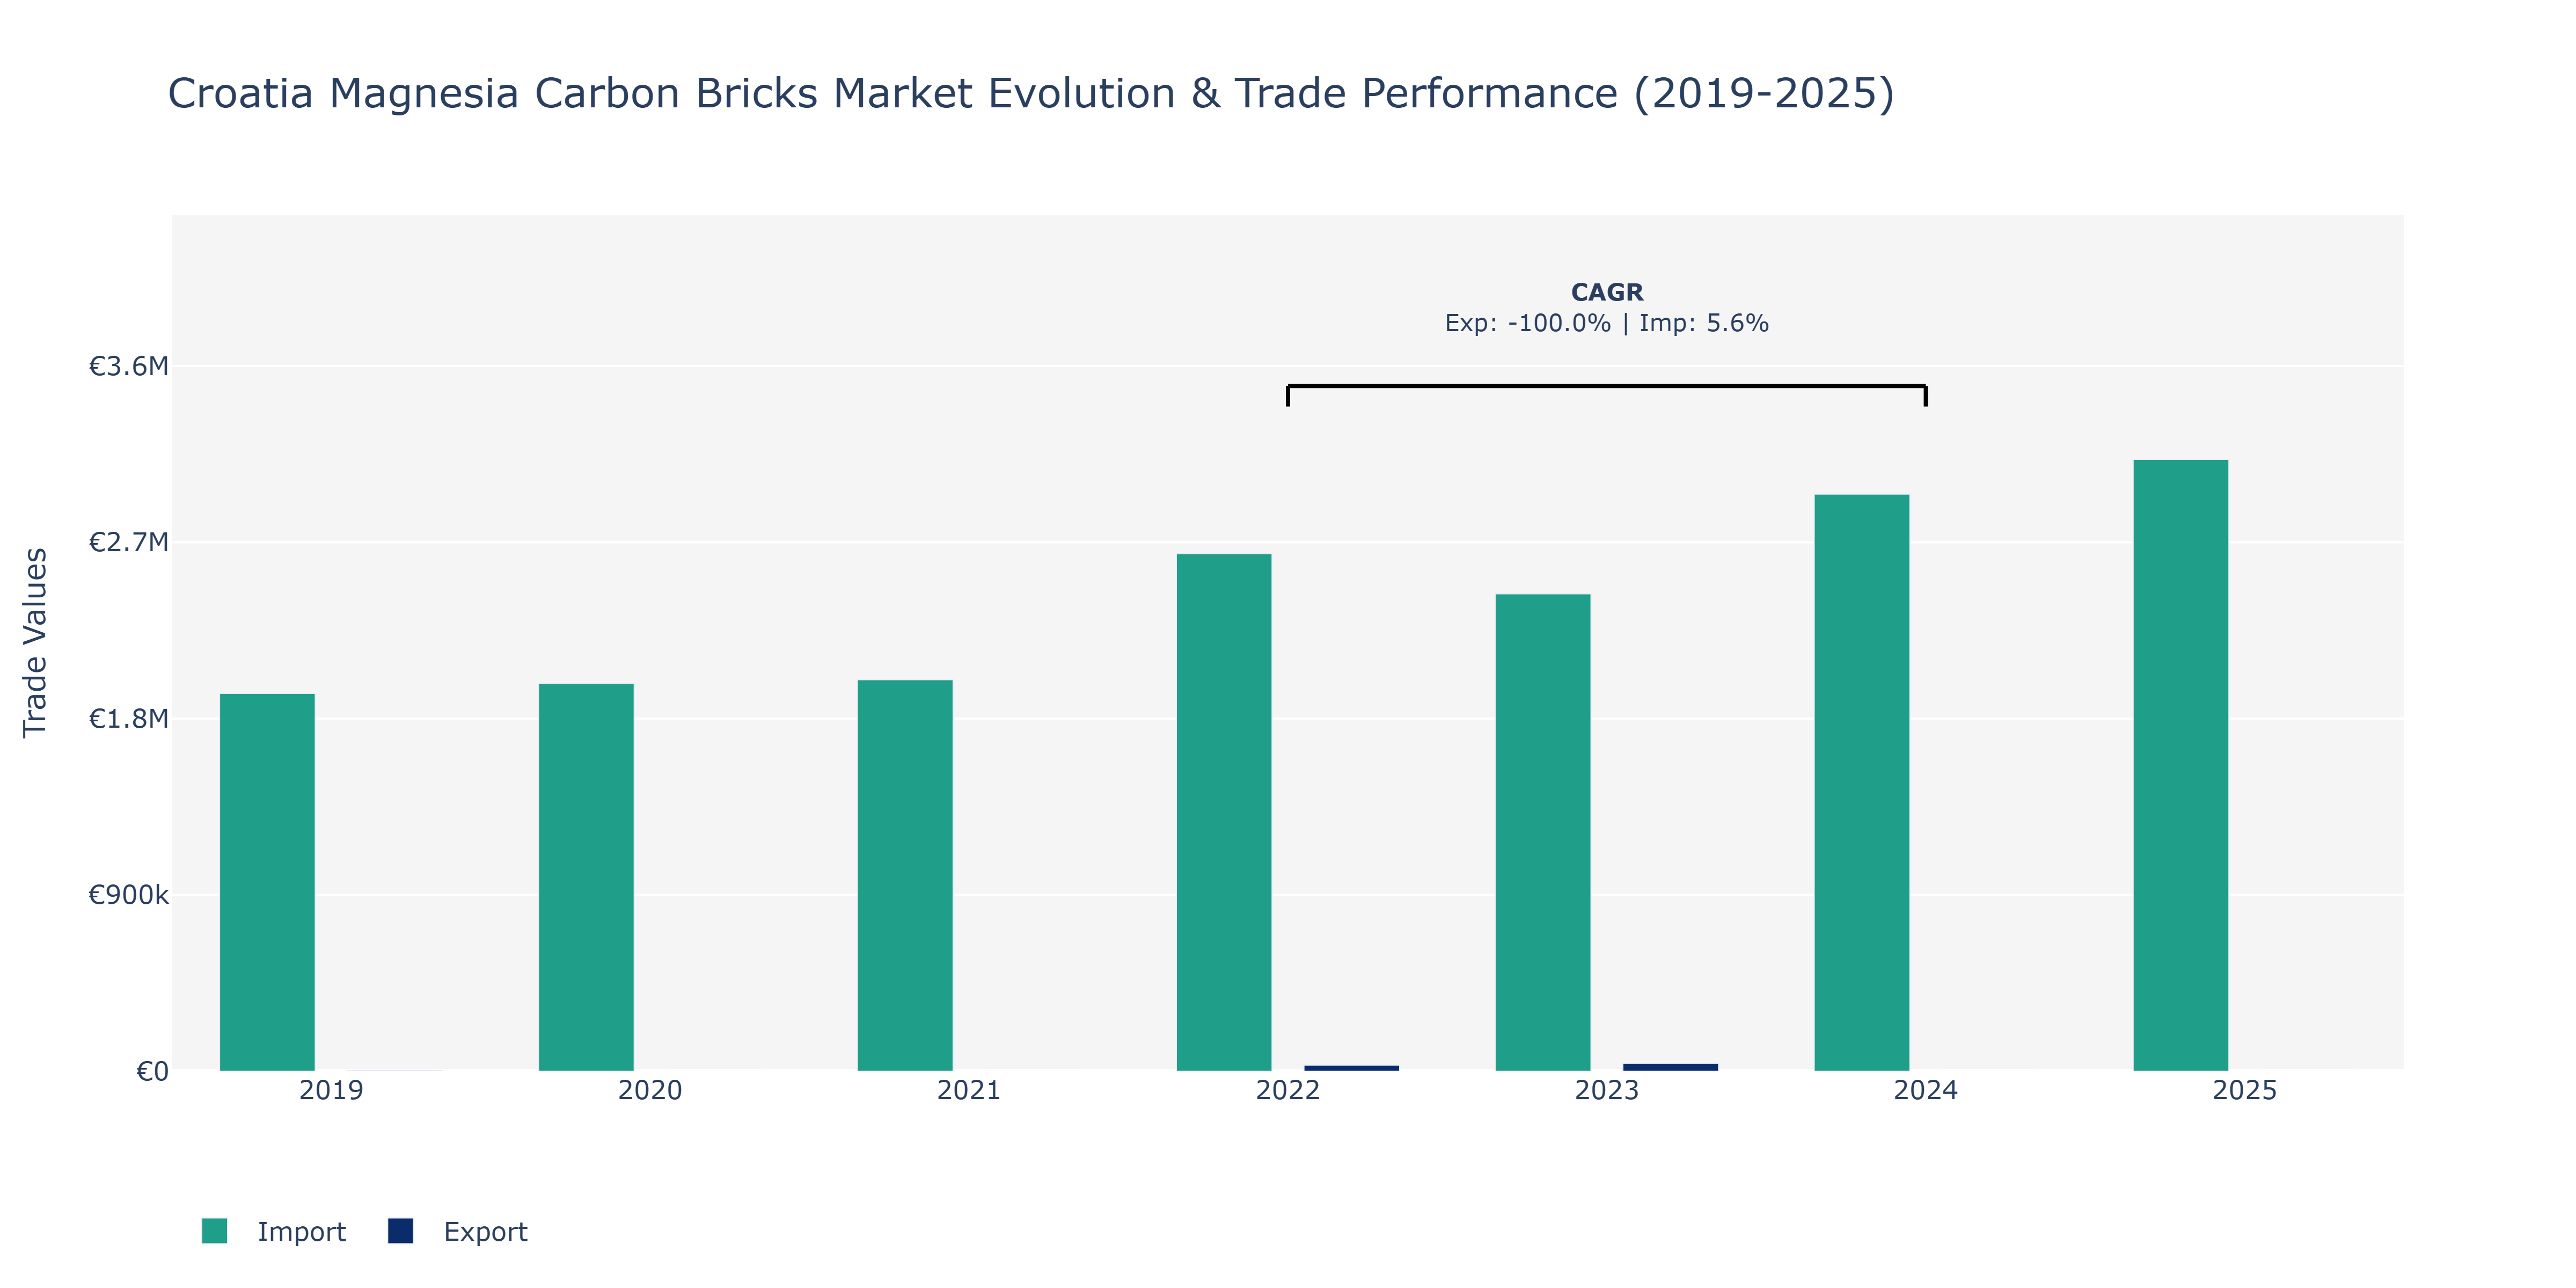
Between 2019 and 2025, Croatia's Magnesia Carbon Bricks Market demonstrated notable trends in exports and imports. In 2019, exports stood at €2.95 thousand, while imports were significantly higher at €1.93 million, showcasing a large trade deficit. The following year, imports slightly decreased to €1.98 million. However, in 2022, exports experienced a substantial increase, reaching €31.11 thousand, possibly due to enhanced product quality or increased global demand. Imports also rose considerably to €2.64 million, indicating a growing market. In 2023, exports continued to grow to €38.85 thousand, suggesting a positive market outlook. Conversely, imports declined to €2.44 million. By 2025, imports peaked at approximately €3.12 million, signaling a growing reliance on foreign suppliers for Magnesia Carbon Bricks. These fluctuations could be influenced by changes in production capacity, international trade policies, or shifts in consumer preferences within the industry. Such dynamics emphasize the market's responsiveness to global factors and the need for strategic planning to capitalize on emerging opportunities.
Key Highlights of the Report:
- Croatia Magnesia Carbon Bricks Market Outlook
- Market Size of Croatia Magnesia Carbon Bricks Market, 2025
- Forecast of Croatia Magnesia Carbon Bricks Market, 2032
- Historical Data and Forecast of Croatia Magnesia Carbon Bricks Revenues & Volume for the Period 2022 - 2032F
- Croatia Magnesia Carbon Bricks Market Trend Evolution
- Croatia Magnesia Carbon Bricks Market Drivers and Challenges
- Croatia Magnesia Carbon Bricks Price Trends
- Croatia Magnesia Carbon Bricks Porter's Five Forces
- Croatia Magnesia Carbon Bricks Industry Life Cycle
- Historical Data and Forecast of Croatia Magnesia Carbon Bricks Market Revenues & Volume By Type for the Period 2022 - 2032F
- Historical Data and Forecast of Croatia Magnesia Carbon Bricks Market Revenues & Volume By High-Carbon for the Period 2022 - 2032F
- Historical Data and Forecast of Croatia Magnesia Carbon Bricks Market Revenues & Volume By Low-Carbon for the Period 2022 - 2032F
- Historical Data and Forecast of Croatia Magnesia Carbon Bricks Market Revenues & Volume By Ultra-Low Carbon for the Period 2022 - 2032F
- Historical Data and Forecast of Croatia Magnesia Carbon Bricks Market Revenues & Volume By Application for the Period 2022 - 2032F
- Historical Data and Forecast of Croatia Magnesia Carbon Bricks Market Revenues & Volume By Steelmaking for the Period 2022 - 2032F
- Historical Data and Forecast of Croatia Magnesia Carbon Bricks Market Revenues & Volume By Electric Arc Furnace for the Period 2022 - 2032F
- Historical Data and Forecast of Croatia Magnesia Carbon Bricks Market Revenues & Volume By Ladle Furnaces for the Period 2022 - 2032F
- Historical Data and Forecast of Croatia Magnesia Carbon Bricks Market Revenues & Volume By End User for the Period 2022 - 2032F
- Historical Data and Forecast of Croatia Magnesia Carbon Bricks Market Revenues & Volume By Steel Industry for the Period 2022 - 2032F
- Historical Data and Forecast of Croatia Magnesia Carbon Bricks Market Revenues & Volume By Foundries for the Period 2022 - 2032F
- Historical Data and Forecast of Croatia Magnesia Carbon Bricks Market Revenues & Volume By Non-Ferrous Metal Industry for the Period 2022 - 2032F
- Historical Data and Forecast of Croatia Magnesia Carbon Bricks Market Revenues & Volume By Sales Channel for the Period 2022 - 2032F
- Historical Data and Forecast of Croatia Magnesia Carbon Bricks Market Revenues & Volume By Direct Sales for the Period 2022 - 2032F
- Historical Data and Forecast of Croatia Magnesia Carbon Bricks Market Revenues & Volume By Distributors for the Period 2022 - 2032F
- Historical Data and Forecast of Croatia Magnesia Carbon Bricks Market Revenues & Volume By Online for the Period 2022 - 2032F
- Croatia Magnesia Carbon Bricks Import Export Trade Statistics
- Market Opportunity Assessment By Type
- Market Opportunity Assessment By Application
- Market Opportunity Assessment By End User
- Market Opportunity Assessment By Sales Channel
- Croatia Magnesia Carbon Bricks Top Companies Market Share
- Croatia Magnesia Carbon Bricks Competitive Benchmarking By Technical and Operational Parameters
- Croatia Magnesia Carbon Bricks Company Profiles
- Croatia Magnesia Carbon Bricks Key Strategic Recommendations
Frequently Asked Questions About the Market Study (FAQs):
6Wresearch actively monitors the Croatia Magnesia Carbon Bricks Market and publishes its comprehensive annual report, highlighting emerging trends, growth drivers, revenue analysis, and forecast outlook. Our insights help businesses to make data-backed strategic decisions with ongoing market dynamics. Our analysts track relevent industries related to the Croatia Magnesia Carbon Bricks Market, allowing our clients with actionable intelligence and reliable forecasts tailored to emerging regional needs.
Yes, we provide customisation as per your requirements. To learn more, feel free to contact us on sales@6wresearch.com
1 Executive Summary |
2 Introduction |
2.1 Key Highlights of the Report |
2.2 Report Description |
2.3 Market Scope & Segmentation |
2.4 Research Methodology |
2.5 Assumptions |
3 Croatia Magnesia Carbon Bricks Market Overview |
3.1 Croatia Country Macro Economic Indicators |
3.2 Croatia Magnesia Carbon Bricks Market Revenues & Volume, 2022 & 2032F |
3.3 Croatia Magnesia Carbon Bricks Market - Industry Life Cycle |
3.4 Croatia Magnesia Carbon Bricks Market - Porter's Five Forces |
3.5 Croatia Magnesia Carbon Bricks Market Revenues & Volume Share, By Type, 2022 & 2032F |
3.6 Croatia Magnesia Carbon Bricks Market Revenues & Volume Share, By Application, 2022 & 2032F |
3.7 Croatia Magnesia Carbon Bricks Market Revenues & Volume Share, By End User, 2022 & 2032F |
3.8 Croatia Magnesia Carbon Bricks Market Revenues & Volume Share, By Sales Channel, 2022 & 2032F |
4 Croatia Magnesia Carbon Bricks Market Dynamics |
4.1 Impact Analysis |
4.2 Market Drivers |
4.2.1 Increasing demand for steel production in Croatia |
4.2.2 Growing focus on infrastructure development projects |
4.2.3 Advancements in technology leading to improved quality and performance of magnesia carbon bricks |
4.3 Market Restraints |
4.3.1 Fluctuating prices of raw materials such as magnesia and graphite |
4.3.2 Environmental regulations impacting production processes |
4.3.3 Competition from alternative refractory materials |
5 Croatia Magnesia Carbon Bricks Market Trends |
6 Croatia Magnesia Carbon Bricks Market, By Types |
6.1 Croatia Magnesia Carbon Bricks Market, By Type |
6.1.1 Overview and Analysis |
6.1.2 Croatia Magnesia Carbon Bricks Market Revenues & Volume, By Type, 2022 - 2032F |
6.1.3 Croatia Magnesia Carbon Bricks Market Revenues & Volume, By High-Carbon, 2022 - 2032F |
6.1.4 Croatia Magnesia Carbon Bricks Market Revenues & Volume, By Low-Carbon, 2022 - 2032F |
6.1.5 Croatia Magnesia Carbon Bricks Market Revenues & Volume, By Ultra-Low Carbon, 2022 - 2032F |
6.2 Croatia Magnesia Carbon Bricks Market, By Application |
6.2.1 Overview and Analysis |
6.2.2 Croatia Magnesia Carbon Bricks Market Revenues & Volume, By Steelmaking, 2022 - 2032F |
6.2.3 Croatia Magnesia Carbon Bricks Market Revenues & Volume, By Electric Arc Furnace, 2022 - 2032F |
6.2.4 Croatia Magnesia Carbon Bricks Market Revenues & Volume, By Ladle Furnaces, 2022 - 2032F |
6.3 Croatia Magnesia Carbon Bricks Market, By End User |
6.3.1 Overview and Analysis |
6.3.2 Croatia Magnesia Carbon Bricks Market Revenues & Volume, By Steel Industry, 2022 - 2032F |
6.3.3 Croatia Magnesia Carbon Bricks Market Revenues & Volume, By Foundries, 2022 - 2032F |
6.3.4 Croatia Magnesia Carbon Bricks Market Revenues & Volume, By Non-Ferrous Metal Industry, 2022 - 2032F |
6.4 Croatia Magnesia Carbon Bricks Market, By Sales Channel |
6.4.1 Overview and Analysis |
6.4.2 Croatia Magnesia Carbon Bricks Market Revenues & Volume, By Direct Sales, 2022 - 2032F |
6.4.3 Croatia Magnesia Carbon Bricks Market Revenues & Volume, By Distributors, 2022 - 2032F |
6.4.4 Croatia Magnesia Carbon Bricks Market Revenues & Volume, By Online, 2022 - 2032F |
7 Croatia Magnesia Carbon Bricks Market Import-Export Trade Statistics |
7.1 Croatia Magnesia Carbon Bricks Market Export to Major Countries |
7.2 Croatia Magnesia Carbon Bricks Market Imports from Major Countries |
8 Croatia Magnesia Carbon Bricks Market Key Performance Indicators |
8.1 Research and development investment in new magnesia carbon brick formulations |
8.2 Adoption rate of advanced manufacturing techniques in the production of magnesia carbon bricks |
8.3 Percentage of steel manufacturers using magnesia carbon bricks in their operations |
9 Croatia Magnesia Carbon Bricks Market - Opportunity Assessment |
9.1 Croatia Magnesia Carbon Bricks Market Opportunity Assessment, By Type, 2022 & 2032F |
9.2 Croatia Magnesia Carbon Bricks Market Opportunity Assessment, By Application, 2022 & 2032F |
9.3 Croatia Magnesia Carbon Bricks Market Opportunity Assessment, By End User, 2022 & 2032F |
9.4 Croatia Magnesia Carbon Bricks Market Opportunity Assessment, By Sales Channel, 2022 & 2032F |
10 Croatia Magnesia Carbon Bricks Market - Competitive Landscape |
10.1 Croatia Magnesia Carbon Bricks Market Revenue Share, By Companies, 2025 |
10.2 Croatia Magnesia Carbon Bricks Market Competitive Benchmarking, By Operating and Technical Parameters |
11 Company Profiles |
12 Recommendations |
13 Disclaimer |
Export potential assessment - trade Analytics for 2030
Export potential enables firms to identify high-growth global markets with greater confidence by combining advanced trade intelligence with a structured quantitative methodology. The framework analyzes emerging demand trends and country-level import patterns while integrating macroeconomic and trade datasets such as GDP and population forecasts, bilateral import–export flows, tariff structures, elasticity differentials between developed and developing economies, geographic distance, and import demand projections. Using weighted trade values from 2020–2024 as the base period to project country-to-country export potential for 2030, these inputs are operationalized through calculated drivers such as gravity model parameters, tariff impact factors, and projected GDP per-capita growth. Through an analysis of hidden potentials, demand hotspots, and market conditions that are most favorable to success, this method enables firms to focus on target countries, maximize returns, and global expansion with data, backed by accuracy.
By factoring in the projected importer demand gap that is currently unmet and could be potential opportunity, it identifies the potential for the Exporter (Country) among 190 countries, against the general trade analysis, which identifies the biggest importer or exporter.
To discover high-growth global markets and optimize your business strategy:
Click Here
Pricing
- Single User License$ 1,995
- Department License$ 2,400
- Site License$ 3,120
- Global License$ 3,795

Search
Thought Leadership and Analyst Meet


Our Clients
Latest Reports
- China Electric Appliance Rental Market (2026-2032) | Trends, Revenue, Growth, Challenges, Size, Value, Outlook, Pricing, Strategy, Insights, Restraints, segmentation, Companies, Investment Opportunities, Analysis, Demand, Drivers, Competition, Forecast, Share
- Chile Electric Appliance Rental Market (2026-2032) | Outlook, Competition, Drivers, Strategy, Revenue, Analysis, Value, Pricing, Restraints, Size, Demand, Share, Growth, Forecast, Challenges, Insights, Investment Opportunities, Companies, Trends, segmentation
- Cambodia Electric Appliance Rental Market (2026-2032) | Companies, Analysis, Restraints, Pricing, Insights, Challenges, Outlook, Strategy, Forecast, Trends, Competition, Value, Revenue, Investment Opportunities, segmentation, Drivers, Size, Demand, Growth, Share
- Brazil Electric Appliance Rental Market (2026-2032) | Revenue, Strategy, Forecast, Companies, segmentation, Competition, Size, Investment Opportunities, Pricing, Restraints, Outlook, Challenges, Analysis, Drivers, Value, Demand, Insights, Trends, Growth, Share
- Bangladesh Electric Appliance Rental Market (2026-2032) | Drivers, Forecast, Investment Opportunities, Strategy, Insights, Demand, Challenges, Outlook, Trends, Competition, Value, Revenue, Size, Pricing, Analysis, Companies, Restraints, segmentation, Share, Growth
- Bahrain Electric Appliance Rental Market (2026-2032) | Outlook, Size, Competition, Restraints, Drivers, Value, Trends, Investment Opportunities, Insights, Forecast, Revenue, Strategy, Growth, Share, Demand, Analysis, Challenges, Companies, segmentation, Pricing
- Azerbaijan Electric Appliance Rental Market (2026-2032) | Trends, Investment Opportunities, Restraints, Insights, Strategy, Competition, Value, Growth, Demand, Drivers, Analysis, Forecast, Size, Share, Outlook, segmentation, Pricing, Challenges, Revenue, Companies
- Australia Electric Appliance Rental Market (2026-2032) | Challenges, Restraints, Forecast, Demand, Size, Competition, Pricing, Investment Opportunities, Revenue, Trends, Drivers, Growth, Outlook, Analysis, Strategy, Value, segmentation, Insights, Companies, Share
- Argentina Electric Appliance Rental Market (2026-2032) | Growth, Trends, Insights, Outlook, Forecast, Size, Drivers, Analysis, Restraints, Challenges, Share, Revenue, Investment Opportunities, Strategy, Demand, Value, Companies, segmentation, Competition, Pricing
- Algeria Electric Appliance Rental Market (2026-2032) | Share, Size, Value, Strategy, Competition, Outlook, Challenges, Companies, Trends, Pricing, Insights, Forecast, Investment Opportunities, Revenue, Growth, Restraints, segmentation, Analysis, Demand, Drivers
Industry Events and Analyst Meet

HIMTEX 2026

India Refining Summit 2026

India EV Show 2026

EV tech India Expo 2026

Auto Tech Asia 2026
Whitepaper
- Middle East & Africa Commercial Security Market Click here to view more.
- Middle East & Africa Fire Safety Systems & Equipment Market Click here to view more.
- GCC Drone Market Click here to view more.
- Middle East Lighting Fixture Market Click here to view more.
- GCC Physical & Perimeter Security Market Click here to view more.
6WResearch In News
- Doha a strategic location for EV manufacturing hub: IPA Qatar
- Demand for luxury TVs surging in the GCC, says Samsung
- Empowering Growth: The Thriving Journey of Bangladesh’s Cable Industry
- Demand for luxury TVs surging in the GCC, says Samsung
- Video call with a traditional healer? Once unthinkable, it’s now common in South Africa
- Intelligent Buildings To Smooth GCC’s Path To Net Zero