Croatia Micro-Irrigation Systems Market (2026-2032) | Outlook, Value, Trends, Revenue, Size, Segmentation, Companies, Share, Forecast, Industry, Growth & Analysis
Market Forecast By Mechanism (Drip Irrigation System, Sprinkler Irrigation System, Other‚), By Components (Drip Irrigation Components, Sprinkler Irrigation Components), By Cultivation Technology, By Application (Field Crops, Orchards and Vineyards, Vegetables, Plantation Crops, Other) And Competitive Landscape
| Product Code: ETC5527483 | Publication Date: Nov 2023 | Updated Date: Apr 2026 | Product Type: Market Research Report | |
| Publisher: 6Wresearch | Author: Ravi Bhandari | No. of Pages: 60 | No. of Figures: 30 | No. of Tables: 5 |
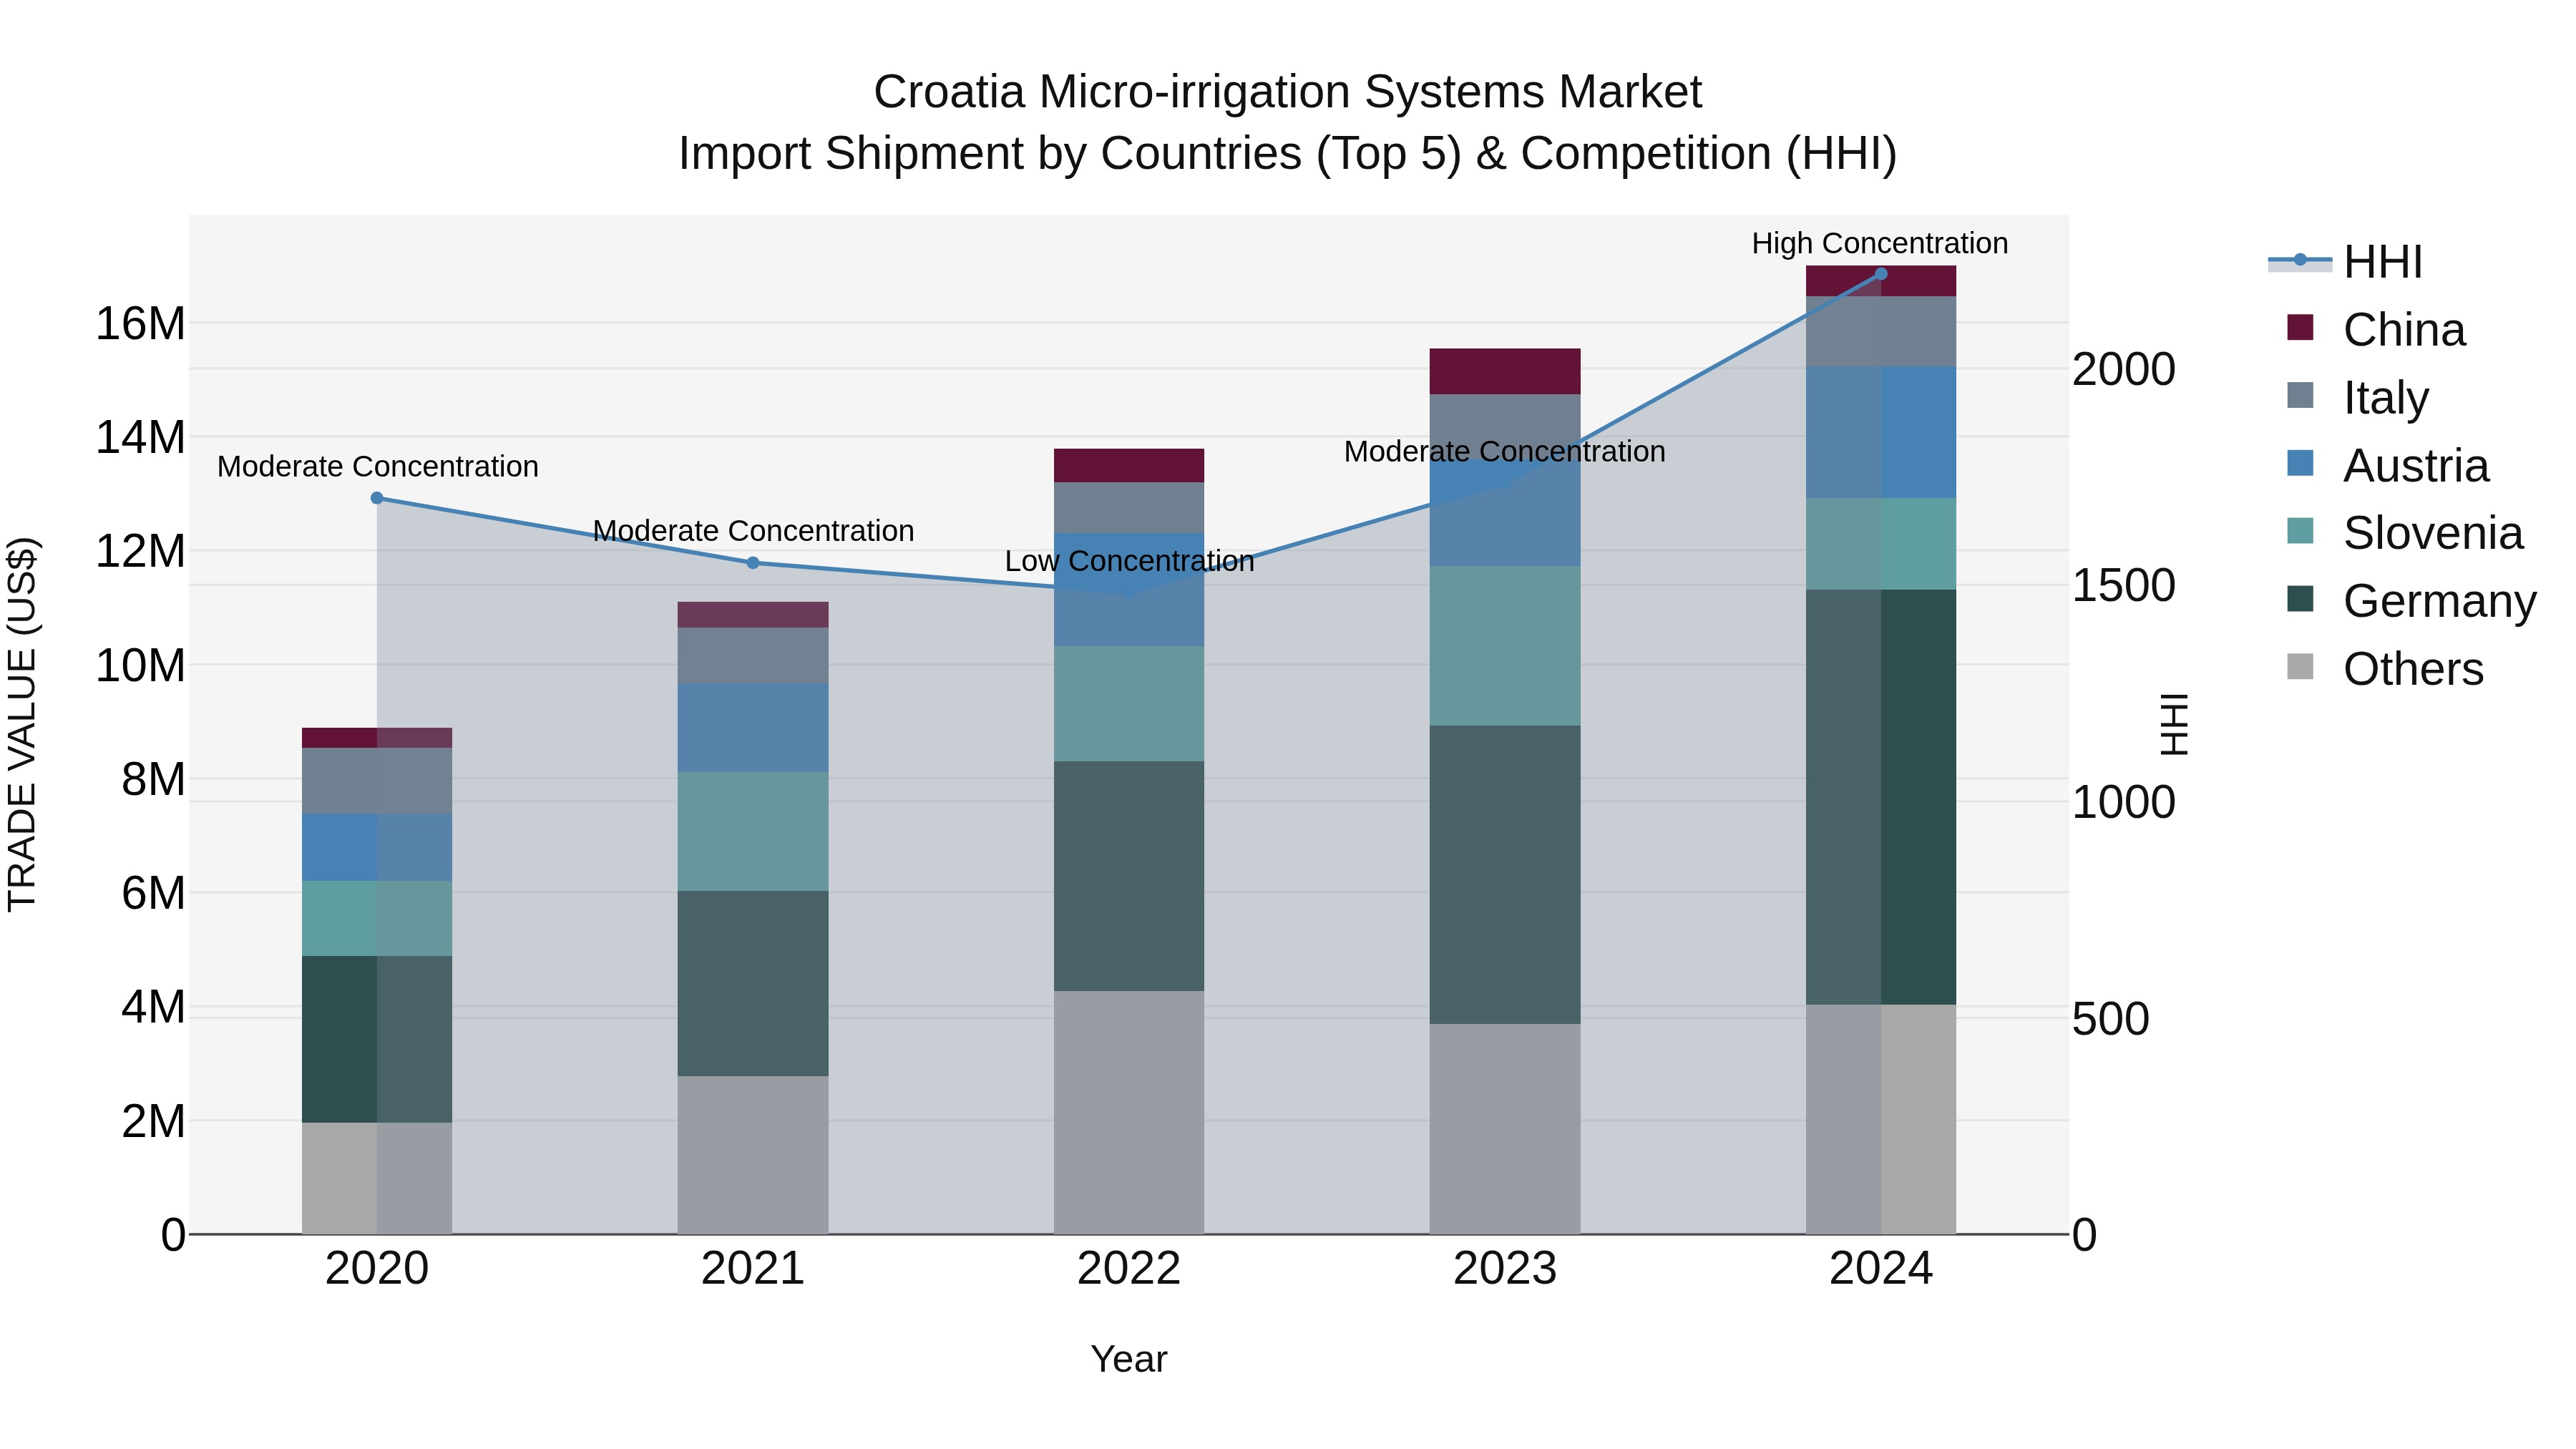
Croatia Micro-irrigation Systems Market Top 5 Importing Countries and Market Competition (HHI) Analysis
The micro-irrigation systems import shipments to Croatia in 2024 saw a notable increase in concentration, with Germany, Austria, Slovenia, Italy, and Latvia emerging as the top exporting countries. The industry experienced a strong compound annual growth rate (CAGR) of 17.58% from 2020 to 2024, with a growth rate of 9.35% from 2023 to 2024. This data suggests a growing demand for efficient irrigation solutions in Croatia, with key players from neighboring countries dominating the market.
Key Highlights of the Report:
- Croatia Micro-Irrigation Systems Market Outlook
- Market Size of Croatia Micro-Irrigation Systems Market, 2025
- Forecast of Croatia Micro-Irrigation Systems Market, 2032
- Historical Data and Forecast of Croatia Micro-Irrigation Systems Revenues & Volume for the Period 2022 - 2032F
- Croatia Micro-Irrigation Systems Market Trend Evolution
- Croatia Micro-Irrigation Systems Market Drivers and Challenges
- Croatia Micro-Irrigation Systems Price Trends
- Croatia Micro-Irrigation Systems Porter`s Five Forces
- Croatia Micro-Irrigation Systems Industry Life Cycle
- Historical Data and Forecast of Croatia Micro-Irrigation Systems Market Revenues & Volume By Mechanism for the Period 2022 - 2032F
- Historical Data and Forecast of Croatia Micro-Irrigation Systems Market Revenues & Volume By Drip Irrigation System for the Period 2022 - 2032F
- Historical Data and Forecast of Croatia Micro-Irrigation Systems Market Revenues & Volume By Sprinkler Irrigation System for the Period 2022 - 2032F
- Historical Data and Forecast of Croatia Micro-Irrigation Systems Market Revenues & Volume By Other? for the Period 2022 - 2032F
- Historical Data and Forecast of Croatia Micro-Irrigation Systems Market Revenues & Volume By Components for the Period 2022 - 2032F
- Historical Data and Forecast of Croatia Micro-Irrigation Systems Market Revenues & Volume By Drip Irrigation Components for the Period 2022 - 2032F
- Historical Data and Forecast of Croatia Micro-Irrigation Systems Market Revenues & Volume By Sprinkler Irrigation Components for the Period 2022 - 2032F
- Historical Data and Forecast of Croatia Micro-Irrigation Systems Market Revenues & Volume By Cultivation Technology for the Period 2022 - 2032F
- Historical Data and Forecast of Croatia Micro-Irrigation Systems Market Revenues & Volume By Application for the Period 2022 - 2032F
- Historical Data and Forecast of Croatia Micro-Irrigation Systems Market Revenues & Volume By Field Crops for the Period 2022 - 2032F
- Historical Data and Forecast of Croatia Micro-Irrigation Systems Market Revenues & Volume By Orchards and Vineyards for the Period 2022 - 2032F
- Historical Data and Forecast of Croatia Micro-Irrigation Systems Market Revenues & Volume By Vegetables for the Period 2022 - 2032F
- Historical Data and Forecast of Croatia Micro-Irrigation Systems Market Revenues & Volume By Plantation Crops for the Period 2022 - 2032F
- Historical Data and Forecast of Croatia Micro-Irrigation Systems Market Revenues & Volume By Other for the Period 2022 - 2032F
- Croatia Micro-Irrigation Systems Import Export Trade Statistics
- Market Opportunity Assessment By Mechanism
- Market Opportunity Assessment By Components
- Market Opportunity Assessment By Cultivation Technology
- Market Opportunity Assessment By Application
- Croatia Micro-Irrigation Systems Top Companies Market Share
- Croatia Micro-Irrigation Systems Competitive Benchmarking By Technical and Operational Parameters
- Croatia Micro-Irrigation Systems Company Profiles
- Croatia Micro-Irrigation Systems Key Strategic Recommendations
Frequently Asked Questions About the Market Study (FAQs):
6Wresearch actively monitors the Croatia Micro-Irrigation Systems Market and publishes its comprehensive annual report, highlighting emerging trends, growth drivers, revenue analysis, and forecast outlook. Our insights help businesses to make data-backed strategic decisions with ongoing market dynamics. Our analysts track relevent industries related to the Croatia Micro-Irrigation Systems Market, allowing our clients with actionable intelligence and reliable forecasts tailored to emerging regional needs.
Yes, we provide customisation as per your requirements. To learn more, feel free to contact us on sales@6wresearch.com
1 Executive Summary |
2 Introduction |
2.1 Key Highlights of the Report |
2.2 Report Description |
2.3 Market Scope & Segmentation |
2.4 Research Methodology |
2.5 Assumptions |
3 Croatia Micro-Irrigation Systems Market Overview |
3.1 Croatia Country Macro Economic Indicators |
3.2 Croatia Micro-Irrigation Systems Market Revenues & Volume, 2022 & 2032F |
3.3 Croatia Micro-Irrigation Systems Market - Industry Life Cycle |
3.4 Croatia Micro-Irrigation Systems Market - Porter's Five Forces |
3.5 Croatia Micro-Irrigation Systems Market Revenues & Volume Share, By Mechanism, 2022 & 2032F |
3.6 Croatia Micro-Irrigation Systems Market Revenues & Volume Share, By Components, 2022 & 2032F |
3.7 Croatia Micro-Irrigation Systems Market Revenues & Volume Share, By Cultivation Technology, 2022 & 2032F |
3.8 Croatia Micro-Irrigation Systems Market Revenues & Volume Share, By Application, 2022 & 2032F |
4 Croatia Micro-Irrigation Systems Market Dynamics |
4.1 Impact Analysis |
4.2 Market Drivers |
4.2.1 Increasing awareness about water conservation and sustainable agriculture practices |
4.2.2 Government initiatives promoting the adoption of micro-irrigation systems |
4.2.3 Growing demand for high-value crops and precision agriculture practices |
4.3 Market Restraints |
4.3.1 High initial investment costs associated with setting up micro-irrigation systems |
4.3.2 Lack of technical expertise and skilled labor for efficient installation and maintenance |
4.3.3 Limited availability of financing options for farmers to invest in micro-irrigation systems |
5 Croatia Micro-Irrigation Systems Market Trends |
6 Croatia Micro-Irrigation Systems Market Segmentations |
6.1 Croatia Micro-Irrigation Systems Market, By Mechanism |
6.1.1 Overview and Analysis |
6.1.2 Croatia Micro-Irrigation Systems Market Revenues & Volume, By Drip Irrigation System, 2022 - 2032F |
6.1.3 Croatia Micro-Irrigation Systems Market Revenues & Volume, By Sprinkler Irrigation System, 2022 - 2032F |
6.1.4 Croatia Micro-Irrigation Systems Market Revenues & Volume, By Other? , 2022 - 2032F |
6.2 Croatia Micro-Irrigation Systems Market, By Components |
6.2.1 Overview and Analysis |
6.2.2 Croatia Micro-Irrigation Systems Market Revenues & Volume, By Drip Irrigation Components, 2022 - 2032F |
6.2.3 Croatia Micro-Irrigation Systems Market Revenues & Volume, By Sprinkler Irrigation Components, 2022 - 2032F |
6.3 Croatia Micro-Irrigation Systems Market, By Cultivation Technology |
6.3.1 Overview and Analysis |
6.4 Croatia Micro-Irrigation Systems Market, By Application |
6.4.1 Overview and Analysis |
6.4.2 Croatia Micro-Irrigation Systems Market Revenues & Volume, By Field Crops, 2022 - 2032F |
6.4.3 Croatia Micro-Irrigation Systems Market Revenues & Volume, By Orchards and Vineyards, 2022 - 2032F | 6.4.4 Croatia Micro-Irrigation Systems Market Revenues & Volume, By Vegetables, 2022 - 2032F |
6.4.5 Croatia Micro-Irrigation Systems Market Revenues & Volume, By Plantation Crops, 2022 - 2032F |
6.4.6 Croatia Micro-Irrigation Systems Market Revenues & Volume, By Other, 2022 - 2032F |
7 Croatia Micro-Irrigation Systems Market Import-Export Trade Statistics |
7.1 Croatia Micro-Irrigation Systems Market Export to Major Countries |
7.2 Croatia Micro-Irrigation Systems Market Imports from Major Countries |
8 Croatia Micro-Irrigation Systems Market Key Performance Indicators |
8.1 Water use efficiency: measuring the amount of water saved per hectare of land through micro-irrigation systems |
8.2 Crop yield improvement: tracking the increase in crop yields attributed to the use of micro-irrigation systems |
8.3 Adoption rate: monitoring the percentage of farmers adopting micro-irrigation systems over time |
8.4 Return on investment (ROI): evaluating the financial benefits gained from implementing micro-irrigation systems |
8.5 Sustainability impact: assessing the environmental benefits such as reduced water usage and lower carbon footprint due to micro-irrigation systems usage |
9 Croatia Micro-Irrigation Systems Market - Opportunity Assessment |
9.1 Croatia Micro-Irrigation Systems Market Opportunity Assessment, By Mechanism, 2022 & 2032F |
9.2 Croatia Micro-Irrigation Systems Market Opportunity Assessment, By Components, 2022 & 2032F |
9.3 Croatia Micro-Irrigation Systems Market Opportunity Assessment, By Cultivation Technology, 2022 & 2032F |
9.4 Croatia Micro-Irrigation Systems Market Opportunity Assessment, By Application, 2022 & 2032F |
10 Croatia Micro-Irrigation Systems Market - Competitive Landscape |
10.1 Croatia Micro-Irrigation Systems Market Revenue Share, By Companies, 2025 |
10.2 Croatia Micro-Irrigation Systems Market Competitive Benchmarking, By Operating and Technical Parameters |
11 Company Profiles |
12 Recommendations | 13 Disclaimer |
Export potential assessment - trade Analytics for 2030
Export potential enables firms to identify high-growth global markets with greater confidence by combining advanced trade intelligence with a structured quantitative methodology. The framework analyzes emerging demand trends and country-level import patterns while integrating macroeconomic and trade datasets such as GDP and population forecasts, bilateral import–export flows, tariff structures, elasticity differentials between developed and developing economies, geographic distance, and import demand projections. Using weighted trade values from 2020–2024 as the base period to project country-to-country export potential for 2030, these inputs are operationalized through calculated drivers such as gravity model parameters, tariff impact factors, and projected GDP per-capita growth. Through an analysis of hidden potentials, demand hotspots, and market conditions that are most favorable to success, this method enables firms to focus on target countries, maximize returns, and global expansion with data, backed by accuracy.
By factoring in the projected importer demand gap that is currently unmet and could be potential opportunity, it identifies the potential for the Exporter (Country) among 190 countries, against the general trade analysis, which identifies the biggest importer or exporter.
To discover high-growth global markets and optimize your business strategy:
Click Here
Pricing
- Single User License$ 1,995
- Department License$ 2,400
- Site License$ 3,120
- Global License$ 3,795

Search
Thought Leadership and Analyst Meet


Our Clients
Latest Reports
- Syria Air Conditioner Market (2026-2032) | Outlook, Competition, Drivers, Trends, Demand, Competitive, Strategic Insights, Companies, Challenges, Strategy, Consumer Insights, Analysis, Opportunities, Growth, Size, Share, Industry, Revenue, Segments, Value, Segmentation, Supply, Forecast, Restraints,
- Philippines Polyhydroxybutyrate-co-Hydroxyvalerate Market (2026-2032) | Trends, Insights, Challenges, Restraints, Competition, Size, Value, Forecast, Pricing, Share, Outlook, Revenue, Investment Opportunities, Strategy, Drivers, Demand, Growth, segmentation, Analysis, Companies
- Peru Polyhydroxybutyrate-co-Hydroxyvalerate Market (2026-2032) | Growth, Demand, Challenges, Share, Trends, Analysis, Pricing, Investment Opportunities, Drivers, Value, Forecast, Competition, Size, Companies, Insights, Outlook, Restraints, segmentation, Revenue, Strategy
- Pakistan Polyhydroxybutyrate-co-Hydroxyvalerate Market (2026-2032) | Restraints, segmentation, Pricing, Forecast, Share, Strategy, Competition, Trends, Insights, Drivers, Challenges, Growth, Revenue, Outlook, Value, Investment Opportunities, Companies, Size, Analysis, Demand
- Oman Polyhydroxybutyrate-co-Hydroxyvalerate Market (2026-2032) | Drivers, segmentation, Insights, Competition, Pricing, Outlook, Size, Revenue, Challenges, Forecast, Analysis, Growth, Value, Share, Trends, Investment Opportunities, Strategy, Restraints, Companies, Demand
- Nigeria Polyhydroxybutyrate-co-Hydroxyvalerate Market (2026-2032) | Value, Investment Opportunities, Analysis, Revenue, Restraints, Pricing, Outlook, Competition, Demand, Growth, Forecast, Companies, Trends, Challenges, segmentation, Drivers, Insights, Share, Size, Strategy
- Nepal Polyhydroxybutyrate-co-Hydroxyvalerate Market (2026-2032) | Insights, Analysis, Drivers, Share, Revenue, Demand, segmentation, Investment Opportunities, Competition, Forecast, Growth, Pricing, Companies, Strategy, Trends, Restraints, Challenges, Outlook, Size, Value
- Myanmar Polyhydroxybutyrate-co-Hydroxyvalerate Market (2026-2032) | Outlook, Revenue, Strategy, Restraints, Drivers, segmentation, Share, Forecast, Competition, Insights, Growth, Pricing, Size, Demand, Value, Companies, Trends, Challenges, Investment Opportunities, Analysis
- Morocco Polyhydroxybutyrate-co-Hydroxyvalerate Market (2026-2032) | Outlook, Investment Opportunities, Restraints, Strategy, Forecast, Challenges, Drivers, Growth, Companies, segmentation, Trends, Size, Competition, Revenue, Demand, Insights, Share, Analysis, Value, Pricing
- Mexico Polyhydroxybutyrate-co-Hydroxyvalerate Market (2026-2032) | Size, Drivers, Outlook, Share, Strategy, Growth, Pricing, Challenges, Companies, Demand, Value, Investment Opportunities, Restraints, Trends, Forecast, segmentation, Analysis, Insights, Competition, Revenue
Industry Events and Analyst Meet

HIMTEX 2026

India Refining Summit 2026

India EV Show 2026

EV tech India Expo 2026

Auto Tech Asia 2026
Whitepaper
- Middle East & Africa Commercial Security Market Click here to view more.
- Middle East & Africa Fire Safety Systems & Equipment Market Click here to view more.
- GCC Drone Market Click here to view more.
- Middle East Lighting Fixture Market Click here to view more.
- GCC Physical & Perimeter Security Market Click here to view more.
6WResearch In News
- Doha a strategic location for EV manufacturing hub: IPA Qatar
- Demand for luxury TVs surging in the GCC, says Samsung
- Empowering Growth: The Thriving Journey of Bangladesh’s Cable Industry
- Demand for luxury TVs surging in the GCC, says Samsung
- Video call with a traditional healer? Once unthinkable, it’s now common in South Africa
- Intelligent Buildings To Smooth GCC’s Path To Net Zero