Croatia Muffins Market (2026-2032) | Pricing Analysis, Consumer Insights, Revenue, Segmentation, Industry, Demand, Segments, Strategy, Supply, Competition, Challenges, Value, Analysis, Size, Opportunities, Companies, Trends, Restraints, Strategic Insights, Investment Trends, Outlook, Forecast, Competitive, Drivers, Share, Growth
Market Forecast By Type (Regular Muffins, Mini Muffins, Gluten-Free Muffins, Vegan Muffins, Protein Muffins), By Flavor (Chocolate, Blueberry, Vanilla, Banana, Mixed Berry), By Form (Fresh, Frozen, Ready-to-Eat, Packaged, Baked Goods), By Application (Breakfast, Snacks, Desserts, On-the-Go, Bakery Chains), By Distribution Channel (Supermarkets, Convenience Stores, Online Retail, Specialty Stores, Wholesale Distributors) And Competitive Landscape
| Product Code: ETC12944021 | Publication Date: Apr 2025 | Updated Date: Apr 2026 | Product Type: Market Research Report | |
| Publisher: 6Wresearch | No. of Pages: 65 | No. of Figures: 34 | No. of Tables: 19 | |
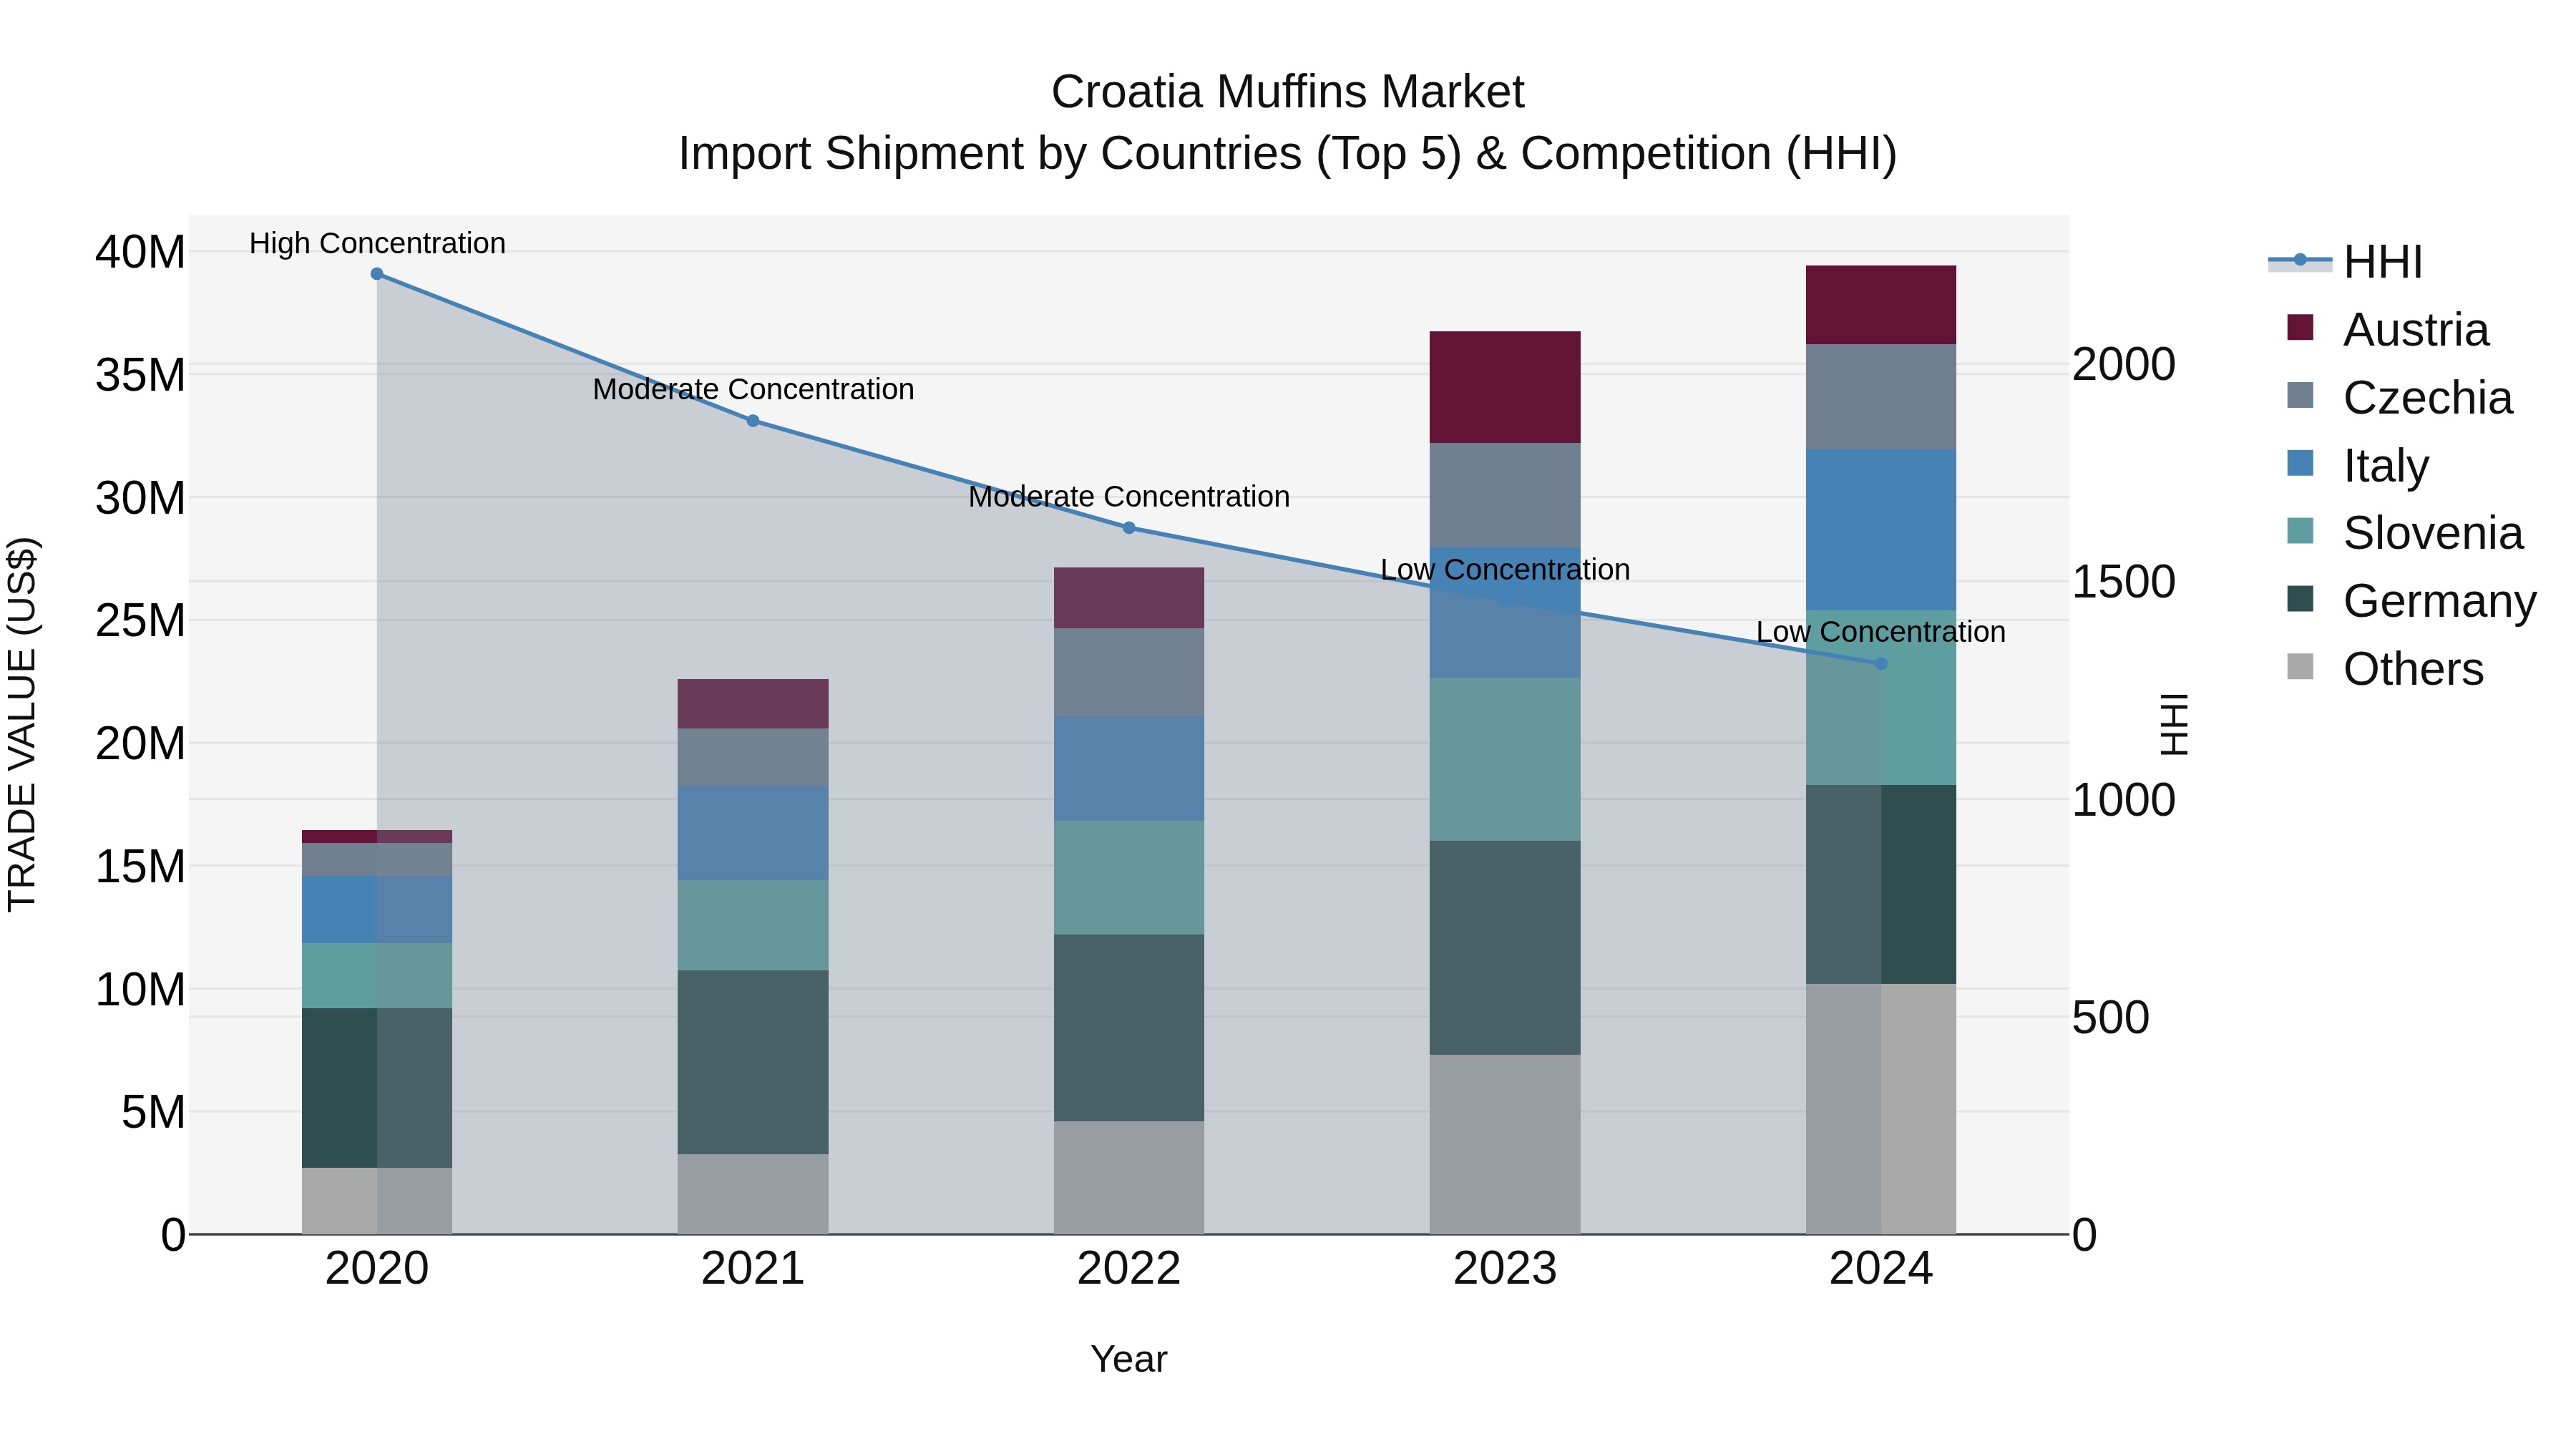
Croatia Muffins Market Top 5 Importing Countries and Market Competition (HHI) Analysis
Croatia import of muffins saw strong growth in 2024, with top suppliers being Germany, Slovenia, Italy, Czechia, and Austria. The market shows low concentration with a Herfindahl-Hirschman Index (HHI) remaining low. The impressive compound annual growth rate (CAGR) of 24.44% from 2020 to 2024 indicates a thriving market. Furthermore, the growth rate of 7.26% from 2023 to 2024 suggests sustained momentum in the import of muffins to Croatia. This data highlights the increasing popularity and demand for muffins in the Croatian market, presenting opportunities for both domestic and international suppliers.
Key Highlights of the Report:
- Croatia Muffins Market Outlook
- Market Size of Croatia Muffins Market, 2025
- Forecast of Croatia Muffins Market, 2032
- Historical Data and Forecast of Croatia Muffins Revenues & Volume for the Period 2022 - 2032F
- Croatia Muffins Market Trend Evolution
- Croatia Muffins Market Drivers and Challenges
- Croatia Muffins Price Trends
- Croatia Muffins Porter's Five Forces
- Croatia Muffins Industry Life Cycle
- Historical Data and Forecast of Croatia Muffins Market Revenues & Volume By Type for the Period 2022 - 2032F
- Historical Data and Forecast of Croatia Muffins Market Revenues & Volume By Regular Muffins for the Period 2022 - 2032F
- Historical Data and Forecast of Croatia Muffins Market Revenues & Volume By Mini Muffins for the Period 2022 - 2032F
- Historical Data and Forecast of Croatia Muffins Market Revenues & Volume By Gluten-Free Muffins for the Period 2022 - 2032F
- Historical Data and Forecast of Croatia Muffins Market Revenues & Volume By Vegan Muffins for the Period 2022 - 2032F
- Historical Data and Forecast of Croatia Muffins Market Revenues & Volume By Protein Muffins for the Period 2022 - 2032F
- Historical Data and Forecast of Croatia Muffins Market Revenues & Volume By Flavor for the Period 2022 - 2032F
- Historical Data and Forecast of Croatia Muffins Market Revenues & Volume By Chocolate for the Period 2022 - 2032F
- Historical Data and Forecast of Croatia Muffins Market Revenues & Volume By Blueberry for the Period 2022 - 2032F
- Historical Data and Forecast of Croatia Muffins Market Revenues & Volume By Vanilla for the Period 2022 - 2032F
- Historical Data and Forecast of Croatia Muffins Market Revenues & Volume By Banana for the Period 2022 - 2032F
- Historical Data and Forecast of Croatia Muffins Market Revenues & Volume By Mixed Berry for the Period 2022 - 2032F
- Historical Data and Forecast of Croatia Muffins Market Revenues & Volume By Form for the Period 2022 - 2032F
- Historical Data and Forecast of Croatia Muffins Market Revenues & Volume By Fresh for the Period 2022 - 2032F
- Historical Data and Forecast of Croatia Muffins Market Revenues & Volume By Frozen for the Period 2022 - 2032F
- Historical Data and Forecast of Croatia Muffins Market Revenues & Volume By Ready-to-Eat for the Period 2022 - 2032F
- Historical Data and Forecast of Croatia Muffins Market Revenues & Volume By Packaged for the Period 2022 - 2032F
- Historical Data and Forecast of Croatia Muffins Market Revenues & Volume By Baked Goods for the Period 2022 - 2032F
- Historical Data and Forecast of Croatia Muffins Market Revenues & Volume By Application for the Period 2022 - 2032F
- Historical Data and Forecast of Croatia Muffins Market Revenues & Volume By Breakfast for the Period 2022 - 2032F
- Historical Data and Forecast of Croatia Muffins Market Revenues & Volume By Snacks for the Period 2022 - 2032F
- Historical Data and Forecast of Croatia Muffins Market Revenues & Volume By Desserts for the Period 2022 - 2032F
- Historical Data and Forecast of Croatia Muffins Market Revenues & Volume By On-the-Go for the Period 2022 - 2032F
- Historical Data and Forecast of Croatia Muffins Market Revenues & Volume By Bakery Chains for the Period 2022 - 2032F
- Historical Data and Forecast of Croatia Muffins Market Revenues & Volume By Distribution Channel for the Period 2022 - 2032F
- Historical Data and Forecast of Croatia Muffins Market Revenues & Volume By Supermarkets for the Period 2022 - 2032F
- Historical Data and Forecast of Croatia Muffins Market Revenues & Volume By Convenience Stores for the Period 2022 - 2032F
- Historical Data and Forecast of Croatia Muffins Market Revenues & Volume By Online Retail for the Period 2022 - 2032F
- Historical Data and Forecast of Croatia Muffins Market Revenues & Volume By Specialty Stores for the Period 2022 - 2032F
- Historical Data and Forecast of Croatia Muffins Market Revenues & Volume By Wholesale Distributors for the Period 2022 - 2032F
- Croatia Muffins Import Export Trade Statistics
- Market Opportunity Assessment By Type
- Market Opportunity Assessment By Flavor
- Market Opportunity Assessment By Form
- Market Opportunity Assessment By Application
- Market Opportunity Assessment By Distribution Channel
- Croatia Muffins Top Companies Market Share
- Croatia Muffins Competitive Benchmarking By Technical and Operational Parameters
- Croatia Muffins Company Profiles
- Croatia Muffins Key Strategic Recommendations
Frequently Asked Questions About the Market Study (FAQs):
6Wresearch actively monitors the Croatia Muffins Market and publishes its comprehensive annual report, highlighting emerging trends, growth drivers, revenue analysis, and forecast outlook. Our insights help businesses to make data-backed strategic decisions with ongoing market dynamics. Our analysts track relevent industries related to the Croatia Muffins Market, allowing our clients with actionable intelligence and reliable forecasts tailored to emerging regional needs.
Yes, we provide customisation as per your requirements. To learn more, feel free to contact us on sales@6wresearch.com
1 Executive Summary |
2 Introduction |
2.1 Key Highlights of the Report |
2.2 Report Description |
2.3 Market Scope & Segmentation |
2.4 Research Methodology |
2.5 Assumptions |
3 Croatia Muffins Market Overview |
3.1 Croatia Country Macro Economic Indicators |
3.2 Croatia Muffins Market Revenues & Volume, 2022 & 2032F |
3.3 Croatia Muffins Market - Industry Life Cycle |
3.4 Croatia Muffins Market - Porter's Five Forces |
3.5 Croatia Muffins Market Revenues & Volume Share, By Type, 2022 & 2032F |
3.6 Croatia Muffins Market Revenues & Volume Share, By Flavor, 2022 & 2032F |
3.7 Croatia Muffins Market Revenues & Volume Share, By Form, 2022 & 2032F |
3.8 Croatia Muffins Market Revenues & Volume Share, By Application, 2022 & 2032F |
3.9 Croatia Muffins Market Revenues & Volume Share, By Distribution Channel, 2022 & 2032F |
4 Croatia Muffins Market Dynamics |
4.1 Impact Analysis |
4.2 Market Drivers |
4.2.1 Increasing consumer demand for convenient and indulgent snack options |
4.2.2 Growing popularity of bakery products in Croatia |
4.2.3 Expansion of distribution channels for muffins, such as cafes and supermarkets |
4.3 Market Restraints |
4.3.1 Health concerns and awareness leading to a shift towards healthier snack alternatives |
4.3.2 Competition from other snack products like energy bars and granola bars |
5 Croatia Muffins Market Trends |
6 Croatia Muffins Market, By Types |
6.1 Croatia Muffins Market, By Type |
6.1.1 Overview and Analysis |
6.1.2 Croatia Muffins Market Revenues & Volume, By Type, 2022 - 2032F |
6.1.3 Croatia Muffins Market Revenues & Volume, By Regular Muffins, 2022 - 2032F |
6.1.4 Croatia Muffins Market Revenues & Volume, By Mini Muffins, 2022 - 2032F |
6.1.5 Croatia Muffins Market Revenues & Volume, By Gluten-Free Muffins, 2022 - 2032F |
6.1.6 Croatia Muffins Market Revenues & Volume, By Vegan Muffins, 2022 - 2032F |
6.1.7 Croatia Muffins Market Revenues & Volume, By Protein Muffins, 2022 - 2032F |
6.2 Croatia Muffins Market, By Flavor |
6.2.1 Overview and Analysis |
6.2.2 Croatia Muffins Market Revenues & Volume, By Chocolate, 2022 - 2032F |
6.2.3 Croatia Muffins Market Revenues & Volume, By Blueberry, 2022 - 2032F |
6.2.4 Croatia Muffins Market Revenues & Volume, By Vanilla, 2022 - 2032F |
6.2.5 Croatia Muffins Market Revenues & Volume, By Banana, 2022 - 2032F |
6.2.6 Croatia Muffins Market Revenues & Volume, By Mixed Berry, 2022 - 2032F |
6.3 Croatia Muffins Market, By Form |
6.3.1 Overview and Analysis |
6.3.2 Croatia Muffins Market Revenues & Volume, By Fresh, 2022 - 2032F |
6.3.3 Croatia Muffins Market Revenues & Volume, By Frozen, 2022 - 2032F |
6.3.4 Croatia Muffins Market Revenues & Volume, By Ready-to-Eat, 2022 - 2032F |
6.3.5 Croatia Muffins Market Revenues & Volume, By Packaged, 2022 - 2032F |
6.3.6 Croatia Muffins Market Revenues & Volume, By Baked Goods, 2022 - 2032F |
6.4 Croatia Muffins Market, By Application |
6.4.1 Overview and Analysis |
6.4.2 Croatia Muffins Market Revenues & Volume, By Breakfast, 2022 - 2032F |
6.4.3 Croatia Muffins Market Revenues & Volume, By Snacks, 2022 - 2032F |
6.4.4 Croatia Muffins Market Revenues & Volume, By Desserts, 2022 - 2032F |
6.4.5 Croatia Muffins Market Revenues & Volume, By On-the-Go, 2022 - 2032F |
6.4.6 Croatia Muffins Market Revenues & Volume, By Bakery Chains, 2022 - 2032F |
6.5 Croatia Muffins Market, By Distribution Channel |
6.5.1 Overview and Analysis |
6.5.2 Croatia Muffins Market Revenues & Volume, By Supermarkets, 2022 - 2032F |
6.5.3 Croatia Muffins Market Revenues & Volume, By Convenience Stores, 2022 - 2032F |
6.5.4 Croatia Muffins Market Revenues & Volume, By Online Retail, 2022 - 2032F |
6.5.5 Croatia Muffins Market Revenues & Volume, By Specialty Stores, 2022 - 2032F |
6.5.6 Croatia Muffins Market Revenues & Volume, By Wholesale Distributors, 2022 - 2032F |
7 Croatia Muffins Market Import-Export Trade Statistics |
7.1 Croatia Muffins Market Export to Major Countries |
7.2 Croatia Muffins Market Imports from Major Countries |
8 Croatia Muffins Market Key Performance Indicators |
8.1 Average number of new muffin product launches in the market |
8.2 Percentage growth in online sales of muffins |
8.3 Number of cafes and supermarkets offering muffins on their menus |
8.4 Customer satisfaction ratings for muffin products |
8.5 Growth in the number of muffin specialty bakeries in Croatia |
9 Croatia Muffins Market - Opportunity Assessment |
9.1 Croatia Muffins Market Opportunity Assessment, By Type, 2022 & 2032F |
9.2 Croatia Muffins Market Opportunity Assessment, By Flavor, 2022 & 2032F |
9.3 Croatia Muffins Market Opportunity Assessment, By Form, 2022 & 2032F |
9.4 Croatia Muffins Market Opportunity Assessment, By Application, 2022 & 2032F |
9.5 Croatia Muffins Market Opportunity Assessment, By Distribution Channel, 2022 & 2032F |
10 Croatia Muffins Market - Competitive Landscape |
10.1 Croatia Muffins Market Revenue Share, By Companies, 2025 |
10.2 Croatia Muffins Market Competitive Benchmarking, By Operating and Technical Parameters |
11 Company Profiles |
12 Recommendations |
13 Disclaimer |
Global Go To Market Strategy - 2030
Export potential enables firms to identify high-growth global markets with greater confidence by combining advanced trade intelligence with a structured quantitative methodology. The framework analyzes emerging demand trends and country-level import patterns while integrating macroeconomic and trade datasets such as GDP and population forecasts, bilateral import–export flows, tariff structures, elasticity differentials between developed and developing economies, geographic distance, and import demand projections. Using weighted trade values from 2020–2024 as the base period to project country-to-country export potential for 2030, these inputs are operationalized through calculated drivers such as gravity model parameters, tariff impact factors, and projected GDP per-capita growth. Through an analysis of hidden potentials, demand hotspots, and market conditions that are most favorable to success, this method enables firms to focus on target countries, maximize returns, and global expansion with data, backed by accuracy.
By factoring in the projected importer demand gap that is currently unmet and could be potential opportunity, it identifies the potential for the Exporter (Country) among 190 countries, against the general trade analysis, which identifies the biggest importer or exporter.
To discover high-growth global markets and optimize your business strategy:
Click Here
Pricing
- Single User License$ 1,995
- Department License$ 2,400
- Site License$ 3,120
- Global License$ 3,795

Leadership Perspectives from Industry Events
Search
Thought Leadership and Analyst Meet


Our Clients
6WResearch In News
- Doha a strategic location for EV manufacturing hub: IPA Qatar
- Demand for luxury TVs surging in the GCC, says Samsung
- Empowering Growth: The Thriving Journey of Bangladesh’s Cable Industry
- Demand for luxury TVs surging in the GCC, says Samsung
- Video call with a traditional healer? Once unthinkable, it’s now common in South Africa
- Intelligent Buildings To Smooth GCC’s Path To Net Zero
Latest Reports
- Cape Verde Portable Hand-Thrown Extinguisher Market (2026-2032)
- Canada Portable Hand-Thrown Extinguisher Market (2026-2032)
- Cameroon Portable Hand-Thrown Extinguisher Market (2026-2032)
- Burundi Portable Hand-Thrown Extinguisher Market (2026-2032)
- Burkina Faso Portable Hand-Thrown Extinguisher Market (2026-2032)
- Bulgaria Portable Hand-Thrown Extinguisher Market (2026-2032)
- Brunei Portable Hand-Thrown Extinguisher Market (2026-2032)
- Botswana Portable Hand-Thrown Extinguisher Market (2026-2032)
- Bosnia and Herzegovina Portable Hand-Thrown Extinguisher Market (2026-2032)
- Bolivia Portable Hand-Thrown Extinguisher Market (2026-2032)
Industry Events and Analyst Meet

HIMTEX 2026

India Refining Summit 2026

India EV Show 2026

EV tech India Expo 2026

Auto Tech Asia 2026
Whitepaper
- Middle East & Africa Commercial Security Market Click here to view more.
- Middle East & Africa Fire Safety Systems & Equipment Market Click here to view more.
- GCC Drone Market Click here to view more.
- Middle East Lighting Fixture Market Click here to view more.
- GCC Physical & Perimeter Security Market Click here to view more.