Croatia Paperboard Jar Market (2026-2032) | Growth, Companies, Outlook, Forecast, Industry, Segmentation, Analysis, Value, Trends, Share, Size & Revenue, Competitive Landscape
Market Forecast By Neck Diameter (Up to 50 mm, 51 mm 100 mm, 101 mm & Above), By Closure Type (Caps, Snap-on, Plug, Lids, Metal, Plastic, Paperboard Ends), By End Use (Personal Care & Cosmetics, Coffee and Tea, Food & Beverages, Snacks & Confectionery, Industrial Goods, Consumer Goods, Others) And Competitive Landscape
| Product Code: ETC6858124 | Publication Date: Sep 2024 | Updated Date: Apr 2026 | Product Type: Market Research Report | |
| Publisher: 6Wresearch | Author: Summon Dutta | No. of Pages: 75 | No. of Figures: 35 | No. of Tables: 20 |
Croatia Paperboard Jar Market Size (2020-2030)
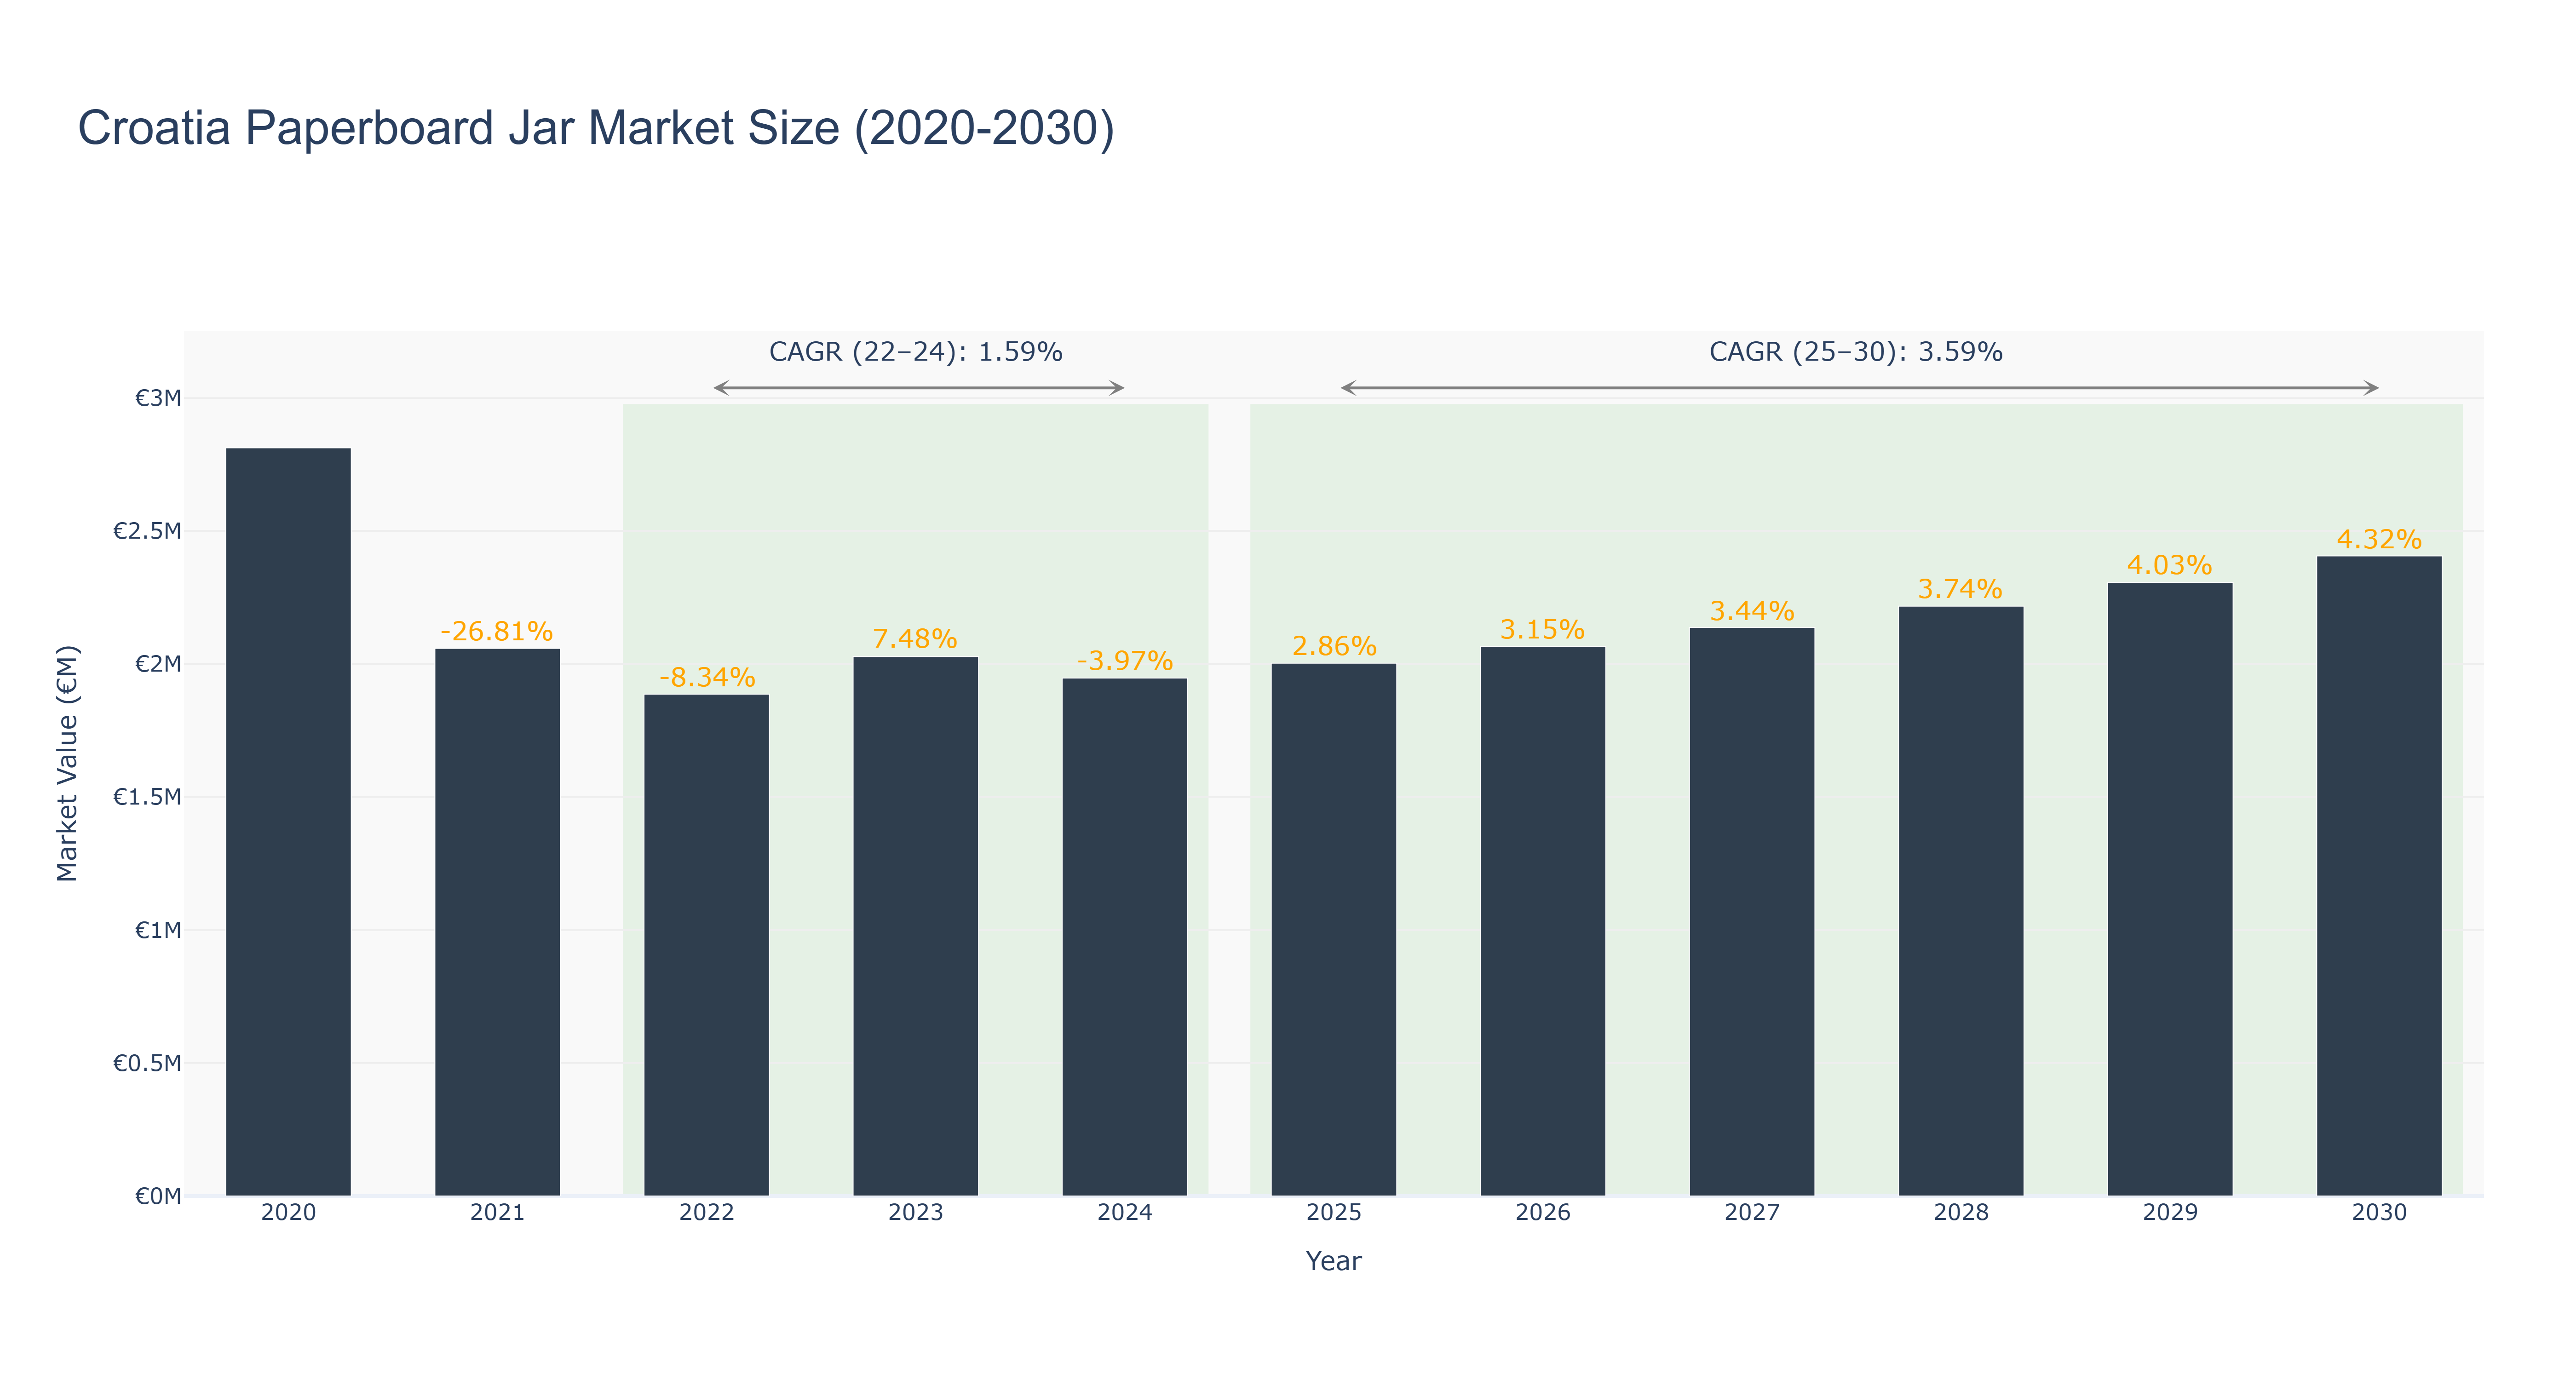
Croatia Paperboard Jar Market has shown a fluctuating trend in recent years. The peak market size of €2.81 million was recorded in 2020, followed by a decline to €1.95 million in 2024. However, the market has been steadily recovering with a forecasted size of €2.41 million in 2030, indicating a positive growth trajectory. The CAGR for the period 2022-24 was 1.59%, while the CAGR for 2025-30 is projected to be 3.59%. The market experienced a downturn due to economic uncertainties and changing consumer preferences, but the upward trend can be attributed to increasing demand for sustainable packaging solutions in the region. Moving forward, Croatia is set to introduce new recycling initiatives and eco-friendly packaging regulations, which are expected to further drive growth in the paperboard jar market.
Croatia Paperboard Jar Market: Production & Trade Performance (2019-2025)
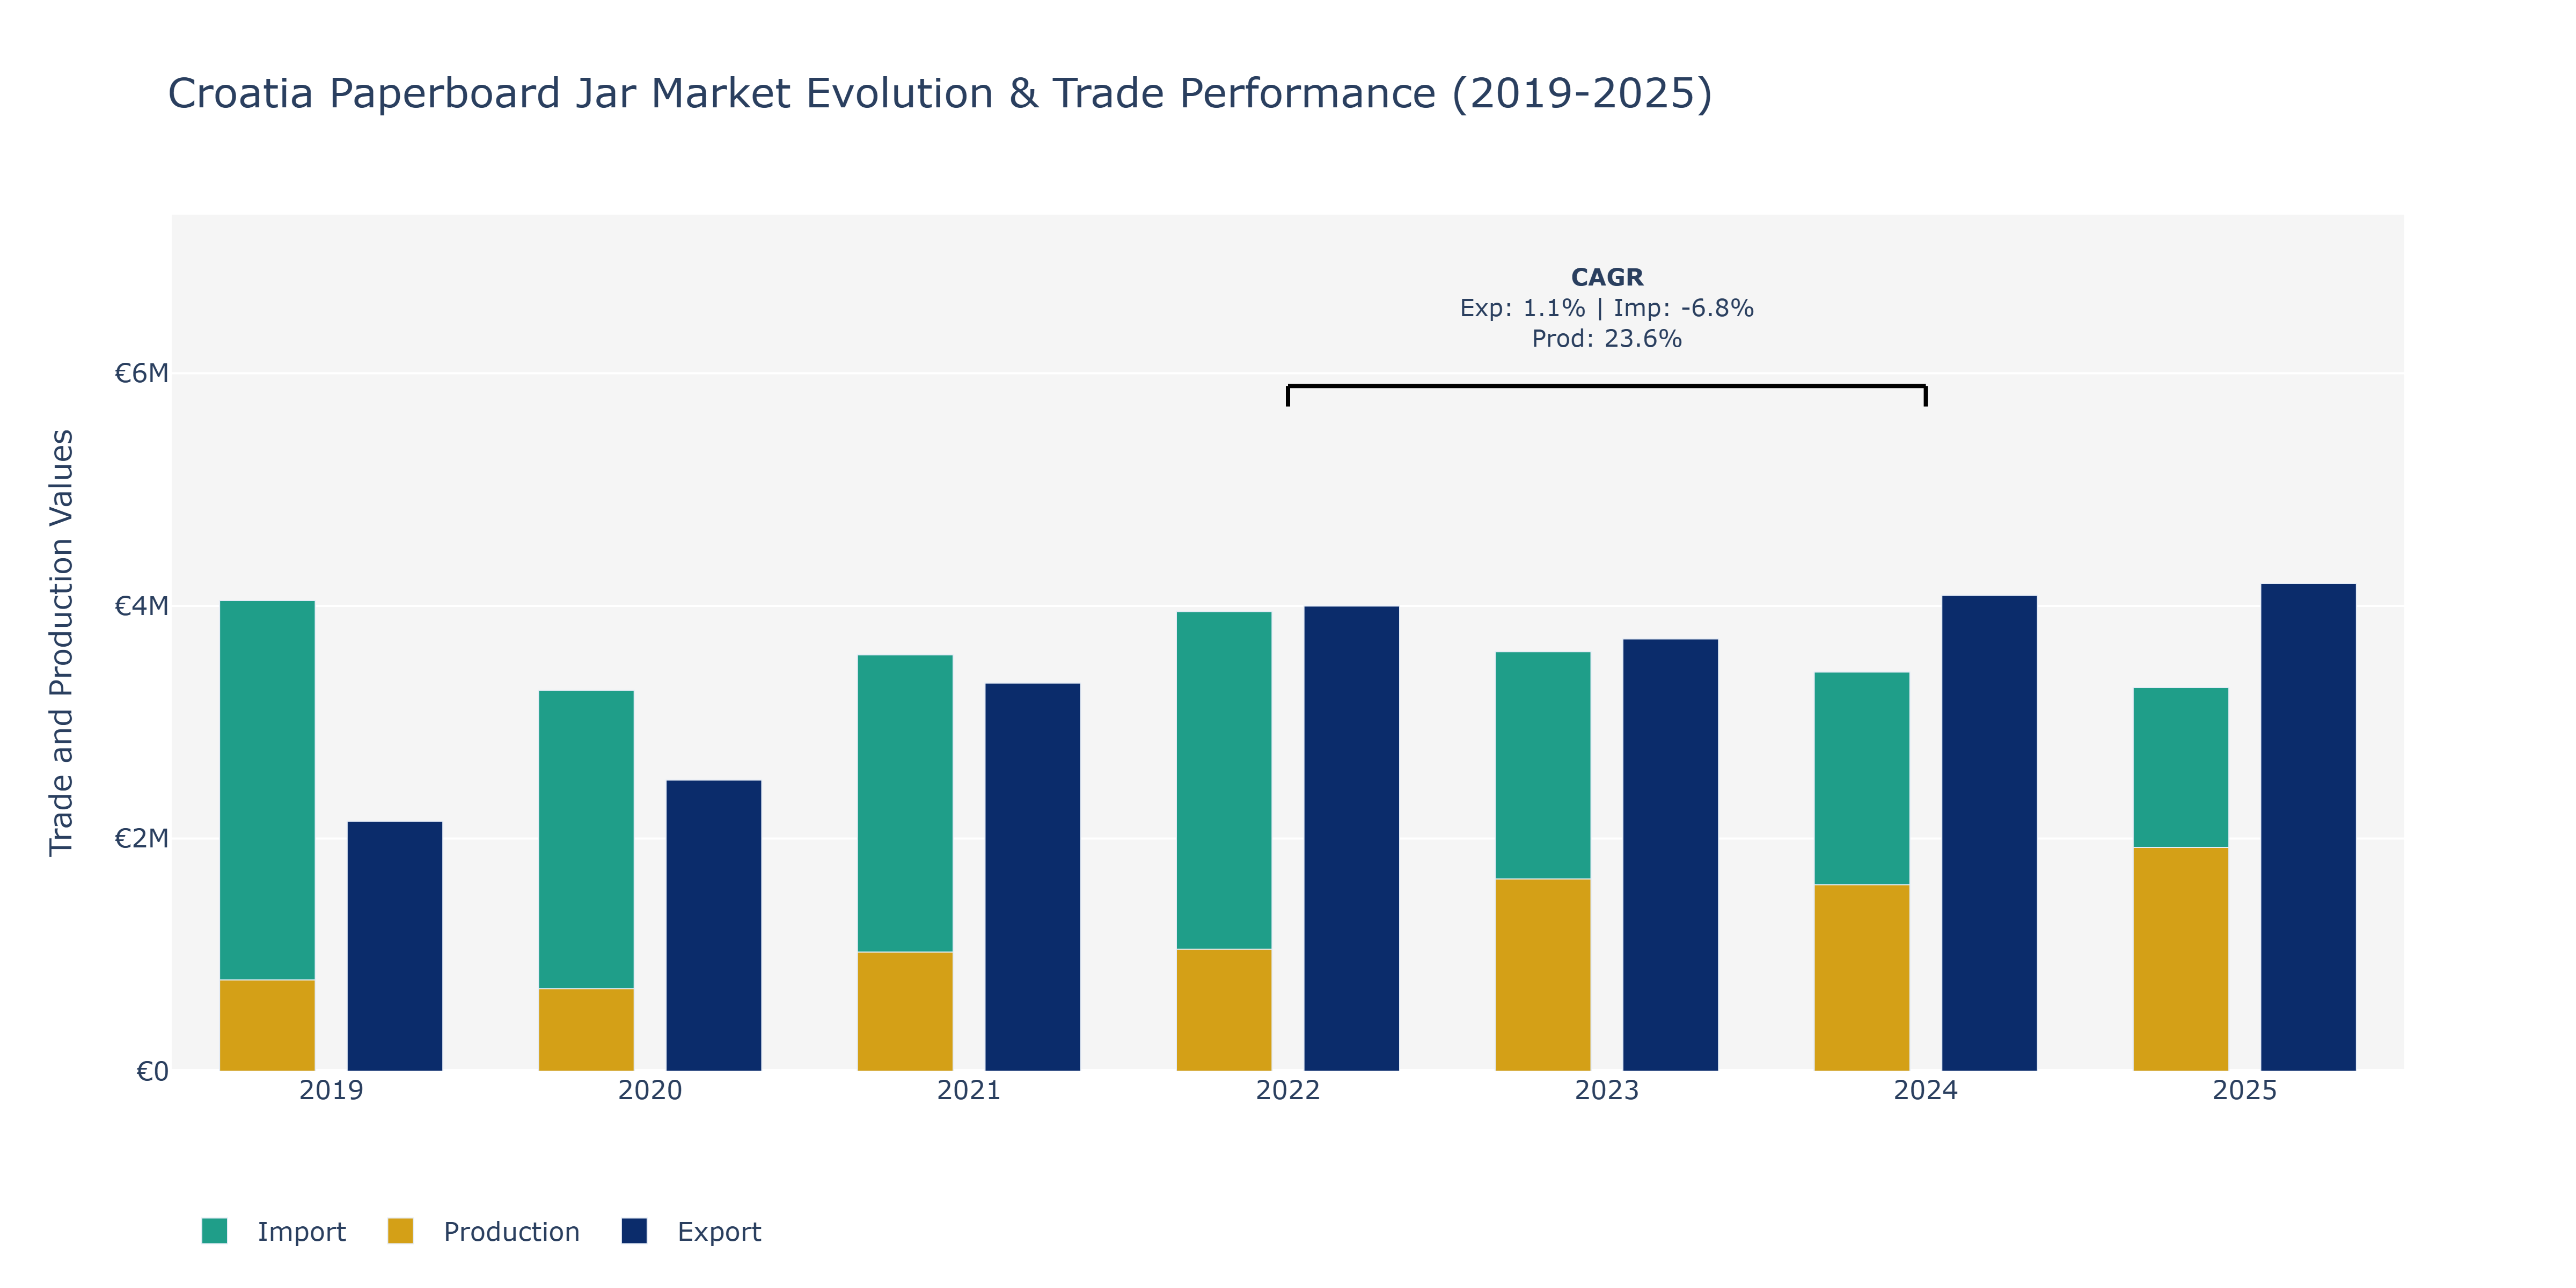
Between 2019 and 2025, the Croatia Paperboard Jar Market displayed intriguing dynamics in Exports, Imports, and Production. Exports showed a steady growth trajectory, increasing from €2.15 million in 2019 to around €4.19 million in 2025. In contrast, Imports experienced fluctuations, initially decreasing to €3.43 million in 2024 before slightly rebounding to €3.3 million in 2025. Production notably surged, more than doubling from €783 million in 2019 to approximately €1.92 million in 2025. The peak in production in 2025 aligns with a notable 23.62% CAGR observed between 2022 and 2024. These shifts could be attributed to evolving consumer preferences towards sustainable packaging solutions and increased demand for eco-friendly packaging in various industries. Additionally, advancements in technology and manufacturing processes may have played a role in enhancing production capabilities, leading to the significant rise in production output.
Key Highlights of the Report:
- Croatia Paperboard Jar Market Outlook
- Market Size of Croatia Paperboard Jar Market, 2025
- Forecast of Croatia Paperboard Jar Market, 2032
- Historical Data and Forecast of Croatia Paperboard Jar Revenues & Volume for the Period 2022 - 2032
- Croatia Paperboard Jar Market Trend Evolution
- Croatia Paperboard Jar Market Drivers and Challenges
- Croatia Paperboard Jar Price Trends
- Croatia Paperboard Jar Porter's Five Forces
- Croatia Paperboard Jar Industry Life Cycle
- Historical Data and Forecast of Croatia Paperboard Jar Market Revenues & Volume By Neck Diameter for the Period 2022 - 2032
- Historical Data and Forecast of Croatia Paperboard Jar Market Revenues & Volume By Up to 50 mm for the Period 2022 - 2032
- Historical Data and Forecast of Croatia Paperboard Jar Market Revenues & Volume By 51 mm 100 mm for the Period 2022 - 2032
- Historical Data and Forecast of Croatia Paperboard Jar Market Revenues & Volume By 101 mm & Above for the Period 2022 - 2032
- Historical Data and Forecast of Croatia Paperboard Jar Market Revenues & Volume By Closure Type for the Period 2022 - 2032
- Historical Data and Forecast of Croatia Paperboard Jar Market Revenues & Volume By Caps for the Period 2022 - 2032
- Historical Data and Forecast of Croatia Paperboard Jar Market Revenues & Volume By Snap-on for the Period 2022 - 2032
- Historical Data and Forecast of Croatia Paperboard Jar Market Revenues & Volume By Plug for the Period 2022 - 2032
- Historical Data and Forecast of Croatia Paperboard Jar Market Revenues & Volume By Lids for the Period 2022 - 2032
- Historical Data and Forecast of Croatia Paperboard Jar Market Revenues & Volume By Metal for the Period 2022 - 2032
- Historical Data and Forecast of Croatia Paperboard Jar Market Revenues & Volume By Plastic for the Period 2022 - 2032
- Historical Data and Forecast of Croatia Paperboard Jar Market Revenues & Volume By Paperboard Ends for the Period 2022 - 2032
- Historical Data and Forecast of Croatia Paperboard Jar Market Revenues & Volume By End Use for the Period 2022 - 2032
- Historical Data and Forecast of Croatia Paperboard Jar Market Revenues & Volume By Personal Care & Cosmetics for the Period 2022 - 2032
- Historical Data and Forecast of Croatia Paperboard Jar Market Revenues & Volume By Coffee and Tea for the Period 2022 - 2032
- Historical Data and Forecast of Croatia Paperboard Jar Market Revenues & Volume By Food & Beverages for the Period 2022 - 2032
- Historical Data and Forecast of Croatia Paperboard Jar Market Revenues & Volume By Snacks & Confectionery for the Period 2022 - 2032
- Historical Data and Forecast of Croatia Paperboard Jar Market Revenues & Volume By Industrial Goods for the Period 2022 - 2032
- Historical Data and Forecast of Croatia Paperboard Jar Market Revenues & Volume By Consumer Goods for the Period 2022 - 2032
- Historical Data and Forecast of Croatia Paperboard Jar Market Revenues & Volume By Others for the Period 2022 - 2032
- Croatia Paperboard Jar Import Export Trade Statistics
- Market Opportunity Assessment By Neck Diameter
- Market Opportunity Assessment By Closure Type
- Market Opportunity Assessment By End Use
- Croatia Paperboard Jar Top Companies Market Share
- Croatia Paperboard Jar Competitive Benchmarking By Technical and Operational Parameters
- Croatia Paperboard Jar Company Profiles
- Croatia Paperboard Jar Key Strategic Recommendations
Frequently Asked Questions About the Market Study (FAQs):
6Wresearch actively monitors the Croatia Paperboard Jar Market and publishes its comprehensive annual report, highlighting emerging trends, growth drivers, revenue analysis, and forecast outlook. Our insights help businesses to make data-backed strategic decisions with ongoing market dynamics. Our analysts track relevent industries related to the Croatia Paperboard Jar Market, allowing our clients with actionable intelligence and reliable forecasts tailored to emerging regional needs.
Yes, we provide customisation as per your requirements. To learn more, feel free to contact us on sales@6wresearch.com
1 Executive Summary |
2 Introduction |
2.1 Key Highlights of the Report |
2.2 Report Description |
2.3 Market Scope & Segmentation |
2.4 Research Methodology |
2.5 Assumptions |
3 Croatia Paperboard Jar Market Overview |
3.1 Croatia Country Macro Economic Indicators |
3.2 Croatia Paperboard Jar Market Revenues & Volume, 2022 & 2032F |
3.3 Croatia Paperboard Jar Market - Industry Life Cycle |
3.4 Croatia Paperboard Jar Market - Porter's Five Forces |
3.5 Croatia Paperboard Jar Market Revenues & Volume Share, By Neck Diameter, 2022 & 2032F |
3.6 Croatia Paperboard Jar Market Revenues & Volume Share, By Closure Type, 2022 & 2032F |
3.7 Croatia Paperboard Jar Market Revenues & Volume Share, By End Use, 2022 & 2032F |
4 Croatia Paperboard Jar Market Dynamics |
4.1 Impact Analysis |
4.2 Market Drivers |
4.2.1 Increasing demand for eco-friendly packaging solutions |
4.2.2 Growing awareness about sustainable packaging practices |
4.2.3 Rise in the food and beverage industry in Croatia |
4.3 Market Restraints |
4.3.1 Fluctuating raw material prices |
4.3.2 Intense competition from alternative packaging solutions |
4.3.3 Regulatory challenges related to packaging materials |
5 Croatia Paperboard Jar Market Trends |
6 Croatia Paperboard Jar Market, By Types |
6.1 Croatia Paperboard Jar Market, By Neck Diameter |
6.1.1 Overview and Analysis |
6.1.2 Croatia Paperboard Jar Market Revenues & Volume, By Neck Diameter, 2022 - 2032F |
6.1.3 Croatia Paperboard Jar Market Revenues & Volume, By Up to 50 mm, 2022 - 2032F |
6.1.4 Croatia Paperboard Jar Market Revenues & Volume, By 51 mm 100 mm, 2022 - 2032F |
6.1.5 Croatia Paperboard Jar Market Revenues & Volume, By 101 mm & Above, 2022 - 2032F |
6.2 Croatia Paperboard Jar Market, By Closure Type |
6.2.1 Overview and Analysis |
6.2.2 Croatia Paperboard Jar Market Revenues & Volume, By Caps, 2022 - 2032F |
6.2.3 Croatia Paperboard Jar Market Revenues & Volume, By Snap-on, 2022 - 2032F |
6.2.4 Croatia Paperboard Jar Market Revenues & Volume, By Plug, 2022 - 2032F |
6.2.5 Croatia Paperboard Jar Market Revenues & Volume, By Lids, 2022 - 2032F |
6.2.6 Croatia Paperboard Jar Market Revenues & Volume, By Metal, 2022 - 2032F |
6.2.7 Croatia Paperboard Jar Market Revenues & Volume, By Plastic, 2022 - 2032F |
6.3 Croatia Paperboard Jar Market, By End Use |
6.3.1 Overview and Analysis |
6.3.2 Croatia Paperboard Jar Market Revenues & Volume, By Personal Care & Cosmetics, 2022 - 2032F |
6.3.3 Croatia Paperboard Jar Market Revenues & Volume, By Coffee and Tea, 2022 - 2032F |
6.3.4 Croatia Paperboard Jar Market Revenues & Volume, By Food & Beverages, 2022 - 2032F |
6.3.5 Croatia Paperboard Jar Market Revenues & Volume, By Snacks & Confectionery, 2022 - 2032F |
6.3.6 Croatia Paperboard Jar Market Revenues & Volume, By Industrial Goods, 2022 - 2032F |
6.3.7 Croatia Paperboard Jar Market Revenues & Volume, By Consumer Goods, 2022 - 2032F |
7 Croatia Paperboard Jar Market Import-Export Trade Statistics |
7.1 Croatia Paperboard Jar Market Export to Major Countries |
7.2 Croatia Paperboard Jar Market Imports from Major Countries |
8 Croatia Paperboard Jar Market Key Performance Indicators |
8.1 Percentage of recycled material used in paperboard jars |
8.2 Number of new product launches using paperboard jars |
8.3 Adoption rate of paperboard jars by key players in the food and beverage industry |
9 Croatia Paperboard Jar Market - Opportunity Assessment |
9.1 Croatia Paperboard Jar Market Opportunity Assessment, By Neck Diameter, 2022 & 2032F |
9.2 Croatia Paperboard Jar Market Opportunity Assessment, By Closure Type, 2022 & 2032F |
9.3 Croatia Paperboard Jar Market Opportunity Assessment, By End Use, 2022 & 2032F |
10 Croatia Paperboard Jar Market - Competitive Landscape |
10.1 Croatia Paperboard Jar Market Revenue Share, By Companies, 2025 |
10.2 Croatia Paperboard Jar Market Competitive Benchmarking, By Operating and Technical Parameters |
11 Company Profiles |
12 Recommendations |
13 Disclaimer |
Export potential assessment - trade Analytics for 2030
Export potential enables firms to identify high-growth global markets with greater confidence by combining advanced trade intelligence with a structured quantitative methodology. The framework analyzes emerging demand trends and country-level import patterns while integrating macroeconomic and trade datasets such as GDP and population forecasts, bilateral import–export flows, tariff structures, elasticity differentials between developed and developing economies, geographic distance, and import demand projections. Using weighted trade values from 2020–2024 as the base period to project country-to-country export potential for 2030, these inputs are operationalized through calculated drivers such as gravity model parameters, tariff impact factors, and projected GDP per-capita growth. Through an analysis of hidden potentials, demand hotspots, and market conditions that are most favorable to success, this method enables firms to focus on target countries, maximize returns, and global expansion with data, backed by accuracy.
By factoring in the projected importer demand gap that is currently unmet and could be potential opportunity, it identifies the potential for the Exporter (Country) among 190 countries, against the general trade analysis, which identifies the biggest importer or exporter.
To discover high-growth global markets and optimize your business strategy:
Click Here
Pricing
- Single User License$ 1,995
- Department License$ 2,400
- Site License$ 3,120
- Global License$ 3,795

Search
Thought Leadership and Analyst Meet


Our Clients
Latest Reports
- China Electric Appliance Rental Market (2026-2032) | Trends, Revenue, Growth, Challenges, Size, Value, Outlook, Pricing, Strategy, Insights, Restraints, segmentation, Companies, Investment Opportunities, Analysis, Demand, Drivers, Competition, Forecast, Share
- Chile Electric Appliance Rental Market (2026-2032) | Outlook, Competition, Drivers, Strategy, Revenue, Analysis, Value, Pricing, Restraints, Size, Demand, Share, Growth, Forecast, Challenges, Insights, Investment Opportunities, Companies, Trends, segmentation
- Cambodia Electric Appliance Rental Market (2026-2032) | Companies, Analysis, Restraints, Pricing, Insights, Challenges, Outlook, Strategy, Forecast, Trends, Competition, Value, Revenue, Investment Opportunities, segmentation, Drivers, Size, Demand, Growth, Share
- Brazil Electric Appliance Rental Market (2026-2032) | Revenue, Strategy, Forecast, Companies, segmentation, Competition, Size, Investment Opportunities, Pricing, Restraints, Outlook, Challenges, Analysis, Drivers, Value, Demand, Insights, Trends, Growth, Share
- Bangladesh Electric Appliance Rental Market (2026-2032) | Drivers, Forecast, Investment Opportunities, Strategy, Insights, Demand, Challenges, Outlook, Trends, Competition, Value, Revenue, Size, Pricing, Analysis, Companies, Restraints, segmentation, Share, Growth
- Bahrain Electric Appliance Rental Market (2026-2032) | Outlook, Size, Competition, Restraints, Drivers, Value, Trends, Investment Opportunities, Insights, Forecast, Revenue, Strategy, Growth, Share, Demand, Analysis, Challenges, Companies, segmentation, Pricing
- Azerbaijan Electric Appliance Rental Market (2026-2032) | Trends, Investment Opportunities, Restraints, Insights, Strategy, Competition, Value, Growth, Demand, Drivers, Analysis, Forecast, Size, Share, Outlook, segmentation, Pricing, Challenges, Revenue, Companies
- Australia Electric Appliance Rental Market (2026-2032) | Challenges, Restraints, Forecast, Demand, Size, Competition, Pricing, Investment Opportunities, Revenue, Trends, Drivers, Growth, Outlook, Analysis, Strategy, Value, segmentation, Insights, Companies, Share
- Argentina Electric Appliance Rental Market (2026-2032) | Growth, Trends, Insights, Outlook, Forecast, Size, Drivers, Analysis, Restraints, Challenges, Share, Revenue, Investment Opportunities, Strategy, Demand, Value, Companies, segmentation, Competition, Pricing
- Algeria Electric Appliance Rental Market (2026-2032) | Share, Size, Value, Strategy, Competition, Outlook, Challenges, Companies, Trends, Pricing, Insights, Forecast, Investment Opportunities, Revenue, Growth, Restraints, segmentation, Analysis, Demand, Drivers
Industry Events and Analyst Meet

HIMTEX 2026

India Refining Summit 2026

India EV Show 2026

EV tech India Expo 2026

Auto Tech Asia 2026
Whitepaper
- Middle East & Africa Commercial Security Market Click here to view more.
- Middle East & Africa Fire Safety Systems & Equipment Market Click here to view more.
- GCC Drone Market Click here to view more.
- Middle East Lighting Fixture Market Click here to view more.
- GCC Physical & Perimeter Security Market Click here to view more.
6WResearch In News
- Doha a strategic location for EV manufacturing hub: IPA Qatar
- Demand for luxury TVs surging in the GCC, says Samsung
- Empowering Growth: The Thriving Journey of Bangladesh’s Cable Industry
- Demand for luxury TVs surging in the GCC, says Samsung
- Video call with a traditional healer? Once unthinkable, it’s now common in South Africa
- Intelligent Buildings To Smooth GCC’s Path To Net Zero