Croatia Pasta Market (2026-2032) | Segmentation, Trends, Forecast, Analysis, Value, Outlook, Revenue, Industry, Share, Size, Companies & Growth
Market Forecast By Raw Material (Barley, Durum Wheat Semolina, Wheat, Maize, Rice, Others), By Product Raw Materials (Canned/Preserved Pasta, Fresh/Chilled Pasta, Dried Pasta, Others), By Distribution Channel (Hypermarkets, Supermarkets, Independent Small Groceries, Discounters, E-commerce Stores, Others) And Competitive Landscape
| Product Code: ETC5084479 | Publication Date: Nov 2023 | Updated Date: Apr 2026 | Product Type: Market Research Report | |
| Publisher: 6Wresearch | Author: Shubham Padhi | No. of Pages: 60 | No. of Figures: 30 | No. of Tables: 5 |
Croatia Pasta Market Size (2020-2030)
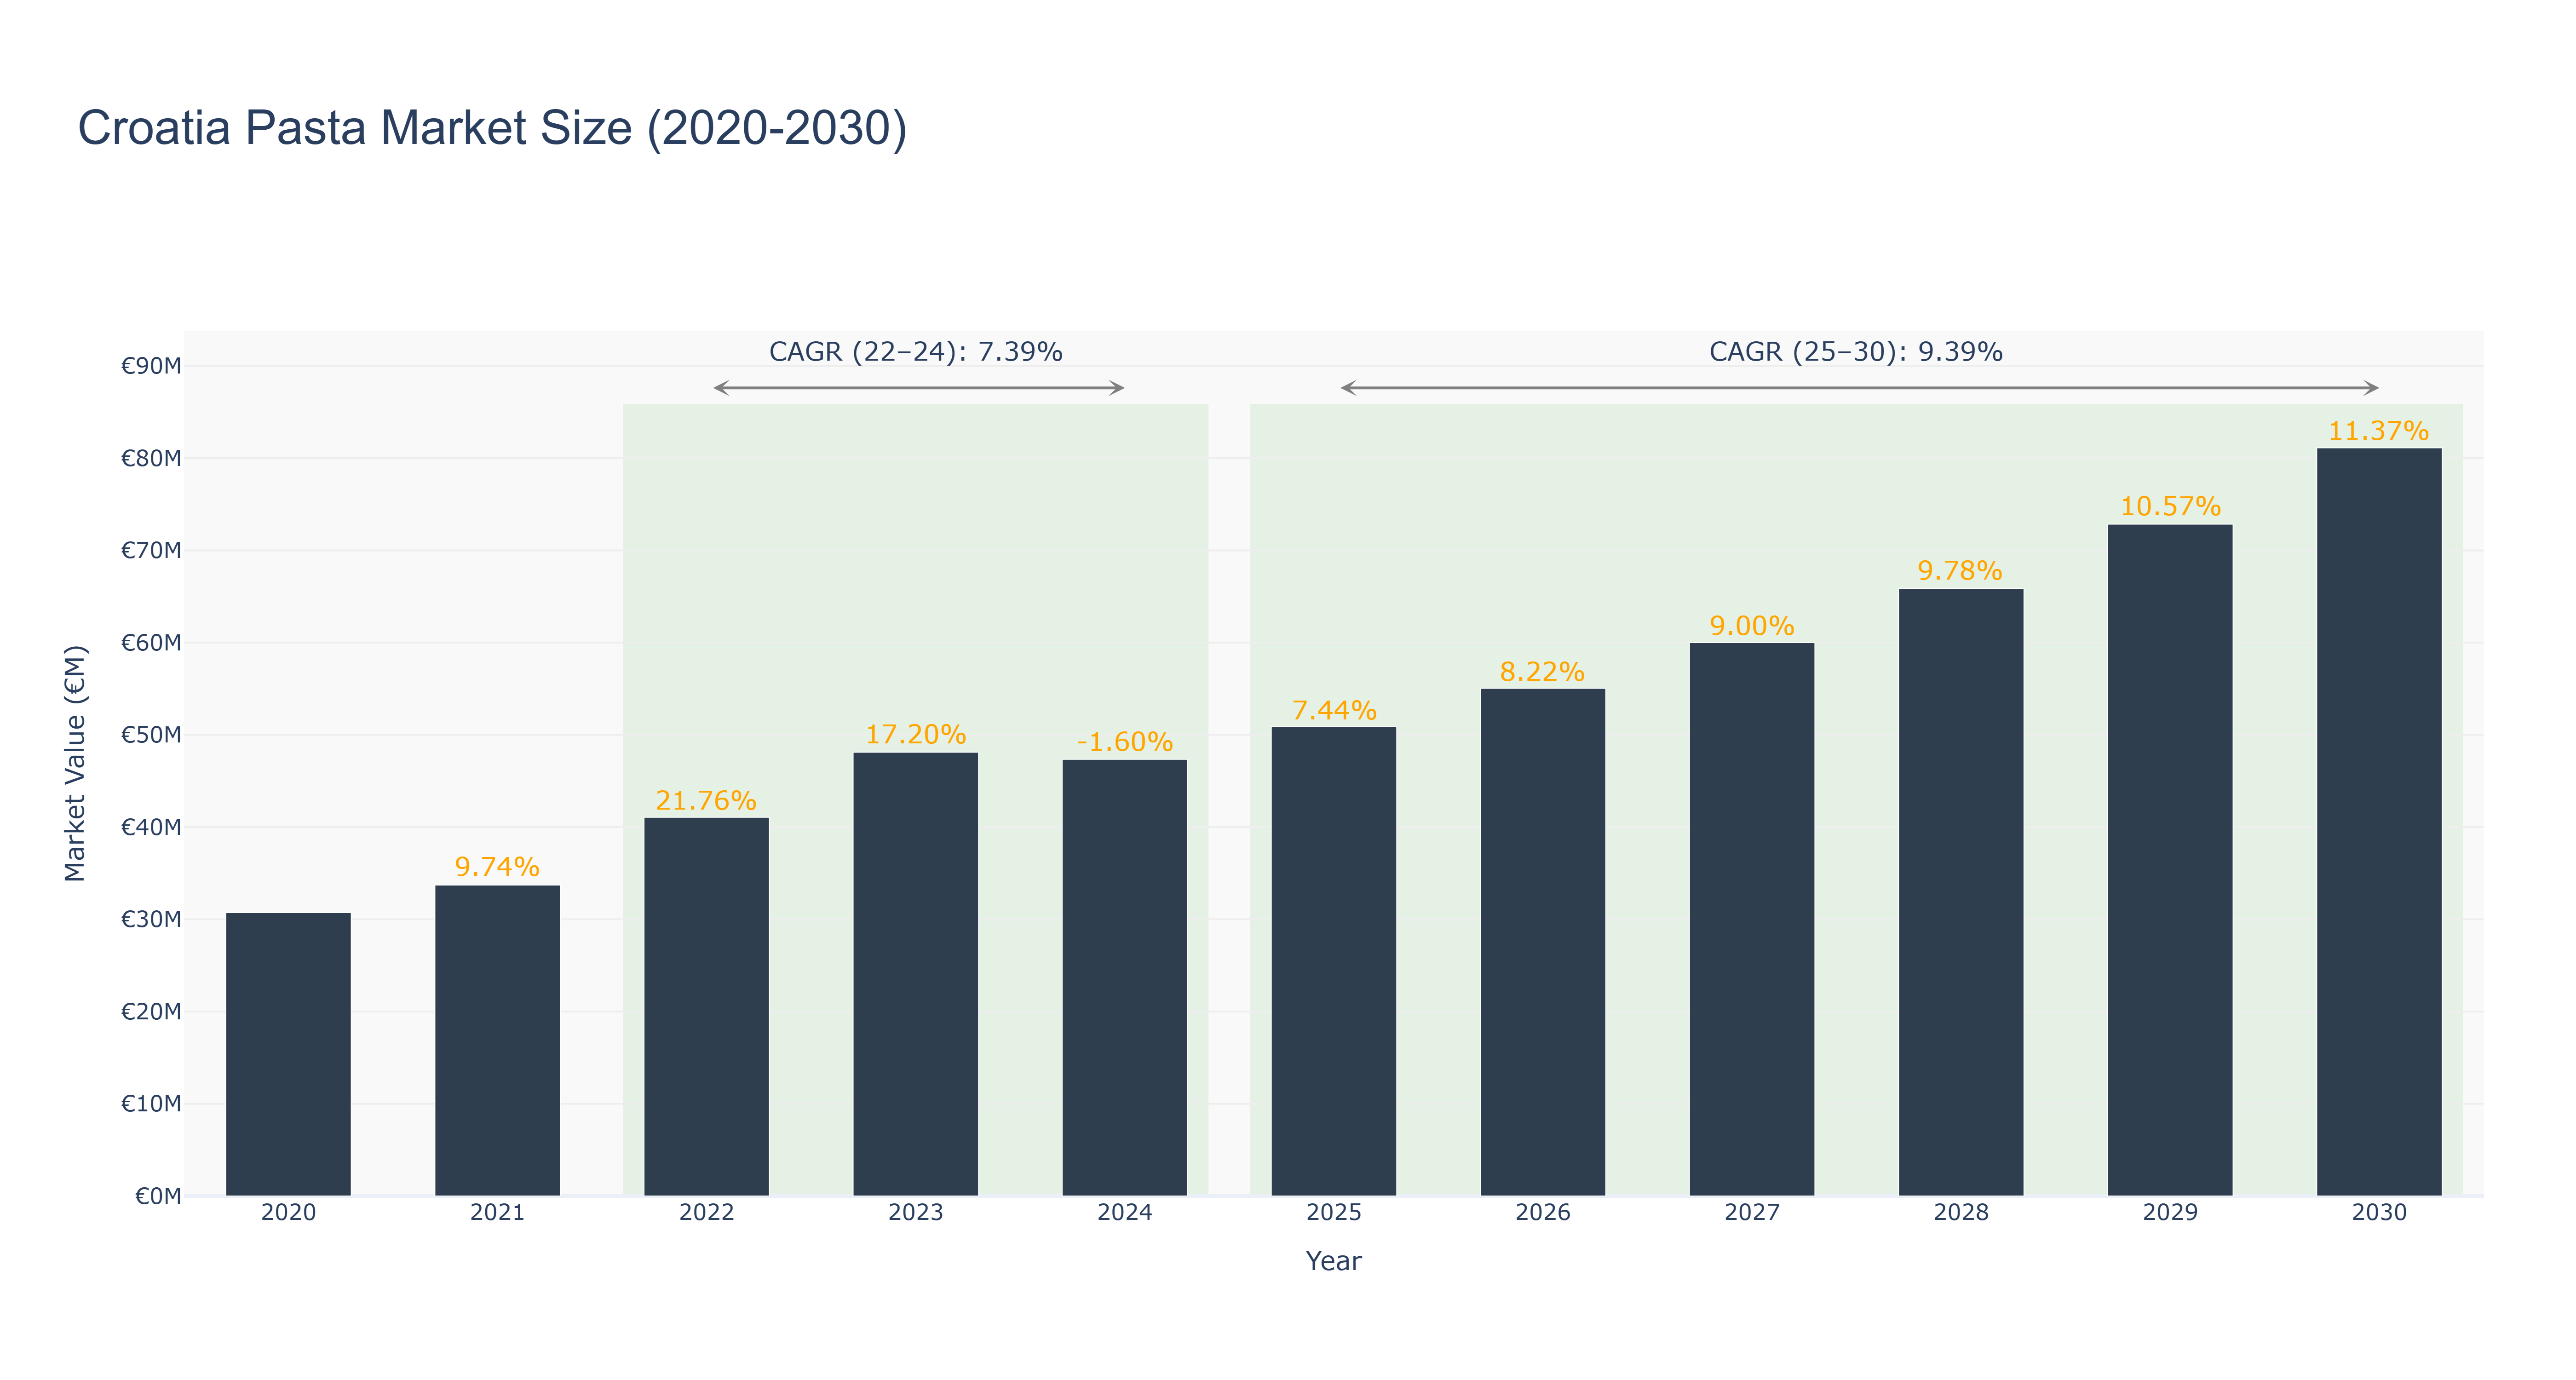
The Croatia Pasta Market demonstrated robust growth from 2022 to 2023, reaching a peak market size of €48.12 million in 2023, following a 21.76% increase in 2022 and a 17.20% growth in 2023. However, this trend saw a slight decline in 2024, with the market size projected at €47.35 million, reflecting a -1.60% growth due to changing consumer preferences and increasing competition. Looking ahead, the market is expected to recover and expand, with forecasted growth rates averaging 9.39% from 2025 to 2030, culminating in a projected market size of €81.12 million by 2030. Key drivers for this anticipated growth include rising health consciousness among consumers, diversification of pasta products, and innovations in gluten-free and organic offerings. As the market evolves, investment in new product lines and sustainable practices will be crucial for capturing consumer interest and maintaining growth momentum.
Croatia Pasta Market: Production & Trade Performance (2019-2025)
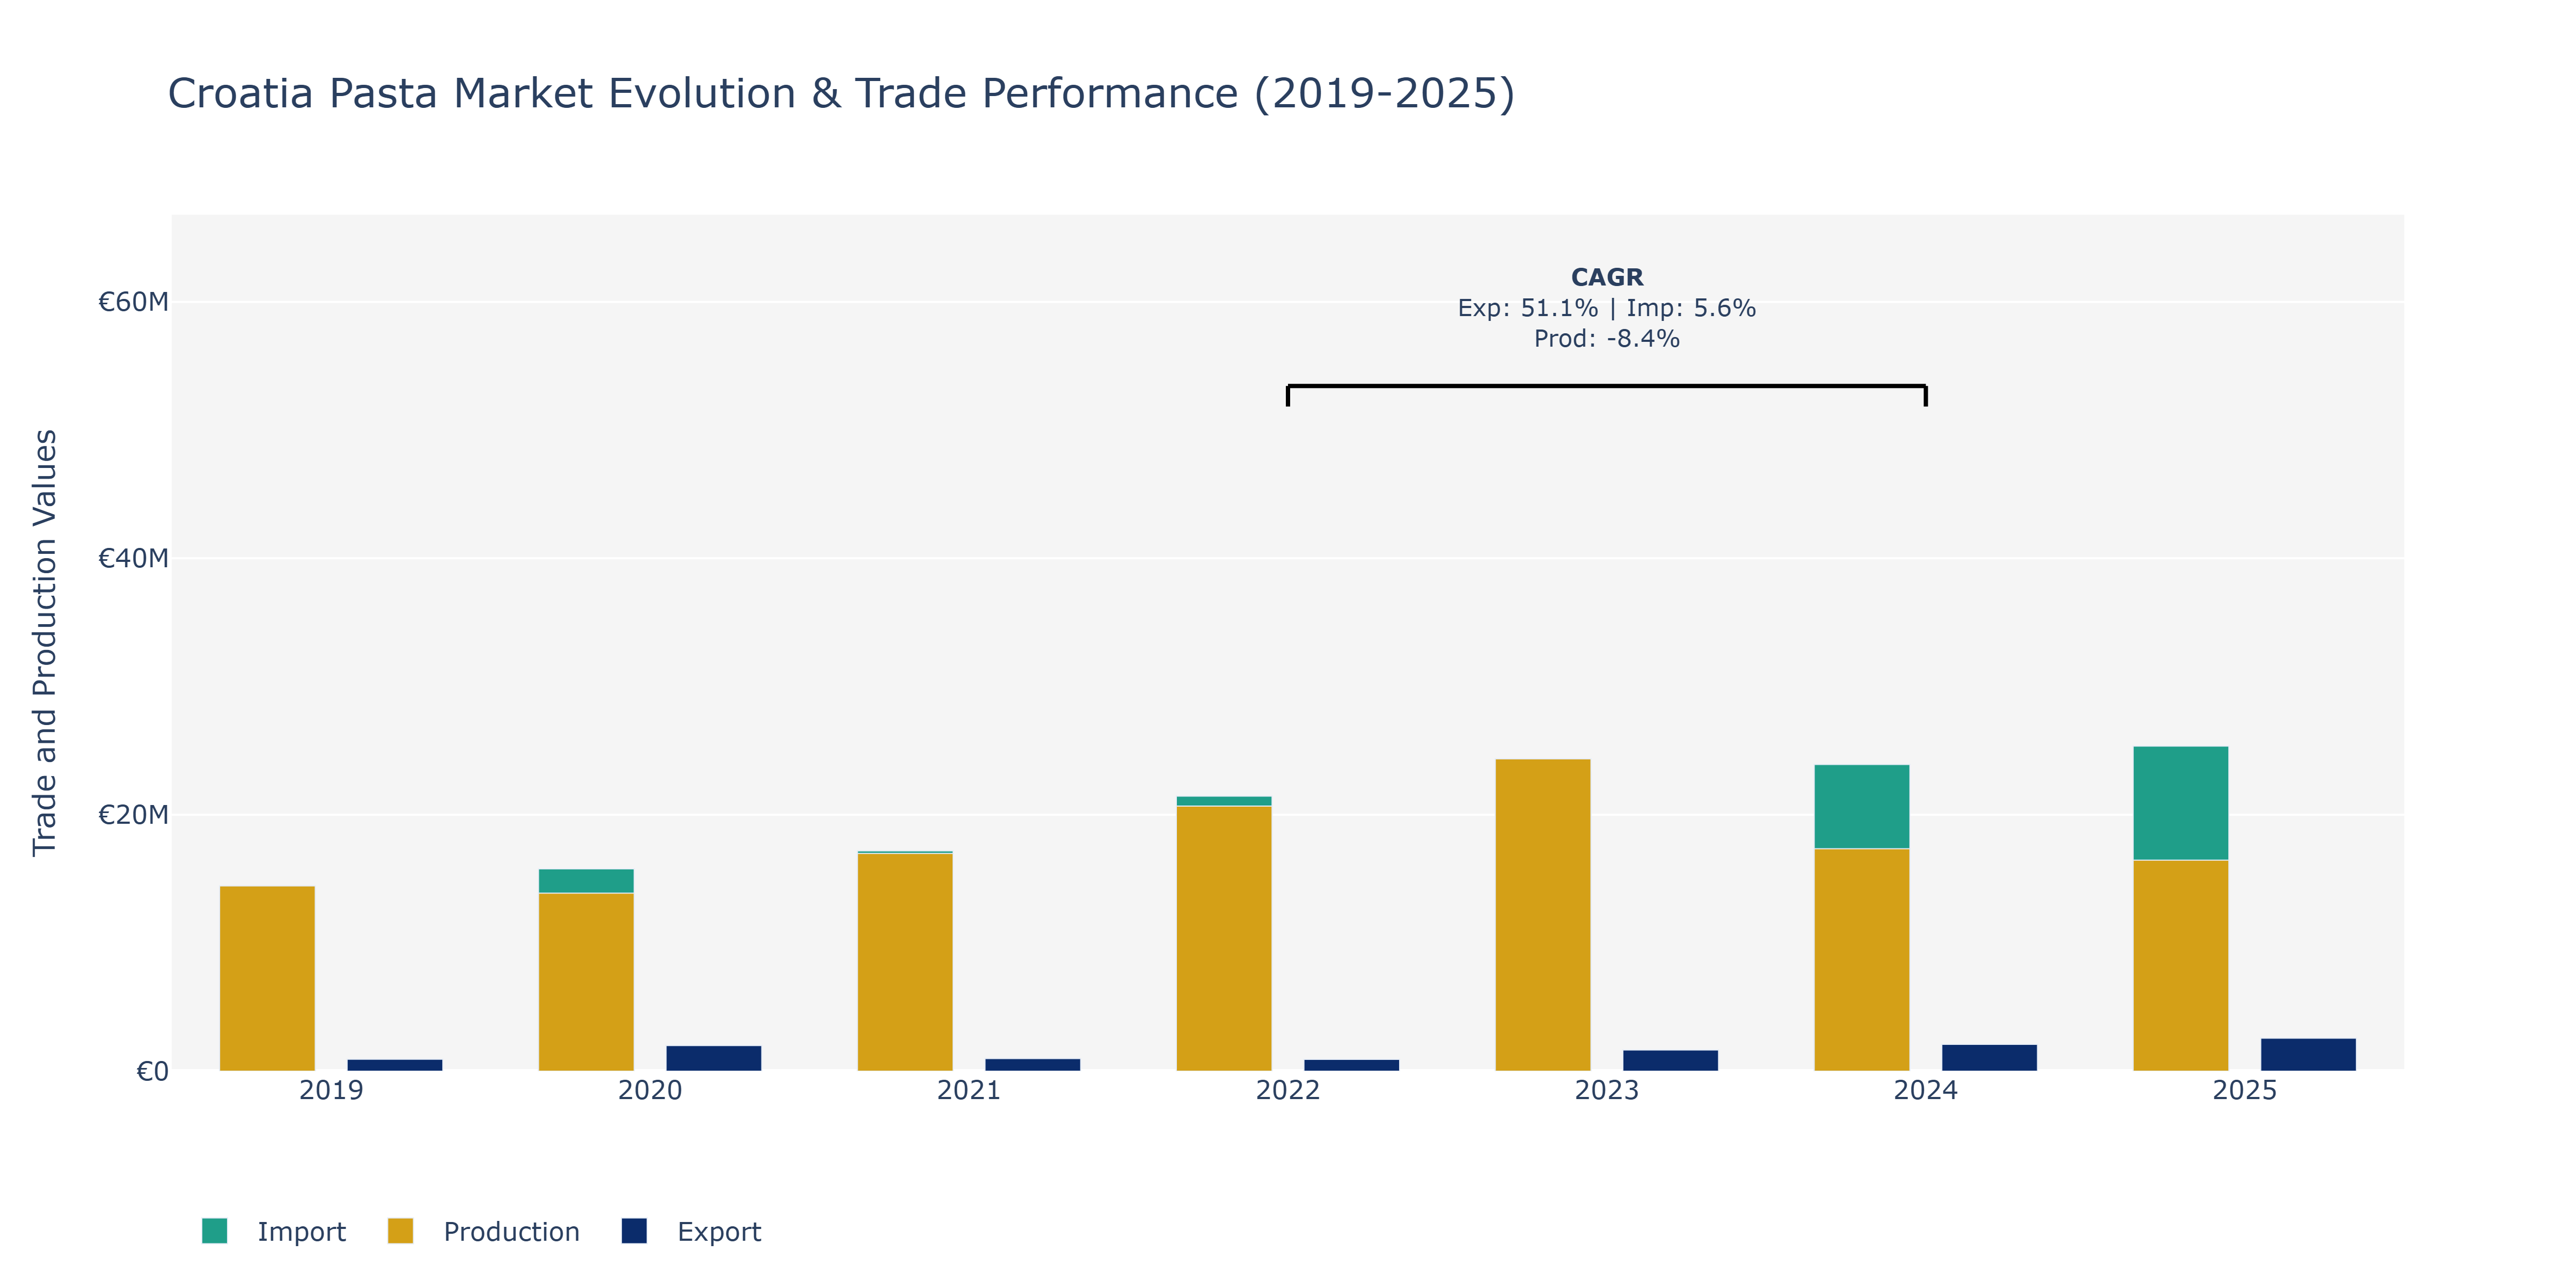
In the Croatia Pasta Market, from 2019 to 2025, exports showcased a fluctuating pattern with a peak in 2025 at approximately €2.58 million. Imports steadily increased each year, reaching around €25.36 million in 2025. Production experienced fluctuations, with a noticeable decline in 2024 to around €17.35 million before a slight recovery in 2025 to approximately €16.46 million. The increase in imports can be attributed to the growing demand for a variety of pasta products in Croatia. Fluctuations in production may be linked to factors such as changes in raw material costs, production technology advancements, and market demand shifts. The varying trends in exports could be influenced by international trade agreements, global economic conditions, and competitive market dynamics within the pasta industry. It is essential for stakeholders in the Croatia Pasta Market to closely monitor these trends and adapt their strategies accordingly to remain competitive in the evolving market landscape.
Key Highlights of the Report:
- Croatia Pasta Market Outlook
- Market Size of Croatia Pasta Market, 2025
- Forecast of Croatia Pasta Market, 2032
- Historical Data and Forecast of Croatia Pasta Revenues & Volume for the Period 2022 - 2032F
- Croatia Pasta Market Trend Evolution
- Croatia Pasta Market Drivers and Challenges
- Croatia Pasta Price Trends
- Croatia Pasta Porter`s Five Forces
- Croatia Pasta Industry Life Cycle
- Historical Data and Forecast of Croatia Pasta Market Revenues & Volume By Raw Material for the Period 2022 - 2032F
- Historical Data and Forecast of Croatia Pasta Market Revenues & Volume By Barley for the Period 2022 - 2032F
- Historical Data and Forecast of Croatia Pasta Market Revenues & Volume By Durum Wheat Semolina for the Period 2022 - 2032F
- Historical Data and Forecast of Croatia Pasta Market Revenues & Volume By Wheat for the Period 2022 - 2032F
- Historical Data and Forecast of Croatia Pasta Market Revenues & Volume By Maize for the Period 2022 - 2032F
- Historical Data and Forecast of Croatia Pasta Market Revenues & Volume By Rice for the Period 2022 - 2032F
- Historical Data and Forecast of Croatia Pasta Market Revenues & Volume By Others for the Period 2022 - 2032F
- Historical Data and Forecast of Croatia Pasta Market Revenues & Volume By Product Raw Materials for the Period 2022 - 2032F
- Historical Data and Forecast of Croatia Pasta Market Revenues & Volume By Canned/Preserved Pasta for the Period 2022 - 2032F
- Historical Data and Forecast of Croatia Pasta Market Revenues & Volume By Fresh/Chilled Pasta for the Period 2022 - 2032F
- Historical Data and Forecast of Croatia Pasta Market Revenues & Volume By Dried Pasta for the Period 2022 - 2032F
- Historical Data and Forecast of Croatia Pasta Market Revenues & Volume By Others for the Period 2022 - 2032F
- Historical Data and Forecast of Croatia Pasta Market Revenues & Volume By Distribution Channel for the Period 2022 - 2032F
- Historical Data and Forecast of Croatia Pasta Market Revenues & Volume By Hypermarkets for the Period 2022 - 2032F
- Historical Data and Forecast of Croatia Pasta Market Revenues & Volume By Supermarkets for the Period 2022 - 2032F
- Historical Data and Forecast of Croatia Pasta Market Revenues & Volume By Independent Small Groceries for the Period 2022 - 2032F
- Historical Data and Forecast of Croatia Pasta Market Revenues & Volume By Discounters for the Period 2022 - 2032F
- Historical Data and Forecast of Croatia Pasta Market Revenues & Volume By E-commerce Stores for the Period 2022 - 2032F
- Historical Data and Forecast of Croatia Pasta Market Revenues & Volume By Others for the Period 2022 - 2032F
- Croatia Pasta Import Export Trade Statistics
- Market Opportunity Assessment By Raw Material
- Market Opportunity Assessment By Product Raw Materials
- Market Opportunity Assessment By Distribution Channel
- Croatia Pasta Top Companies Market Share
- Croatia Pasta Competitive Benchmarking By Technical and Operational Parameters
- Croatia Pasta Company Profiles
- Croatia Pasta Key Strategic Recommendations
Frequently Asked Questions About the Market Study (FAQs):
6Wresearch actively monitors the Croatia Pasta Market and publishes its comprehensive annual report, highlighting emerging trends, growth drivers, revenue analysis, and forecast outlook. Our insights help businesses to make data-backed strategic decisions with ongoing market dynamics. Our analysts track relevent industries related to the Croatia Pasta Market, allowing our clients with actionable intelligence and reliable forecasts tailored to emerging regional needs.
Yes, we provide customisation as per your requirements. To learn more, feel free to contact us on sales@6wresearch.com
1 Executive Summary |
2 Introduction |
2.1 Key Highlights of the Report |
2.2 Report Description |
2.3 Market Scope & Segmentation |
2.4 Research Methodology |
2.5 Assumptions |
3 Croatia Pasta Market Overview |
3.1 Croatia Country Macro Economic Indicators |
3.2 Croatia Pasta Market Revenues & Volume, 2022 & 2032F |
3.3 Croatia Pasta Market - Industry Life Cycle |
3.4 Croatia Pasta Market - Porter's Five Forces |
3.5 Croatia Pasta Market Revenues & Volume Share, By Raw Material, 2022 & 2032F |
3.6 Croatia Pasta Market Revenues & Volume Share, By Product Raw Materials, 2022 & 2032F |
3.7 Croatia Pasta Market Revenues & Volume Share, By Distribution Channel, 2022 & 2032F |
4 Croatia Pasta Market Dynamics |
4.1 Impact Analysis |
4.2 Market Drivers |
4.2.1 Increasing consumer awareness and preference for healthy and convenient food options, leading to a growing demand for pasta as a versatile and easy-to-prepare meal. |
4.2.2 Rising disposable incomes and changing lifestyles, resulting in higher consumption of convenience foods like pasta. |
4.2.3 Growing tourism industry in Croatia, attracting more visitors who may contribute to the demand for pasta products. |
4.3 Market Restraints |
4.3.1 Price fluctuations in raw materials like wheat, which can impact the production costs of pasta manufacturers. |
4.3.2 Competition from other convenient food options like ready-to-eat meals, which may affect the market share of pasta products. |
4.3.3 Health concerns related to high carb and gluten content in pasta, leading to a shift towards low-carb or gluten-free alternatives. |
5 Croatia Pasta Market Trends |
6 Croatia Pasta Market Segmentations |
6.1 Croatia Pasta Market, By Raw Material |
6.1.1 Overview and Analysis |
6.1.2 Croatia Pasta Market Revenues & Volume, By Barley, 2022 - 2032F |
6.1.3 Croatia Pasta Market Revenues & Volume, By Durum Wheat Semolina, 2022 - 2032F |
6.1.4 Croatia Pasta Market Revenues & Volume, By Wheat, 2022 - 2032F |
6.1.5 Croatia Pasta Market Revenues & Volume, By Maize, 2022 - 2032F |
6.1.6 Croatia Pasta Market Revenues & Volume, By Rice, 2022 - 2032F |
6.1.7 Croatia Pasta Market Revenues & Volume, By Others, 2022 - 2032F |
6.2 Croatia Pasta Market, By Product Raw Materials |
6.2.1 Overview and Analysis |
6.2.2 Croatia Pasta Market Revenues & Volume, By Canned/Preserved Pasta, 2022 - 2032F |
6.2.3 Croatia Pasta Market Revenues & Volume, By Fresh/Chilled Pasta, 2022 - 2032F |
6.2.4 Croatia Pasta Market Revenues & Volume, By Dried Pasta, 2022 - 2032F |
6.2.5 Croatia Pasta Market Revenues & Volume, By Others, 2022 - 2032F |
6.3 Croatia Pasta Market, By Distribution Channel |
6.3.1 Overview and Analysis |
6.3.2 Croatia Pasta Market Revenues & Volume, By Hypermarkets, 2022 - 2032F |
6.3.3 Croatia Pasta Market Revenues & Volume, By Supermarkets, 2022 - 2032F |
6.3.4 Croatia Pasta Market Revenues & Volume, By Independent Small Groceries, 2022 - 2032F |
6.3.5 Croatia Pasta Market Revenues & Volume, By Discounters, 2022 - 2032F |
6.3.6 Croatia Pasta Market Revenues & Volume, By E-commerce Stores, 2022 - 2032F |
6.3.7 Croatia Pasta Market Revenues & Volume, By Others, 2022 - 2032F |
7 Croatia Pasta Market Import-Export Trade Statistics |
7.1 Croatia Pasta Market Export to Major Countries |
7.2 Croatia Pasta Market Imports from Major Countries |
8 Croatia Pasta Market Key Performance Indicators |
8.1 Consumer engagement on social media platforms, indicating the level of interest and awareness about pasta products in Croatia. |
8.2 Number of new product launches and innovations in the pasta market, reflecting the industry's response to changing consumer preferences. |
8.3 Percentage of households in Croatia regularly purchasing pasta products, showing the market penetration and potential for growth. |
9 Croatia Pasta Market - Opportunity Assessment |
9.1 Croatia Pasta Market Opportunity Assessment, By Raw Material, 2022 & 2032F |
9.2 Croatia Pasta Market Opportunity Assessment, By Product Raw Materials, 2022 & 2032F |
9.3 Croatia Pasta Market Opportunity Assessment, By Distribution Channel, 2022 & 2032F |
10 Croatia Pasta Market - Competitive Landscape |
10.1 Croatia Pasta Market Revenue Share, By Companies, 2025 |
10.2 Croatia Pasta Market Competitive Benchmarking, By Operating and Technical Parameters |
11 Company Profiles |
12 Recommendations | 13 Disclaimer |
Global Go To Market Strategy - 2030
Export potential enables firms to identify high-growth global markets with greater confidence by combining advanced trade intelligence with a structured quantitative methodology. The framework analyzes emerging demand trends and country-level import patterns while integrating macroeconomic and trade datasets such as GDP and population forecasts, bilateral import–export flows, tariff structures, elasticity differentials between developed and developing economies, geographic distance, and import demand projections. Using weighted trade values from 2020–2024 as the base period to project country-to-country export potential for 2030, these inputs are operationalized through calculated drivers such as gravity model parameters, tariff impact factors, and projected GDP per-capita growth. Through an analysis of hidden potentials, demand hotspots, and market conditions that are most favorable to success, this method enables firms to focus on target countries, maximize returns, and global expansion with data, backed by accuracy.
By factoring in the projected importer demand gap that is currently unmet and could be potential opportunity, it identifies the potential for the Exporter (Country) among 190 countries, against the general trade analysis, which identifies the biggest importer or exporter.
To discover high-growth global markets and optimize your business strategy:
Click Here
Pricing
- Single User License$ 1,995
- Department License$ 2,400
- Site License$ 3,120
- Global License$ 3,795

Leadership Perspectives from Industry Events
Search
Thought Leadership and Analyst Meet


Our Clients
6WResearch In News
- Doha a strategic location for EV manufacturing hub: IPA Qatar
- Demand for luxury TVs surging in the GCC, says Samsung
- Empowering Growth: The Thriving Journey of Bangladesh’s Cable Industry
- Demand for luxury TVs surging in the GCC, says Samsung
- Video call with a traditional healer? Once unthinkable, it’s now common in South Africa
- Intelligent Buildings To Smooth GCC’s Path To Net Zero
Latest Reports
- Taiwan Airport Wireless Infrastructure Market (2026-2032)
- Vietnam Airport Wireless Infrastructure Market (2026-2032)
- Thailand Airport Wireless Infrastructure Market (2026-2032)
- South Korea Airport Wireless Infrastructure Market (2026-2032)
- Romania Airport Wireless Infrastructure Market (2026-2032)
- Qatar Airport Wireless Infrastructure Market (2026-2032)
- Philippines Airport Wireless Infrastructure Market (2026-2032)
- Japan Airport Wireless Infrastructure Market (2026-2032)
- Taiwan Airport Winter Services Market (2026-2032)
- Vietnam Airport Winter Services Market (2026-2032)
Industry Events and Analyst Meet

HIMTEX 2026

India Refining Summit 2026

India EV Show 2026

EV tech India Expo 2026

Auto Tech Asia 2026
Whitepaper
- Middle East & Africa Commercial Security Market Click here to view more.
- Middle East & Africa Fire Safety Systems & Equipment Market Click here to view more.
- GCC Drone Market Click here to view more.
- Middle East Lighting Fixture Market Click here to view more.
- GCC Physical & Perimeter Security Market Click here to view more.