Croatia Rosin Market (2026-2032) | Analysis, Segmentation, Industry, Share, Size, Revenue, Forecast, Companies, Value, Outlook, Growth & Trends
Market Forecast By Rosin Type (Gum, Wood, Tall Oil), By Application (Adhesives, Paints and Varnishes, Rubbers, Paper Sizing and Fillers, Printing Inks, Other Applications) And Competitive Landscape
| Product Code: ETC4735221 | Publication Date: Nov 2023 | Updated Date: Apr 2026 | Product Type: Market Research Report | |
| Publisher: 6Wresearch | Author: Shubham Padhi | No. of Pages: 60 | No. of Figures: 30 | No. of Tables: 5 |
Croatia Rosin Market Size (2020-2030)
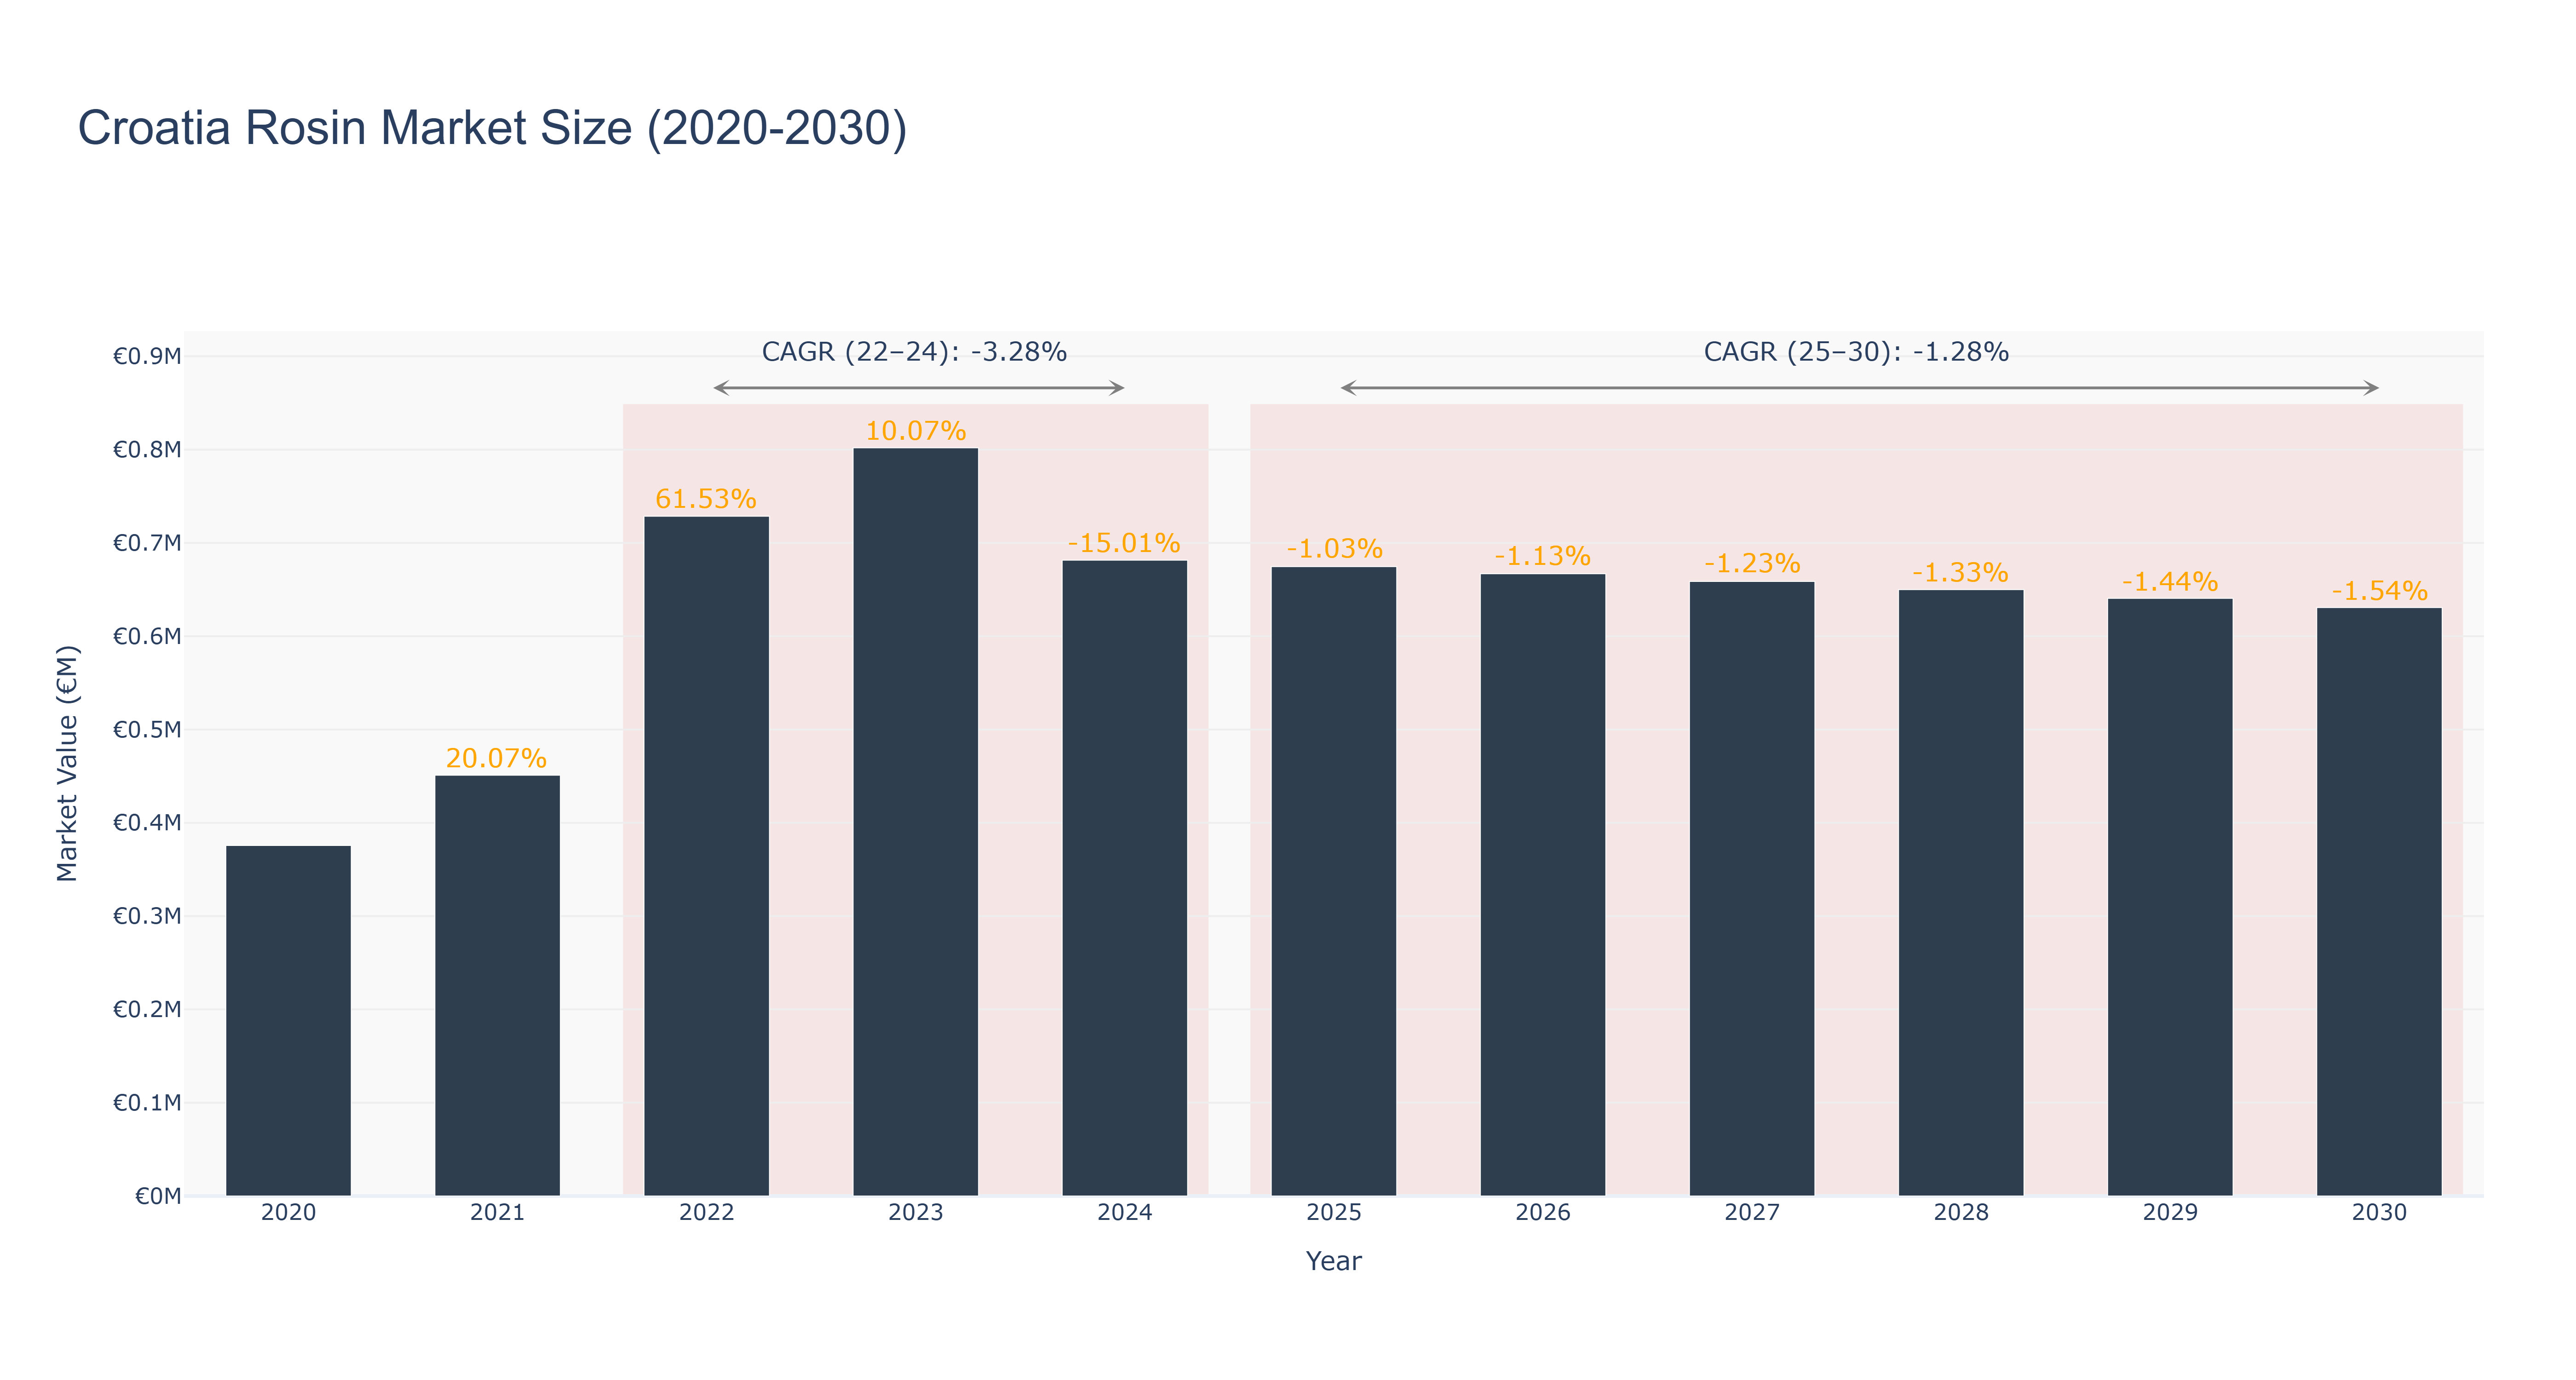
Croatia's Rosin Market experienced a peak market size of €0.8 million in 2023. From 2020 to 2024, the actual market size fluctuated, starting at €0.38 million in 2020, reaching a peak in 2023, and then declining to €0.68 million in 2024. Forecasted market size from 2025 to 2030 shows a gradual decrease, with the market expected to reach €0.63 million in 2030. The CAGR values reflect a negative trend, with a decline of -3.28% from 2022 to 2024 and -1.28% from 2025 to 2030. The market downturn can be attributed to various factors such as changing consumer preferences, economic instability, and increased competition. However, recent developments in sustainable production methods and innovative marketing strategies offer potential opportunities for market recovery in the future. Additionally, upcoming government initiatives to promote local industries could further stimulate growth in Croatia's Rosin Market.
Croatia Rosin Market: Production & Trade Performance (2019-2025)
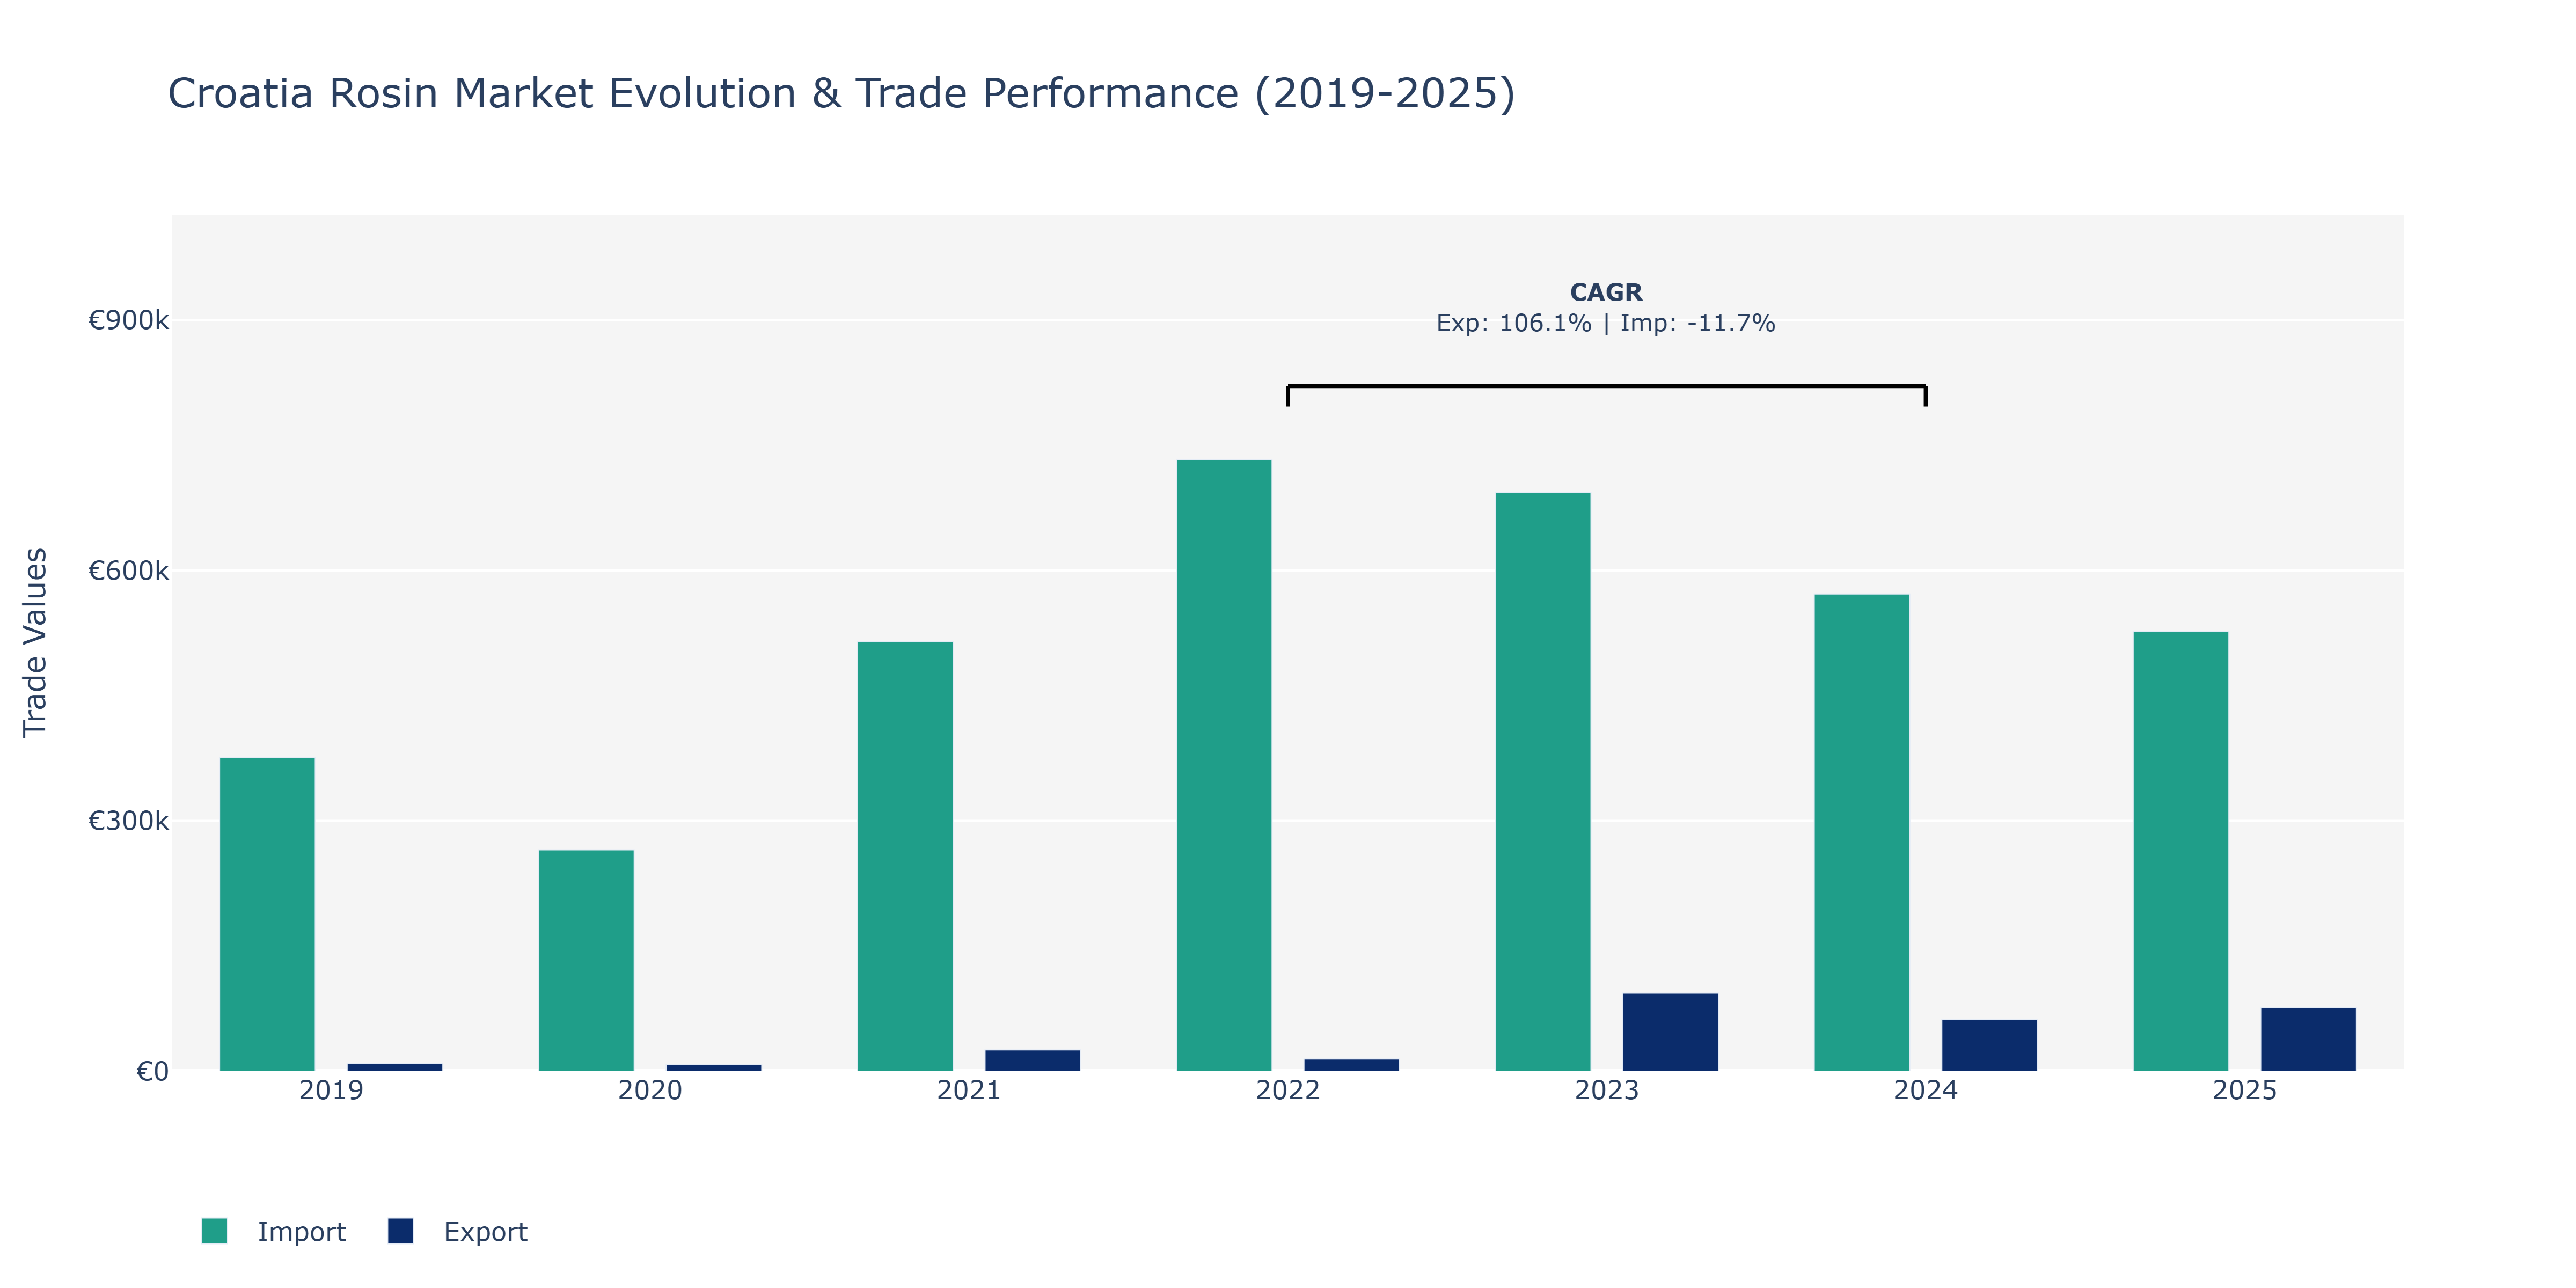
Between 2019 and 2025, Croatia's Rosin Market experienced notable fluctuations in its exports and imports. In 2019, exports were valued at €9.63 thousand and imports at €375.85 thousand. A sharp decline in 2020 saw exports decrease to €8.3 thousand and imports to €265.21 thousand, likely due to global economic uncertainties. The market rebounded strongly in 2021, with exports soaring to €25.54 thousand and imports to €514.74 thousand, possibly driven by increased demand for rosin products. However, in 2022, exports dropped to €14.58 thousand while imports increased to €733.01 thousand, reflecting changing market dynamics. The peak in exports in 2023 at €93.61 thousand may have been influenced by strategic market positioning. By 2025, exports slightly decreased to €76.34 thousand, while imports remained stable at €527.04 thousand. The CAGR of exports at 106.06% during 2022-2024 indicates a rapid growth trajectory, contrasting with the -11.68% CAGR for imports during the same period, potentially due to shifting trade patterns or domestic production capabilities. The market's resilience amid economic challenges underscores Croatia's position as a key player in the global rosin market, with opportunities for further growth through strategic partnerships and product diversification.
Key Highlights of the Report:
- Croatia Rosin Market Outlook
- Market Size of Croatia Rosin Market, 2025
- Forecast of Croatia Rosin Market, 2032
- Historical Data and Forecast of Croatia Rosin Revenues & Volume for the Period 2022 - 2032F
- Croatia Rosin Market Trend Evolution
- Croatia Rosin Market Drivers and Challenges
- Croatia Rosin Price Trends
- Croatia Rosin Porter`s Five Forces
- Croatia Rosin Industry Life Cycle
- Historical Data and Forecast of Croatia Rosin Market Revenues & Volume By Rosin Type for the Period 2022 - 2032F
- Historical Data and Forecast of Croatia Rosin Market Revenues & Volume By Gum for the Period 2022 - 2032F
- Historical Data and Forecast of Croatia Rosin Market Revenues & Volume By Wood for the Period 2022 - 2032F
- Historical Data and Forecast of Croatia Rosin Market Revenues & Volume By Tall Oil for the Period 2022 - 2032F
- Historical Data and Forecast of Croatia Rosin Market Revenues & Volume By Application for the Period 2022 - 2032F
- Historical Data and Forecast of Croatia Rosin Market Revenues & Volume By Adhesives for the Period 2022 - 2032F
- Historical Data and Forecast of Croatia Rosin Market Revenues & Volume By Paints and Varnishes for the Period 2022 - 2032F
- Historical Data and Forecast of Croatia Rosin Market Revenues & Volume By Rubbers for the Period 2022 - 2032F
- Historical Data and Forecast of Croatia Rosin Market Revenues & Volume By Paper Sizing and Fillers for the Period 2022 - 2032F
- Historical Data and Forecast of Croatia Rosin Market Revenues & Volume By Printing Inks for the Period 2022 - 2032F
- Historical Data and Forecast of Croatia Rosin Market Revenues & Volume By Other Applications for the Period 2022 - 2032F
- Croatia Rosin Import Export Trade Statistics
- Market Opportunity Assessment By Rosin Type
- Market Opportunity Assessment By Application
- Croatia Rosin Top Companies Market Share
- Croatia Rosin Competitive Benchmarking By Technical and Operational Parameters
- Croatia Rosin Company Profiles
- Croatia Rosin Key Strategic Recommendations
Frequently Asked Questions About the Market Study (FAQs):
6Wresearch actively monitors the Croatia Rosin Market and publishes its comprehensive annual report, highlighting emerging trends, growth drivers, revenue analysis, and forecast outlook. Our insights help businesses to make data-backed strategic decisions with ongoing market dynamics. Our analysts track relevent industries related to the Croatia Rosin Market, allowing our clients with actionable intelligence and reliable forecasts tailored to emerging regional needs.
Yes, we provide customisation as per your requirements. To learn more, feel free to contact us on sales@6wresearch.com
1 Executive Summary |
2 Introduction |
2.1 Key Highlights of the Report |
2.2 Report Description |
2.3 Market Scope & Segmentation |
2.4 Research Methodology |
2.5 Assumptions |
3 Croatia Rosin Market Overview |
3.1 Croatia Country Macro Economic Indicators |
3.2 Croatia Rosin Market Revenues & Volume, 2022 & 2032F |
3.3 Croatia Rosin Market - Industry Life Cycle |
3.4 Croatia Rosin Market - Porter's Five Forces |
3.5 Croatia Rosin Market Revenues & Volume Share, By Rosin Type, 2022 & 2032F |
3.6 Croatia Rosin Market Revenues & Volume Share, By Application, 2022 & 2032F |
4 Croatia Rosin Market Dynamics |
4.1 Impact Analysis |
4.2 Market Drivers |
4.2.1 Increasing demand for eco-friendly and sustainable products |
4.2.2 Growth in the pharmaceutical and cosmetic industries |
4.2.3 Rising awareness about the benefits of rosin in various applications |
4.3 Market Restraints |
4.3.1 Fluctuating prices of raw materials |
4.3.2 Competition from substitute products like synthetic resins |
4.3.3 Regulatory challenges related to environmental concerns |
5 Croatia Rosin Market Trends |
6 Croatia Rosin Market Segmentations |
6.1 Croatia Rosin Market, By Rosin Type |
6.1.1 Overview and Analysis |
6.1.2 Croatia Rosin Market Revenues & Volume, By Gum, 2022 - 2032F |
6.1.3 Croatia Rosin Market Revenues & Volume, By Wood, 2022 - 2032F |
6.1.4 Croatia Rosin Market Revenues & Volume, By Tall Oil, 2022 - 2032F |
6.2 Croatia Rosin Market, By Application |
6.2.1 Overview and Analysis |
6.2.2 Croatia Rosin Market Revenues & Volume, By Adhesives, 2022 - 2032F |
6.2.3 Croatia Rosin Market Revenues & Volume, By Paints and Varnishes, 2022 - 2032F |
6.2.4 Croatia Rosin Market Revenues & Volume, By Rubbers, 2022 - 2032F |
6.2.5 Croatia Rosin Market Revenues & Volume, By Paper Sizing and Fillers, 2022 - 2032F |
6.2.6 Croatia Rosin Market Revenues & Volume, By Printing Inks, 2022 - 2032F |
6.2.7 Croatia Rosin Market Revenues & Volume, By Other Applications, 2022 - 2032F |
7 Croatia Rosin Market Import-Export Trade Statistics |
7.1 Croatia Rosin Market Export to Major Countries |
7.2 Croatia Rosin Market Imports from Major Countries |
8 Croatia Rosin Market Key Performance Indicators |
8.1 Percentage increase in the adoption of rosin-based products in different industries |
8.2 Research and development investment in new rosin-based product formulations |
8.3 Number of partnerships and collaborations for expanding market presence |
8.4 Sustainability initiatives implemented in the rosin production process |
8.5 Customer satisfaction and loyalty metrics related to rosin products |
9 Croatia Rosin Market - Opportunity Assessment |
9.1 Croatia Rosin Market Opportunity Assessment, By Rosin Type, 2022 & 2032F |
9.2 Croatia Rosin Market Opportunity Assessment, By Application, 2022 & 2032F |
10 Croatia Rosin Market - Competitive Landscape |
10.1 Croatia Rosin Market Revenue Share, By Companies, 2025 |
10.2 Croatia Rosin Market Competitive Benchmarking, By Operating and Technical Parameters |
11 Company Profiles |
12 Recommendations | 13 Disclaimer |
Export potential assessment - trade Analytics for 2030
Export potential enables firms to identify high-growth global markets with greater confidence by combining advanced trade intelligence with a structured quantitative methodology. The framework analyzes emerging demand trends and country-level import patterns while integrating macroeconomic and trade datasets such as GDP and population forecasts, bilateral import–export flows, tariff structures, elasticity differentials between developed and developing economies, geographic distance, and import demand projections. Using weighted trade values from 2020–2024 as the base period to project country-to-country export potential for 2030, these inputs are operationalized through calculated drivers such as gravity model parameters, tariff impact factors, and projected GDP per-capita growth. Through an analysis of hidden potentials, demand hotspots, and market conditions that are most favorable to success, this method enables firms to focus on target countries, maximize returns, and global expansion with data, backed by accuracy.
By factoring in the projected importer demand gap that is currently unmet and could be potential opportunity, it identifies the potential for the Exporter (Country) among 190 countries, against the general trade analysis, which identifies the biggest importer or exporter.
To discover high-growth global markets and optimize your business strategy:
Click Here
Pricing
- Single User License$ 1,995
- Department License$ 2,400
- Site License$ 3,120
- Global License$ 3,795

Search
Thought Leadership and Analyst Meet


Our Clients
Latest Reports
- France Thermally Conductive Filler Dispersants Market (2026-2032) | Challenges, Restraints, Value, Share, Size, segmentation, Analysis, Trends, Investment Opportunities, Outlook, Pricing, Demand, Forecast, Revenue, Companies, Growth, Drivers, Strategy, Insights, Competition
- Egypt Thermally Conductive Filler Dispersants Market (2026-2032) | Competition, Forecast, Strategy, Value, Insights, Outlook, Investment Opportunities, Pricing, Demand, Share, segmentation, Drivers, Size, Companies, Restraints, Growth, Trends, Revenue, Challenges, Analysis
- Czech Republic Thermally Conductive Filler Dispersants Market (2026-2032) | Forecast, Pricing, Analysis, Drivers, Insights, Size, Demand, Growth, Challenges, segmentation, Competition, Outlook, Trends, Investment Opportunities, Companies, Strategy, Revenue, Share, Value, Restraints
- Colombia Thermally Conductive Filler Dispersants Market (2026-2032) | segmentation, Trends, Share, Drivers, Strategy, Companies, Demand, Insights, Size, Challenges, Value, Competition, Analysis, Growth, Revenue, Restraints, Forecast, Pricing, Outlook, Investment Opportunities
- China Thermally Conductive Filler Dispersants Market (2026-2032) | Restraints, Investment Opportunities, Pricing, Companies, Share, Size, Challenges, Trends, Outlook, Value, Analysis, Competition, Revenue, Drivers, Forecast, Demand, Insights, Growth, Strategy, segmentation
- Chile Thermally Conductive Filler Dispersants Market (2026-2032) | Investment Opportunities, Trends, Value, Restraints, Share, Companies, Forecast, segmentation, Pricing, Challenges, Demand, Size, Analysis, Drivers, Outlook, Growth, Competition, Strategy, Revenue, Insights
- Cambodia Thermally Conductive Filler Dispersants Market (2026-2032) | Analysis, Share, Outlook, Strategy, Pricing, Demand, Size, Growth, segmentation, Insights, Revenue, Forecast, Challenges, Competition, Companies, Investment Opportunities, Trends, Restraints, Value, Drivers
- Brazil Thermally Conductive Filler Dispersants Market (2026-2032) | Restraints, Forecast, Competition, Size, Revenue, Value, Investment Opportunities, Trends, Insights, Outlook, Growth, Analysis, Drivers, segmentation, Pricing, Challenges, Strategy, Share, Companies, Demand
- Bangladesh Thermally Conductive Filler Dispersants Market (2026-2032) | Restraints, Trends, Analysis, Competition, Insights, Forecast, Value, Investment Opportunities, Pricing, Share, Demand, Outlook, Revenue, segmentation, Companies, Drivers, Growth, Size, Challenges, Strategy
- Bahrain Thermally Conductive Filler Dispersants Market (2026-2032) | Trends, Outlook, Pricing, Demand, Value, Competition, Forecast, Growth, segmentation, Revenue, Companies, Analysis, Insights, Size, Drivers, Challenges, Strategy, Investment Opportunities, Share, Restraints
Industry Events and Analyst Meet

HIMTEX 2026

India Refining Summit 2026

India EV Show 2026

EV tech India Expo 2026

Auto Tech Asia 2026
Whitepaper
- Middle East & Africa Commercial Security Market Click here to view more.
- Middle East & Africa Fire Safety Systems & Equipment Market Click here to view more.
- GCC Drone Market Click here to view more.
- Middle East Lighting Fixture Market Click here to view more.
- GCC Physical & Perimeter Security Market Click here to view more.
6WResearch In News
- Doha a strategic location for EV manufacturing hub: IPA Qatar
- Demand for luxury TVs surging in the GCC, says Samsung
- Empowering Growth: The Thriving Journey of Bangladesh’s Cable Industry
- Demand for luxury TVs surging in the GCC, says Samsung
- Video call with a traditional healer? Once unthinkable, it’s now common in South Africa
- Intelligent Buildings To Smooth GCC’s Path To Net Zero