Croatia Silver Market (2026-2032) | Segmentation, Trends, Value, Analysis, Share, Size, Forecast, Revenue, Companies, Industry, Outlook & Growth
Market Forecast By Type (Sterling Silver, German Silver, Coin Silver, Britannia Silver, Mexican Silver, Russian Silver, Oxidized Silver, Others), By Application (Silverware, Industrial, Jewelry, Investment, Photographic , Films, Electrical And Electronics, Pharmaceuticals) And Competitive Landscape
| Product Code: ETC5214287 | Publication Date: Nov 2023 | Updated Date: Apr 2026 | Product Type: Market Research Report | |
| Publisher: 6Wresearch | Author: Shubham Padhi | No. of Pages: 60 | No. of Figures: 30 | No. of Tables: 5 |
Croatia Silver Market Size (2020-2030)
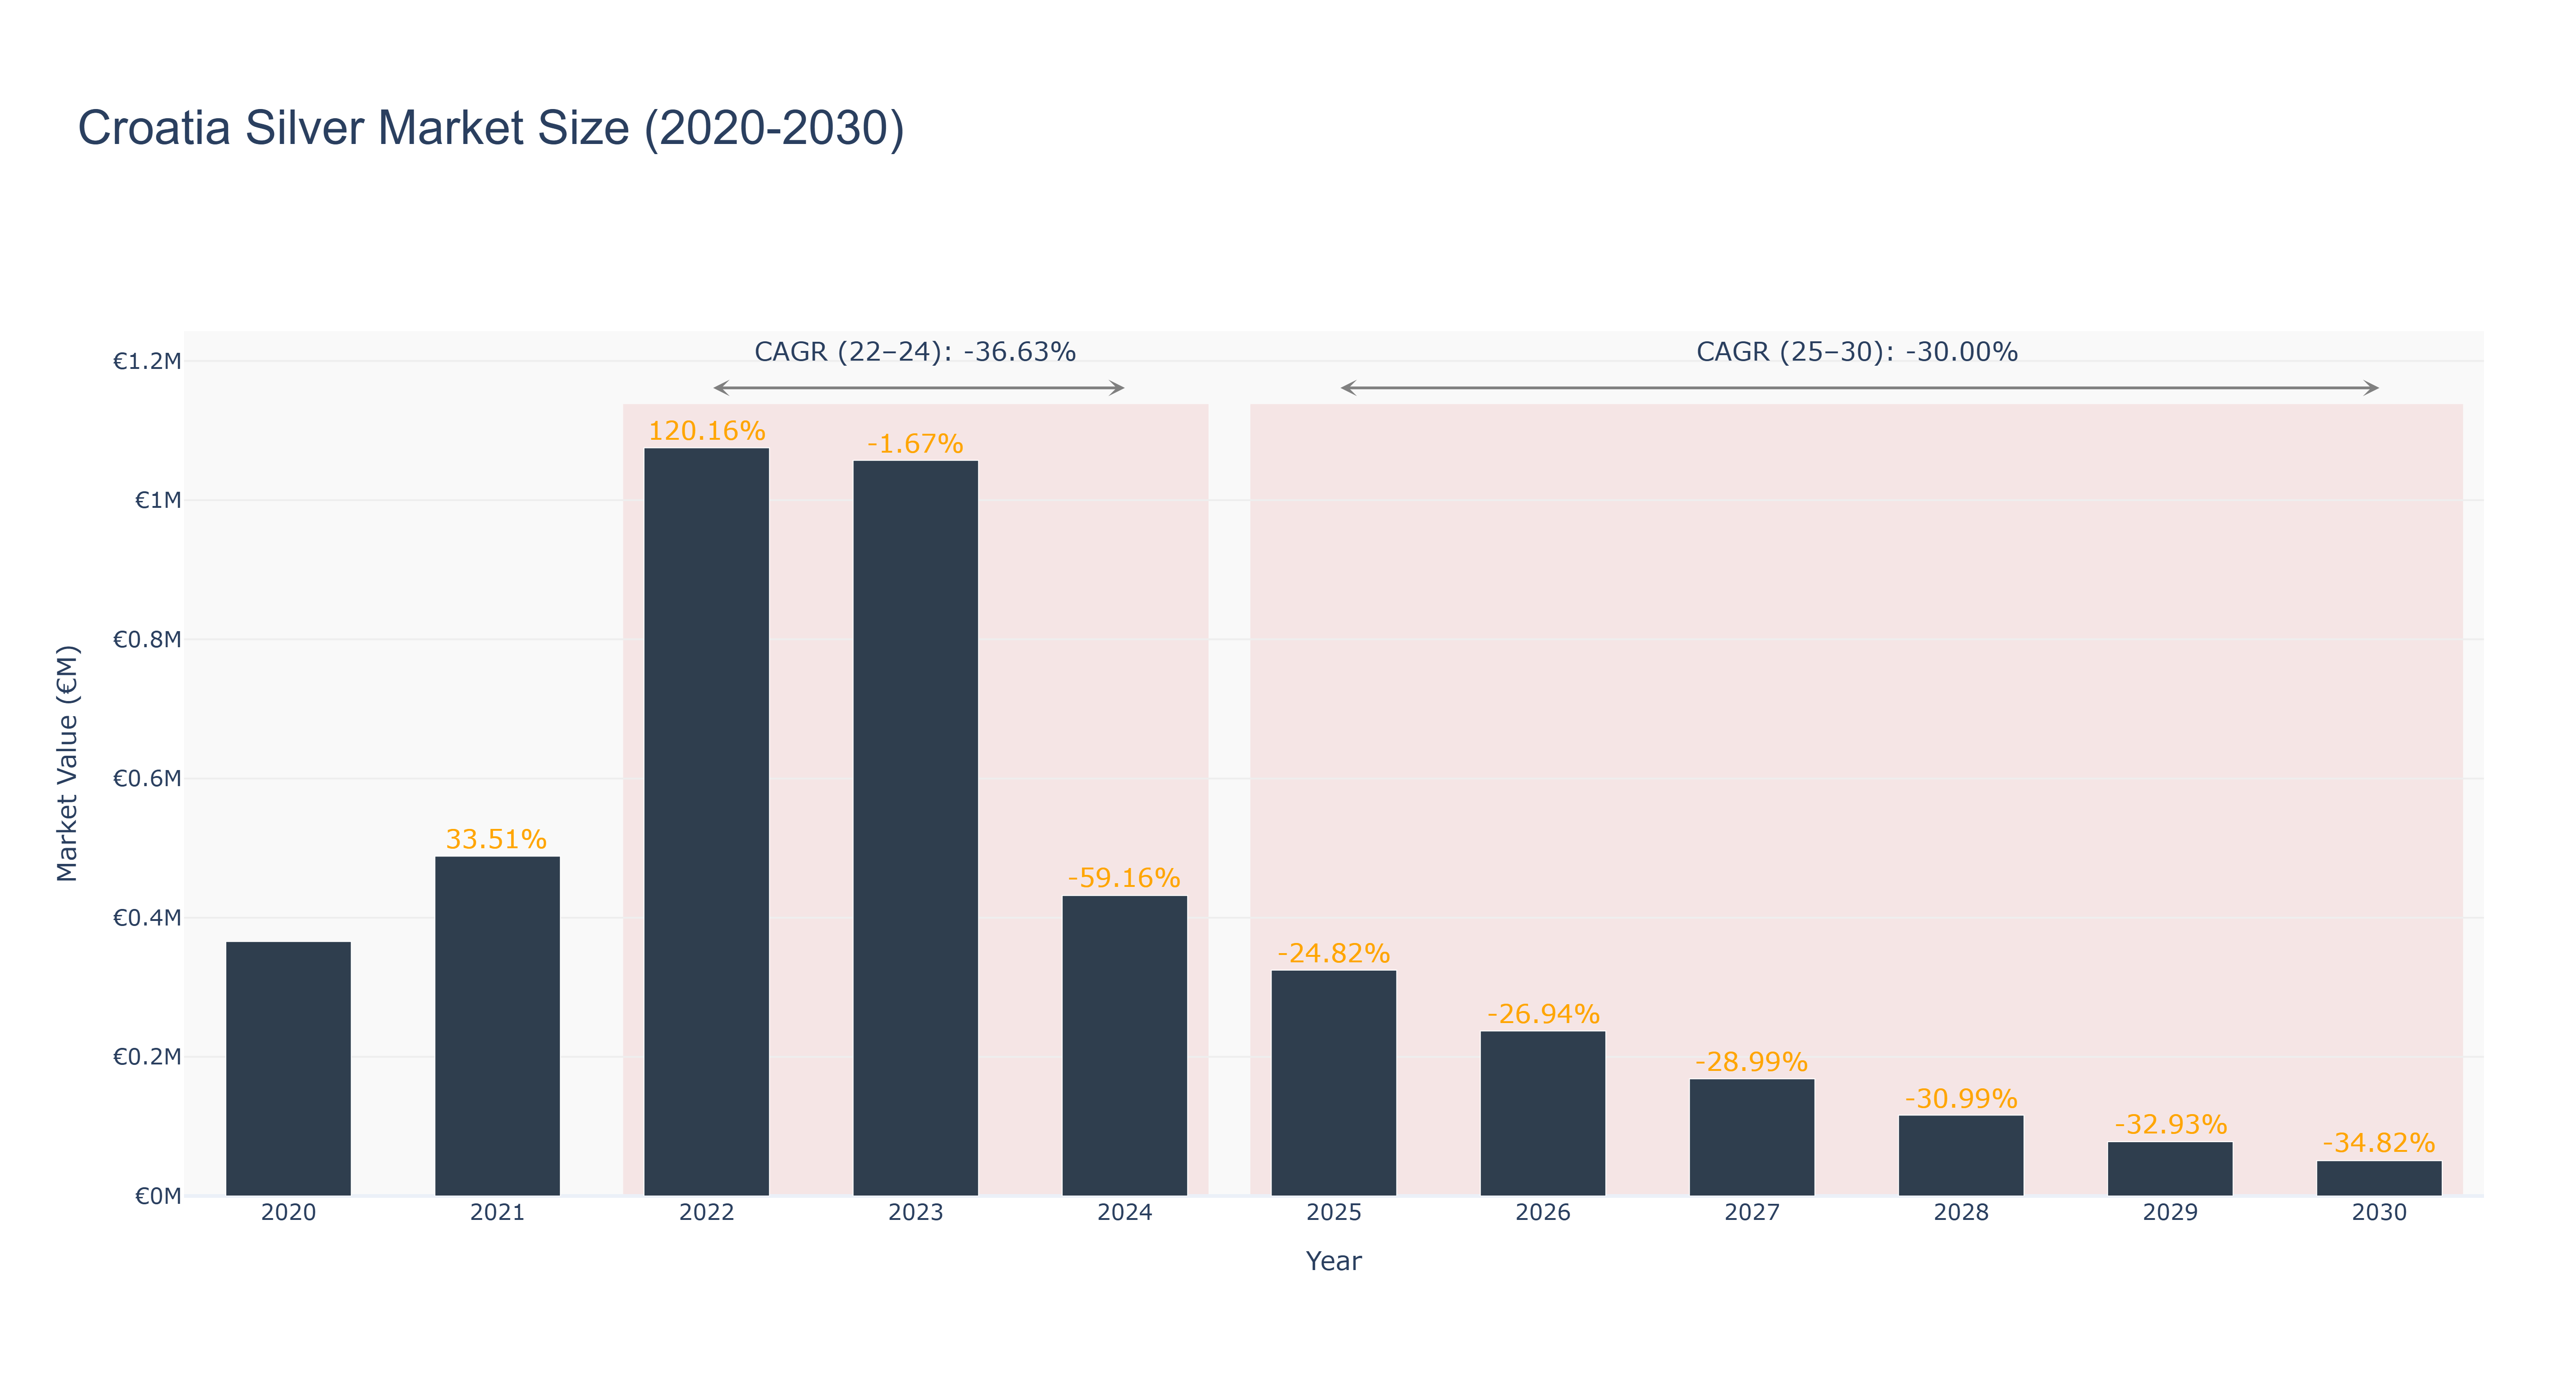
Croatia Silver Market has experienced a fluctuating trend over the past decade. The peak market size of €1.08 million was reached in 2022, followed by a significant decline to €0.32 million in 2025. The market is forecasted to further decrease to €0.05 million by 2030, with a CAGR of -30.0% from 2025 to 2030. The downturn can be attributed to various factors such as economic instability, changing consumer preferences, and increased competition. Despite the challenging environment, recent developments indicate that Croatia is focusing on enhancing its tourism sector to attract more visitors, potentially stimulating market growth in the future. Industry drivers like technological advancements and government initiatives will play a crucial role in shaping the market landscape in the coming years.
Croatia Silver Market: Production & Trade Performance (2019-2025)
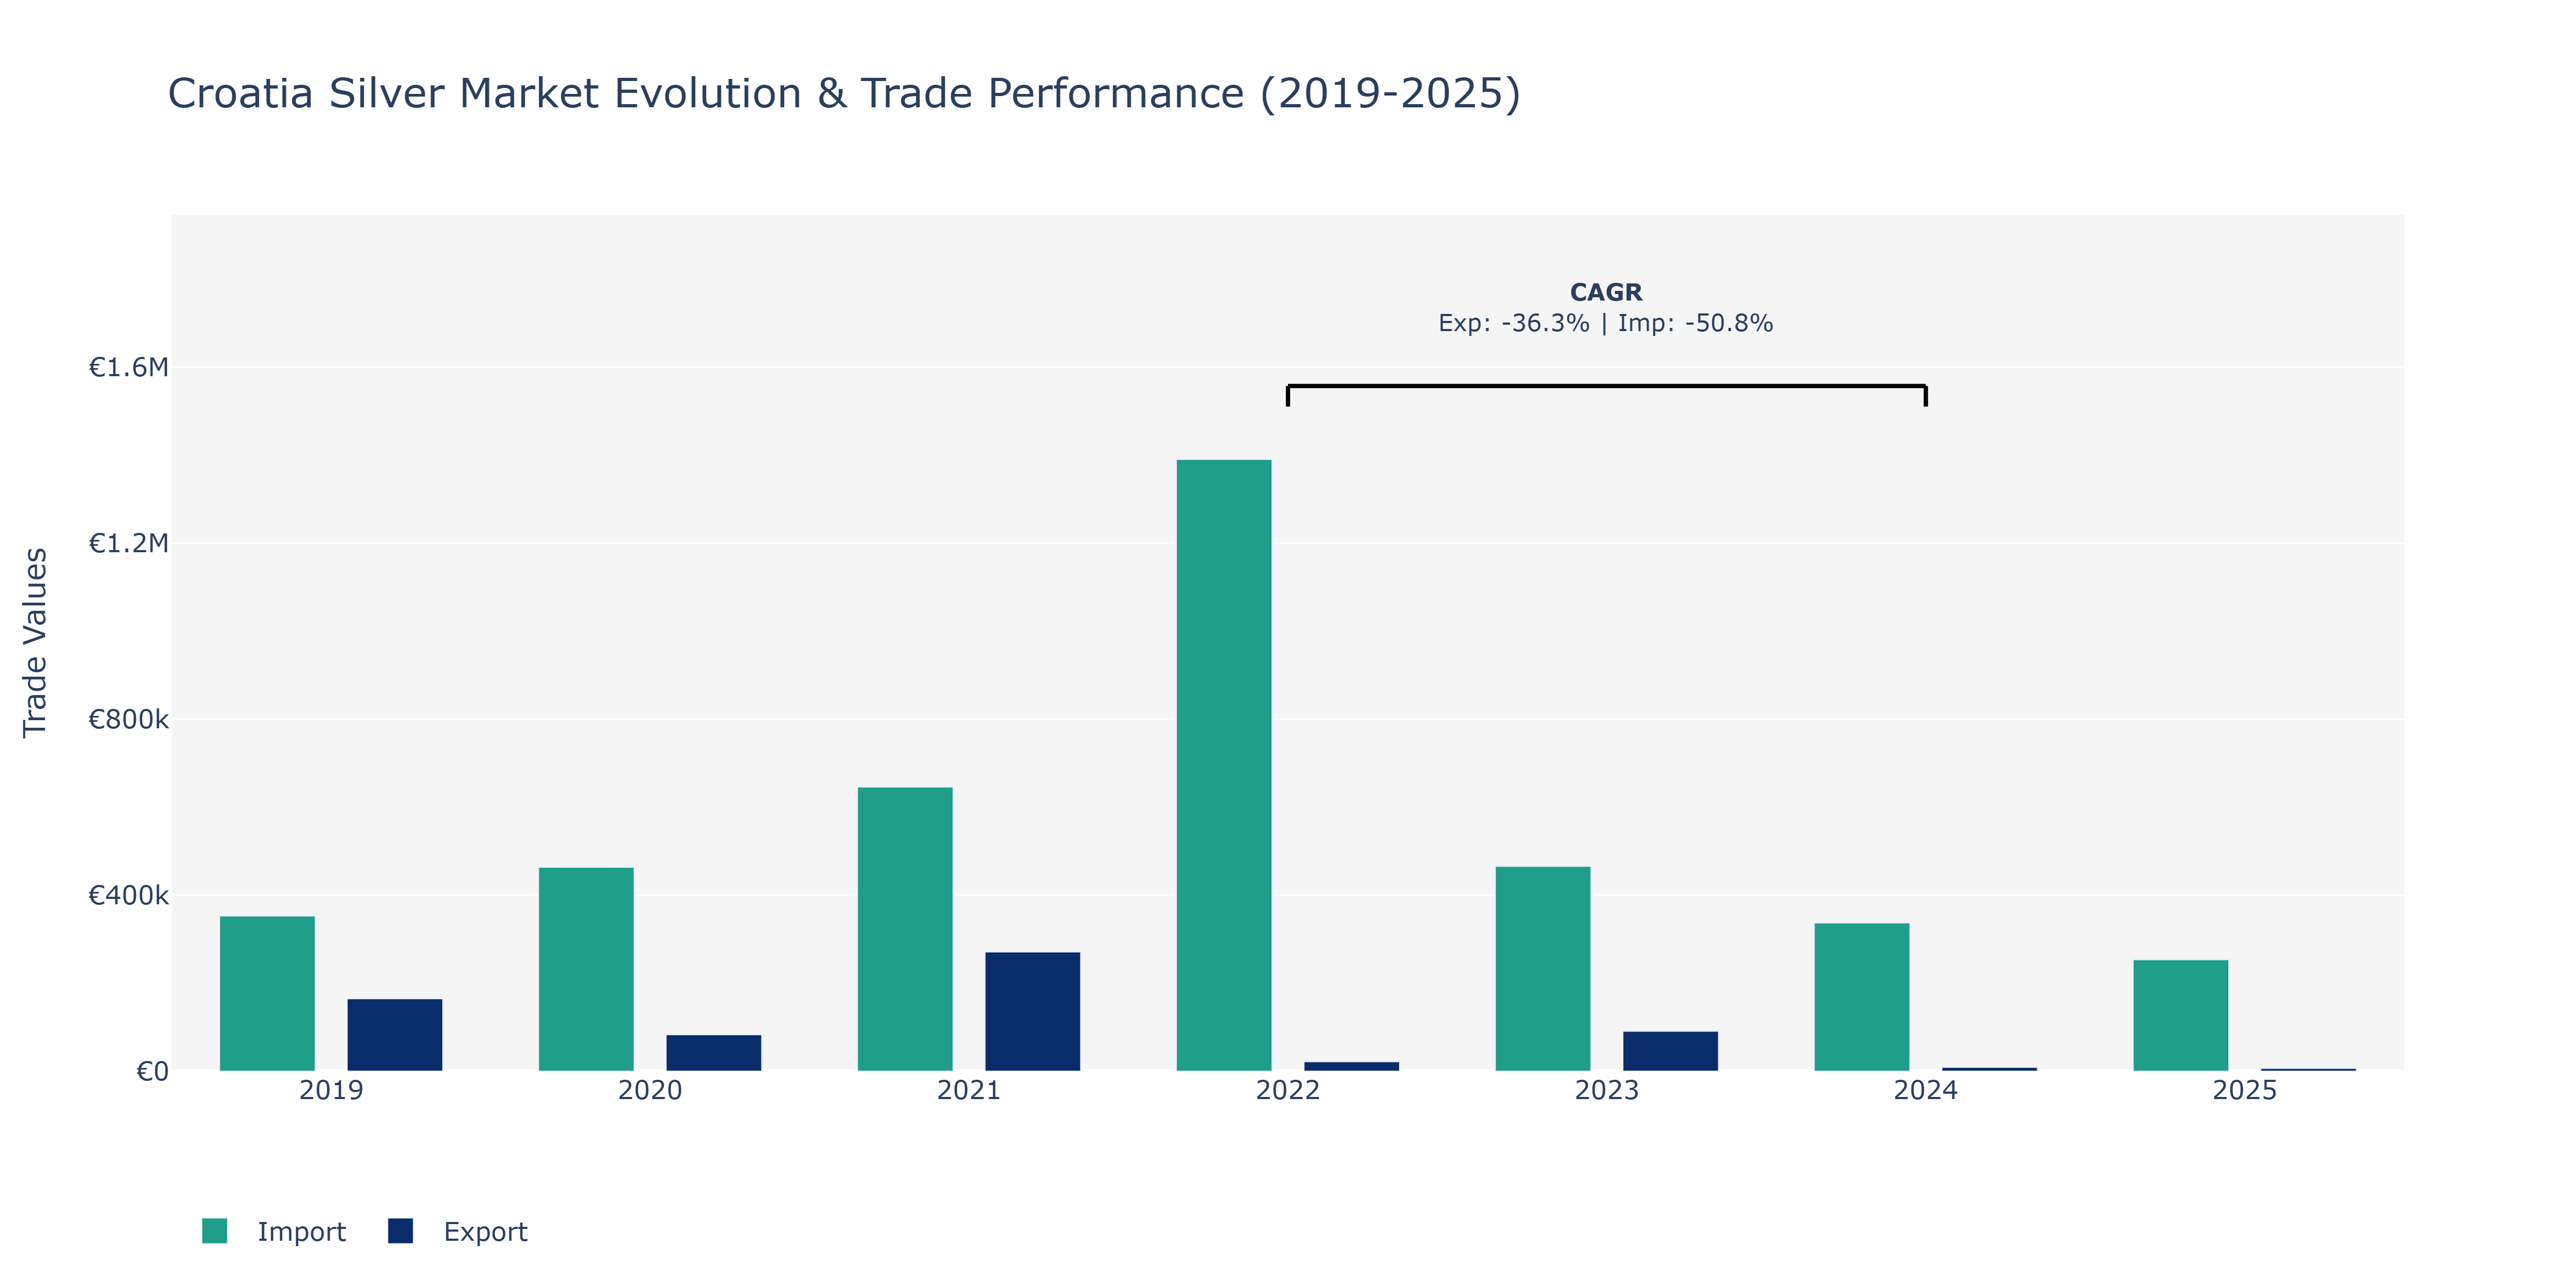
The Croatia Silver Market witnessed notable fluctuations in both Exports and Imports from 2019 to 2025. Exports peaked in 2021 at €271.13 thousand before experiencing a sharp decline to €21.49 thousand in 2022. This drastic drop could be attributed to external factors such as changes in global demand for silver products or disruptions in the supply chain affecting Croatia's export capabilities. On the other hand, Imports surged to €1.39 million in 2022 from €352.72 thousand in 2019, indicating a strong upward trend driven by increased domestic consumption or strategic sourcing decisions. The subsequent decrease in Imports to €465.59 thousand in 2023 may reflect adjustments in procurement strategies or market dynamics influencing inbound shipments. The market's resilience to navigate these shifts underscores the importance of monitoring global economic conditions and trade policies to sustain a balanced silver trade ecosystem in Croatia.
Key Highlights of the Report:
- Croatia Silver Market Outlook
- Market Size of Croatia Silver Market, 2025
- Forecast of Croatia Silver Market, 2032
- Historical Data and Forecast of Croatia Silver Revenues & Volume for the Period 2022 - 2032F
- Croatia Silver Market Trend Evolution
- Croatia Silver Market Drivers and Challenges
- Croatia Silver Price Trends
- Croatia Silver Porter`s Five Forces
- Croatia Silver Industry Life Cycle
- Historical Data and Forecast of Croatia Silver Market Revenues & Volume By Type for the Period 2022 - 2032F
- Historical Data and Forecast of Croatia Silver Market Revenues & Volume By Sterling Silver for the Period 2022 - 2032F
- Historical Data and Forecast of Croatia Silver Market Revenues & Volume By German Silver for the Period 2022 - 2032F
- Historical Data and Forecast of Croatia Silver Market Revenues & Volume By Coin Silver for the Period 2022 - 2032F
- Historical Data and Forecast of Croatia Silver Market Revenues & Volume By Britannia Silver for the Period 2022 - 2032F
- Historical Data and Forecast of Croatia Silver Market Revenues & Volume By Mexican Silver for the Period 2022 - 2032F
- Historical Data and Forecast of Croatia Silver Market Revenues & Volume By Russian Silver for the Period 2022 - 2032F
- Historical Data and Forecast of Croatia Silver Market Revenues & Volume By Oxidized Silver for the Period 2022 - 2032F
- Historical Data and Forecast of Croatia Sterling Silver Silver Market Revenues & Volume By Others for the Period 2022 - 2032F
- Historical Data and Forecast of Croatia Silver Market Revenues & Volume By Application for the Period 2022 - 2032F
- Historical Data and Forecast of Croatia Silver Market Revenues & Volume By Silverware for the Period 2022 - 2032F
- Historical Data and Forecast of Croatia Silver Market Revenues & Volume By Industrial for the Period 2022 - 2032F
- Historical Data and Forecast of Croatia Silver Market Revenues & Volume By Jewelry for the Period 2022 - 2032F
- Historical Data and Forecast of Croatia Silver Market Revenues & Volume By Investment for the Period 2022 - 2032F
- Historical Data and Forecast of Croatia Silver Market Revenues & Volume By Photographic for the Period 2022 - 2032F
- Historical Data and Forecast of Croatia Silver Market Revenues & Volume By Films for the Period 2022 - 2032F
- Historical Data and Forecast of Croatia Silver Market Revenues & Volume By Electrical And Electronics for the Period 2022 - 2032F
- Historical Data and Forecast of Croatia Silver Market Revenues & Volume By Pharmaceuticals for the Period 2022 - 2032F
- Croatia Silver Import Export Trade Statistics
- Market Opportunity Assessment By Type
- Market Opportunity Assessment By Application
- Croatia Silver Top Companies Market Share
- Croatia Silver Competitive Benchmarking By Technical and Operational Parameters
- Croatia Silver Company Profiles
- Croatia Silver Key Strategic Recommendations
Frequently Asked Questions About the Market Study (FAQs):
6Wresearch actively monitors the Croatia Silver Market and publishes its comprehensive annual report, highlighting emerging trends, growth drivers, revenue analysis, and forecast outlook. Our insights help businesses to make data-backed strategic decisions with ongoing market dynamics. Our analysts track relevent industries related to the Croatia Silver Market, allowing our clients with actionable intelligence and reliable forecasts tailored to emerging regional needs.
Yes, we provide customisation as per your requirements. To learn more, feel free to contact us on sales@6wresearch.com
1 Executive Summary |
2 Introduction |
2.1 Key Highlights of the Report |
2.2 Report Description |
2.3 Market Scope & Segmentation |
2.4 Research Methodology |
2.5 Assumptions |
3 Croatia Silver Market Overview |
3.1 Croatia Country Macro Economic Indicators |
3.2 Croatia Silver Market Revenues & Volume, 2022 & 2032F |
3.3 Croatia Silver Market - Industry Life Cycle |
3.4 Croatia Silver Market - Porter's Five Forces |
3.5 Croatia Silver Market Revenues & Volume Share, By Type, 2022 & 2032F |
3.6 Croatia Silver Market Revenues & Volume Share, By Application, 2022 & 2032F |
4 Croatia Silver Market Dynamics |
4.1 Impact Analysis |
4.2 Market Drivers |
4.2.1 Growing disposable income in Croatia, leading to increased consumer spending on luxury items like silver jewelry. |
4.2.2 Rising popularity of silver jewelry as a fashionable and affordable alternative to gold. |
4.2.3 Increasing tourism in Croatia, attracting visitors looking to purchase souvenirs such as silver items. |
4.3 Market Restraints |
4.3.1 Fluctuating silver prices in the global market affecting the cost of production and pricing of silver products. |
4.3.2 Competition from other materials like stainless steel or fashion jewelry impacting the demand for silver items. |
4.3.3 Economic uncertainties and fluctuations affecting consumer confidence and willingness to spend on luxury items. |
5 Croatia Silver Market Trends |
6 Croatia Silver Market Segmentations |
6.1 Croatia Silver Market, By Type |
6.1.1 Overview and Analysis |
6.1.2 Croatia Silver Market Revenues & Volume, By Sterling Silver, 2022 - 2032F |
6.1.3 Croatia Silver Market Revenues & Volume, By German Silver, 2022 - 2032F |
6.1.4 Croatia Silver Market Revenues & Volume, By Coin Silver, 2022 - 2032F |
6.1.5 Croatia Silver Market Revenues & Volume, By Britannia Silver, 2022 - 2032F |
6.1.6 Croatia Silver Market Revenues & Volume, By Mexican Silver, 2022 - 2032F |
6.1.7 Croatia Silver Market Revenues & Volume, By Russian Silver, 2022 - 2032F |
6.1.9 Croatia Silver Market Revenues & Volume, By Others, 2022 - 2032F |
6.1.10 Croatia Silver Market Revenues & Volume, By Others, 2022 - 2032F |
6.2 Croatia Silver Market, By Application |
6.2.1 Overview and Analysis |
6.2.2 Croatia Silver Market Revenues & Volume, By Silverware, 2022 - 2032F |
6.2.3 Croatia Silver Market Revenues & Volume, By Industrial, 2022 - 2032F |
6.2.4 Croatia Silver Market Revenues & Volume, By Jewelry, 2022 - 2032F |
6.2.5 Croatia Silver Market Revenues & Volume, By Investment, 2022 - 2032F |
6.2.6 Croatia Silver Market Revenues & Volume, By Photographic , 2022 - 2032F |
6.2.7 Croatia Silver Market Revenues & Volume, By Films, 2022 - 2032F |
6.2.8 Croatia Silver Market Revenues & Volume, By Pharmaceuticals, 2022 - 2032F |
6.2.9 Croatia Silver Market Revenues & Volume, By Pharmaceuticals, 2022 - 2032F |
7 Croatia Silver Market Import-Export Trade Statistics |
7.1 Croatia Silver Market Export to Major Countries |
7.2 Croatia Silver Market Imports from Major Countries |
8 Croatia Silver Market Key Performance Indicators |
8.1 Average transaction value per customer in the silver market. |
8.2 Number of tourists purchasing silver items in Croatia. |
8.3 Percentage of repeat customers in the silver market. |
8.4 Online engagement metrics such as website traffic, social media followers, and online reviews for silver retailers. |
8.5 Percentage of local artisans using traditional Croatian silver crafting techniques. |
9 Croatia Silver Market - Opportunity Assessment |
9.1 Croatia Silver Market Opportunity Assessment, By Type, 2022 & 2032F |
9.2 Croatia Silver Market Opportunity Assessment, By Application, 2022 & 2032F |
10 Croatia Silver Market - Competitive Landscape |
10.1 Croatia Silver Market Revenue Share, By Companies, 2025 |
10.2 Croatia Silver Market Competitive Benchmarking, By Operating and Technical Parameters |
11 Company Profiles |
12 Recommendations | 13 Disclaimer |
Global Go To Market Strategy - 2030
Export potential enables firms to identify high-growth global markets with greater confidence by combining advanced trade intelligence with a structured quantitative methodology. The framework analyzes emerging demand trends and country-level import patterns while integrating macroeconomic and trade datasets such as GDP and population forecasts, bilateral import–export flows, tariff structures, elasticity differentials between developed and developing economies, geographic distance, and import demand projections. Using weighted trade values from 2020–2024 as the base period to project country-to-country export potential for 2030, these inputs are operationalized through calculated drivers such as gravity model parameters, tariff impact factors, and projected GDP per-capita growth. Through an analysis of hidden potentials, demand hotspots, and market conditions that are most favorable to success, this method enables firms to focus on target countries, maximize returns, and global expansion with data, backed by accuracy.
By factoring in the projected importer demand gap that is currently unmet and could be potential opportunity, it identifies the potential for the Exporter (Country) among 190 countries, against the general trade analysis, which identifies the biggest importer or exporter.
To discover high-growth global markets and optimize your business strategy:
Click Here
Pricing
- Single User License$ 1,995
- Department License$ 2,400
- Site License$ 3,120
- Global License$ 3,795

Leadership Perspectives from Industry Events
Search
Thought Leadership and Analyst Meet


Our Clients
6WResearch In News
- India Export Attractiveness Tracker 2026
- India Air Conditioner Market Set for Strong Rebound in 2026 After Weather-Led Correction and GST-Driven Recovery: 6Wresearch
- ADAS in India: How Automatic Emergency Braking, Blind Spot Detection & Driver Monitoring are Transforming Road Safety
- Doha a strategic location for EV manufacturing hub: IPA Qatar
- Demand for luxury TVs surging in the GCC, says Samsung
- Empowering Growth: The Thriving Journey of Bangladesh’s Cable Industry
Latest Reports
- Nicaragua RPG Gaming Market (2026-2032)
- New Zealand RPG Gaming Market (2026-2032)
- Netherlands RPG Gaming Market (2026-2032)
- Nauru RPG Gaming Market (2026-2032)
- Namibia RPG Gaming Market (2026-2032)
- Mozambique RPG Gaming Market (2026-2032)
- Montenegro RPG Gaming Market (2026-2032)
- Mongolia RPG Gaming Market (2026-2032)
- Monaco RPG Gaming Market (2026-2032)
- Micronesia RPG Gaming Market (2026-2032)
Industry Events and Analyst Meet

EV India Expo 2026

HIMTEX 2026

India Refining Summit 2026

India EV Show 2026

EV tech India Expo 2026
Whitepaper
- Middle East & Africa Commercial Security Market Click here to view more.
- Middle East & Africa Fire Safety Systems & Equipment Market Click here to view more.
- GCC Drone Market Click here to view more.
- Middle East Lighting Fixture Market Click here to view more.
- GCC Physical & Perimeter Security Market Click here to view more.