Croatia Slate Products Market (2026-2032) | Forecast, Analysis, Revenue, Segmentation, Companies, Trends, Outlook, Value, Industry, Growth, Size & Share
Market Forecast By Type (Natural, Synthetic Slate), By Application (Roof, Floor, Wall, Others) And Competitive Landscape
| Product Code: ETC5148718 | Publication Date: Nov 2023 | Updated Date: Apr 2026 | Product Type: Market Research Report | |
| Publisher: 6Wresearch | Author: Shubham Padhi | No. of Pages: 60 | No. of Figures: 30 | No. of Tables: 5 |
Croatia Slate Products Market Size (2020-2030)
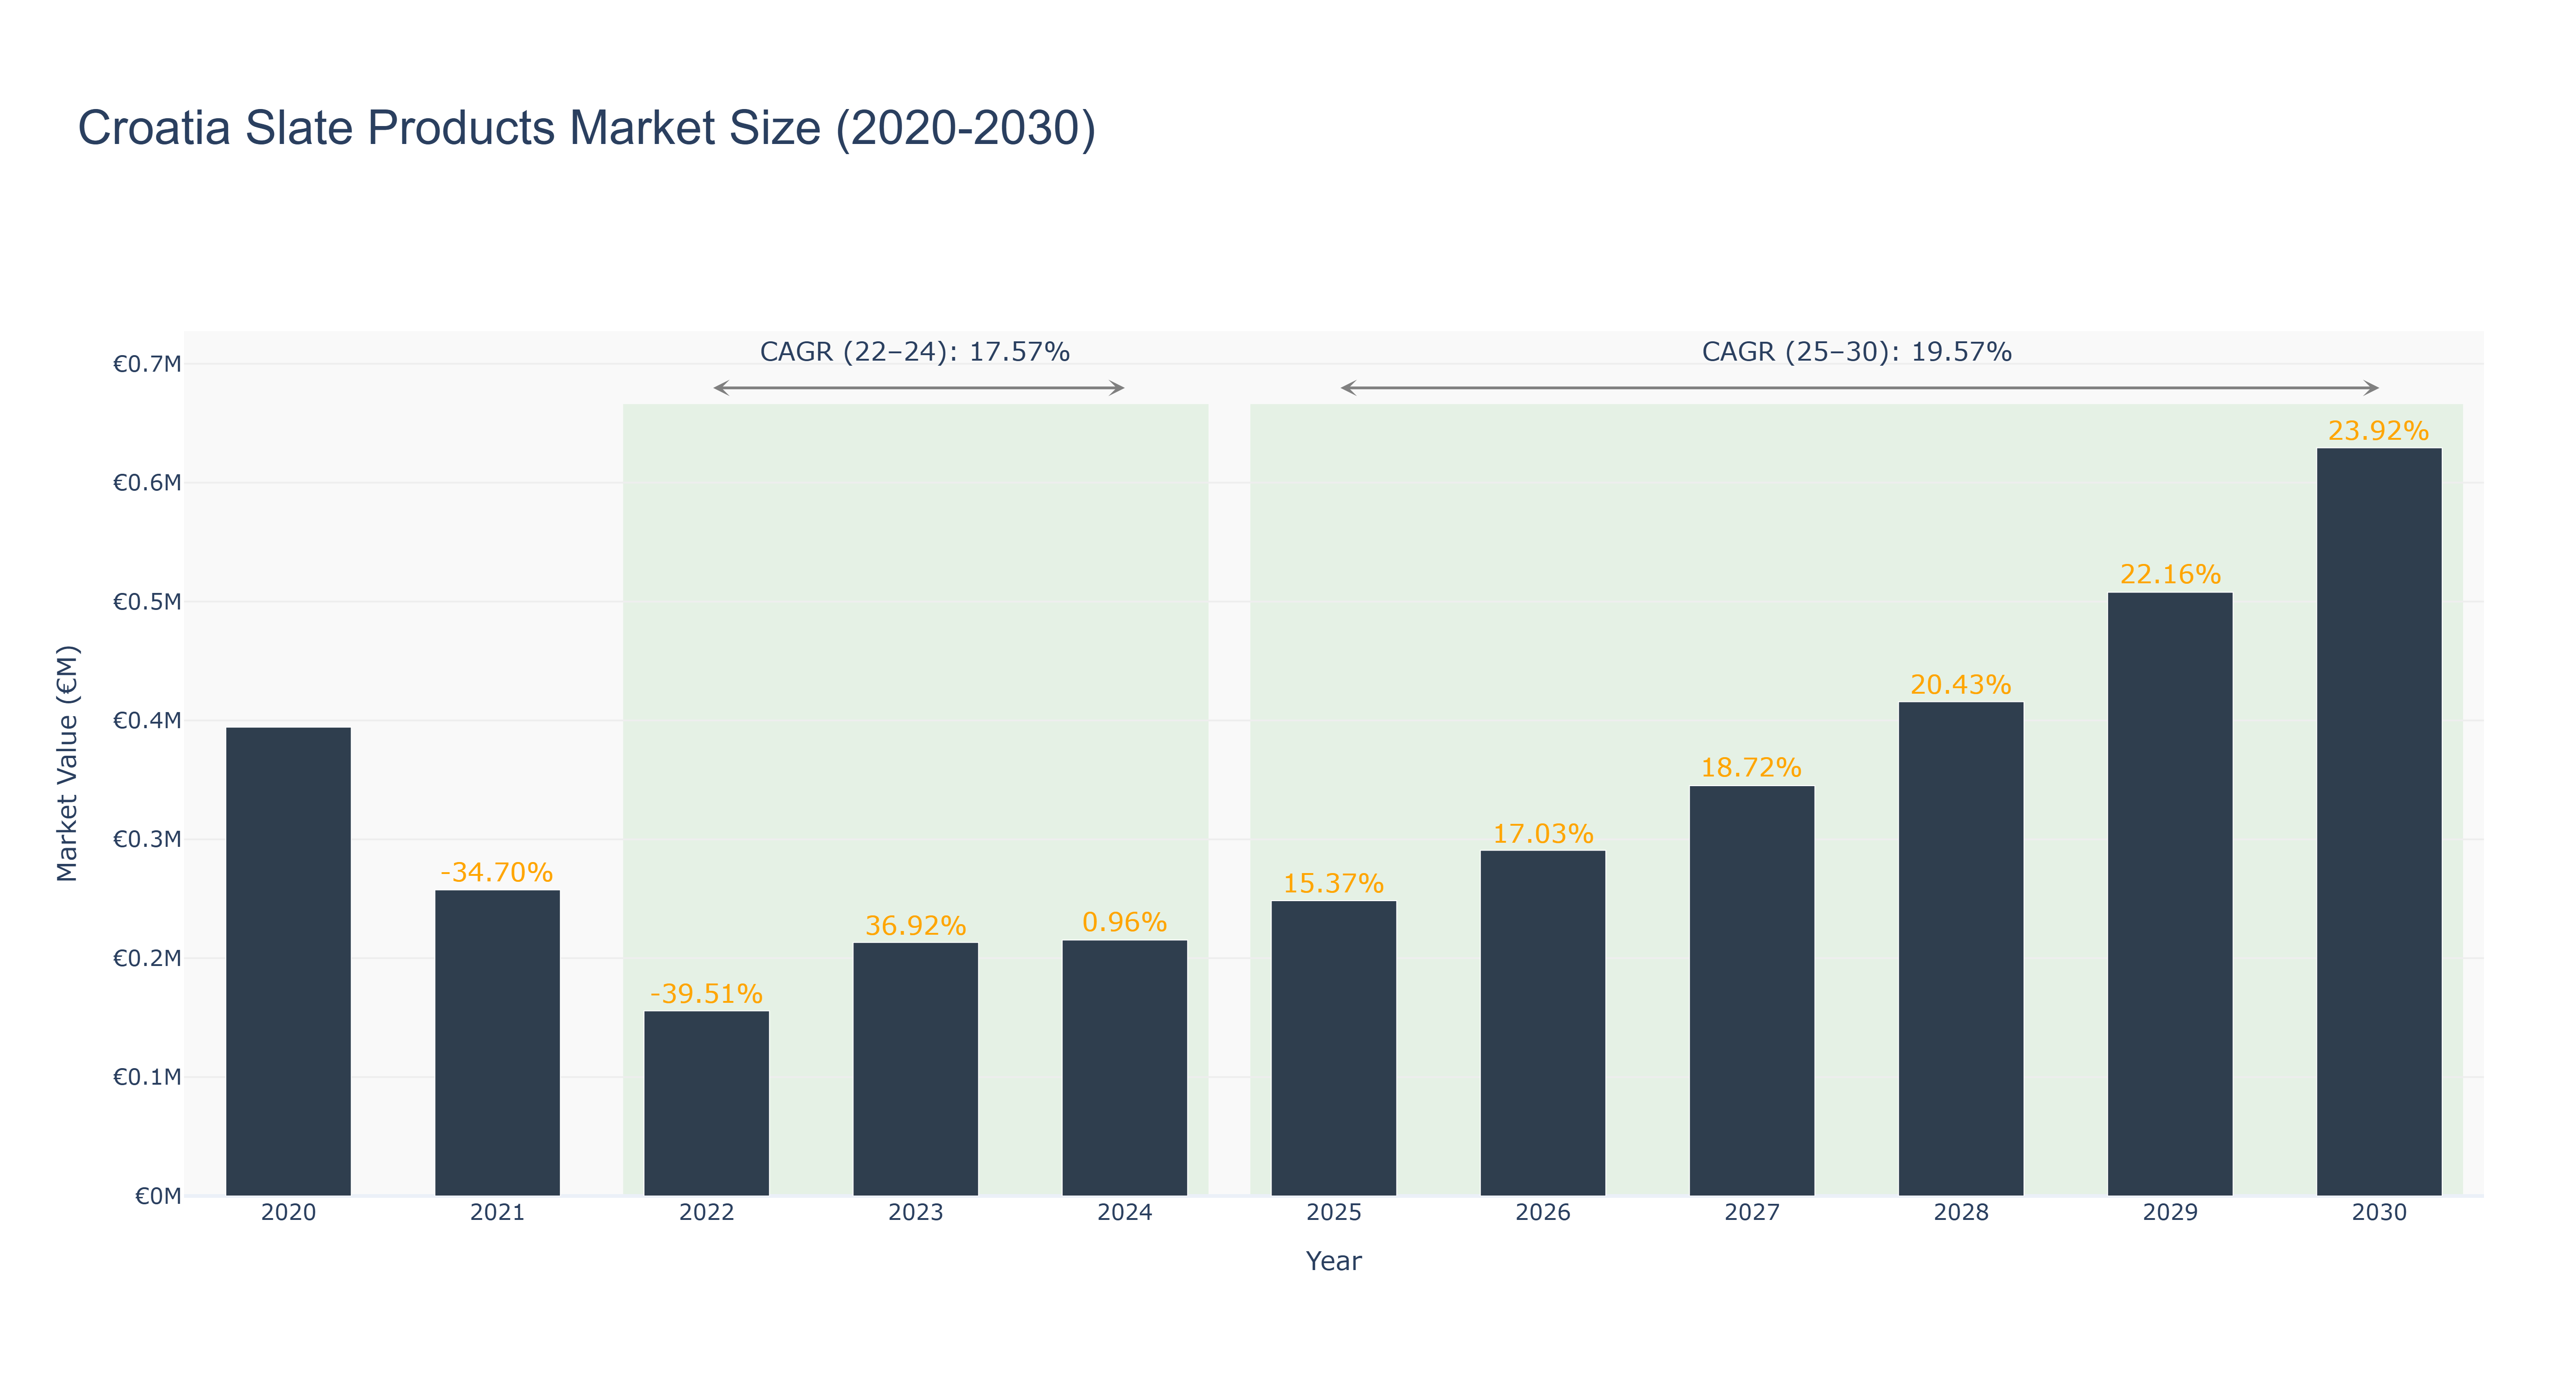
The Croatia Slate Products Market has shown a fluctuating trend in recent years. The peak market size was €0.63 million in 2030, with a steady growth rate. From 2020 to 2024, the market size decreased from €0.39 million to €0.22 million due to economic uncertainties impacting construction projects. However, from 2025 to 2030, the market is forecasted to grow significantly, with a CAGR of 19.57%, driven by increased demand for sustainable and aesthetically pleasing building materials in the construction sector. Recent developments in the market include the introduction of innovative slate products with enhanced durability and eco-friendly features. Future projects in Croatia's construction industry, focusing on infrastructure development and green building initiatives, are expected to further boost the demand for slate products in the coming years.
Croatia Slate Products Market: Production & Trade Performance (2019-2025)
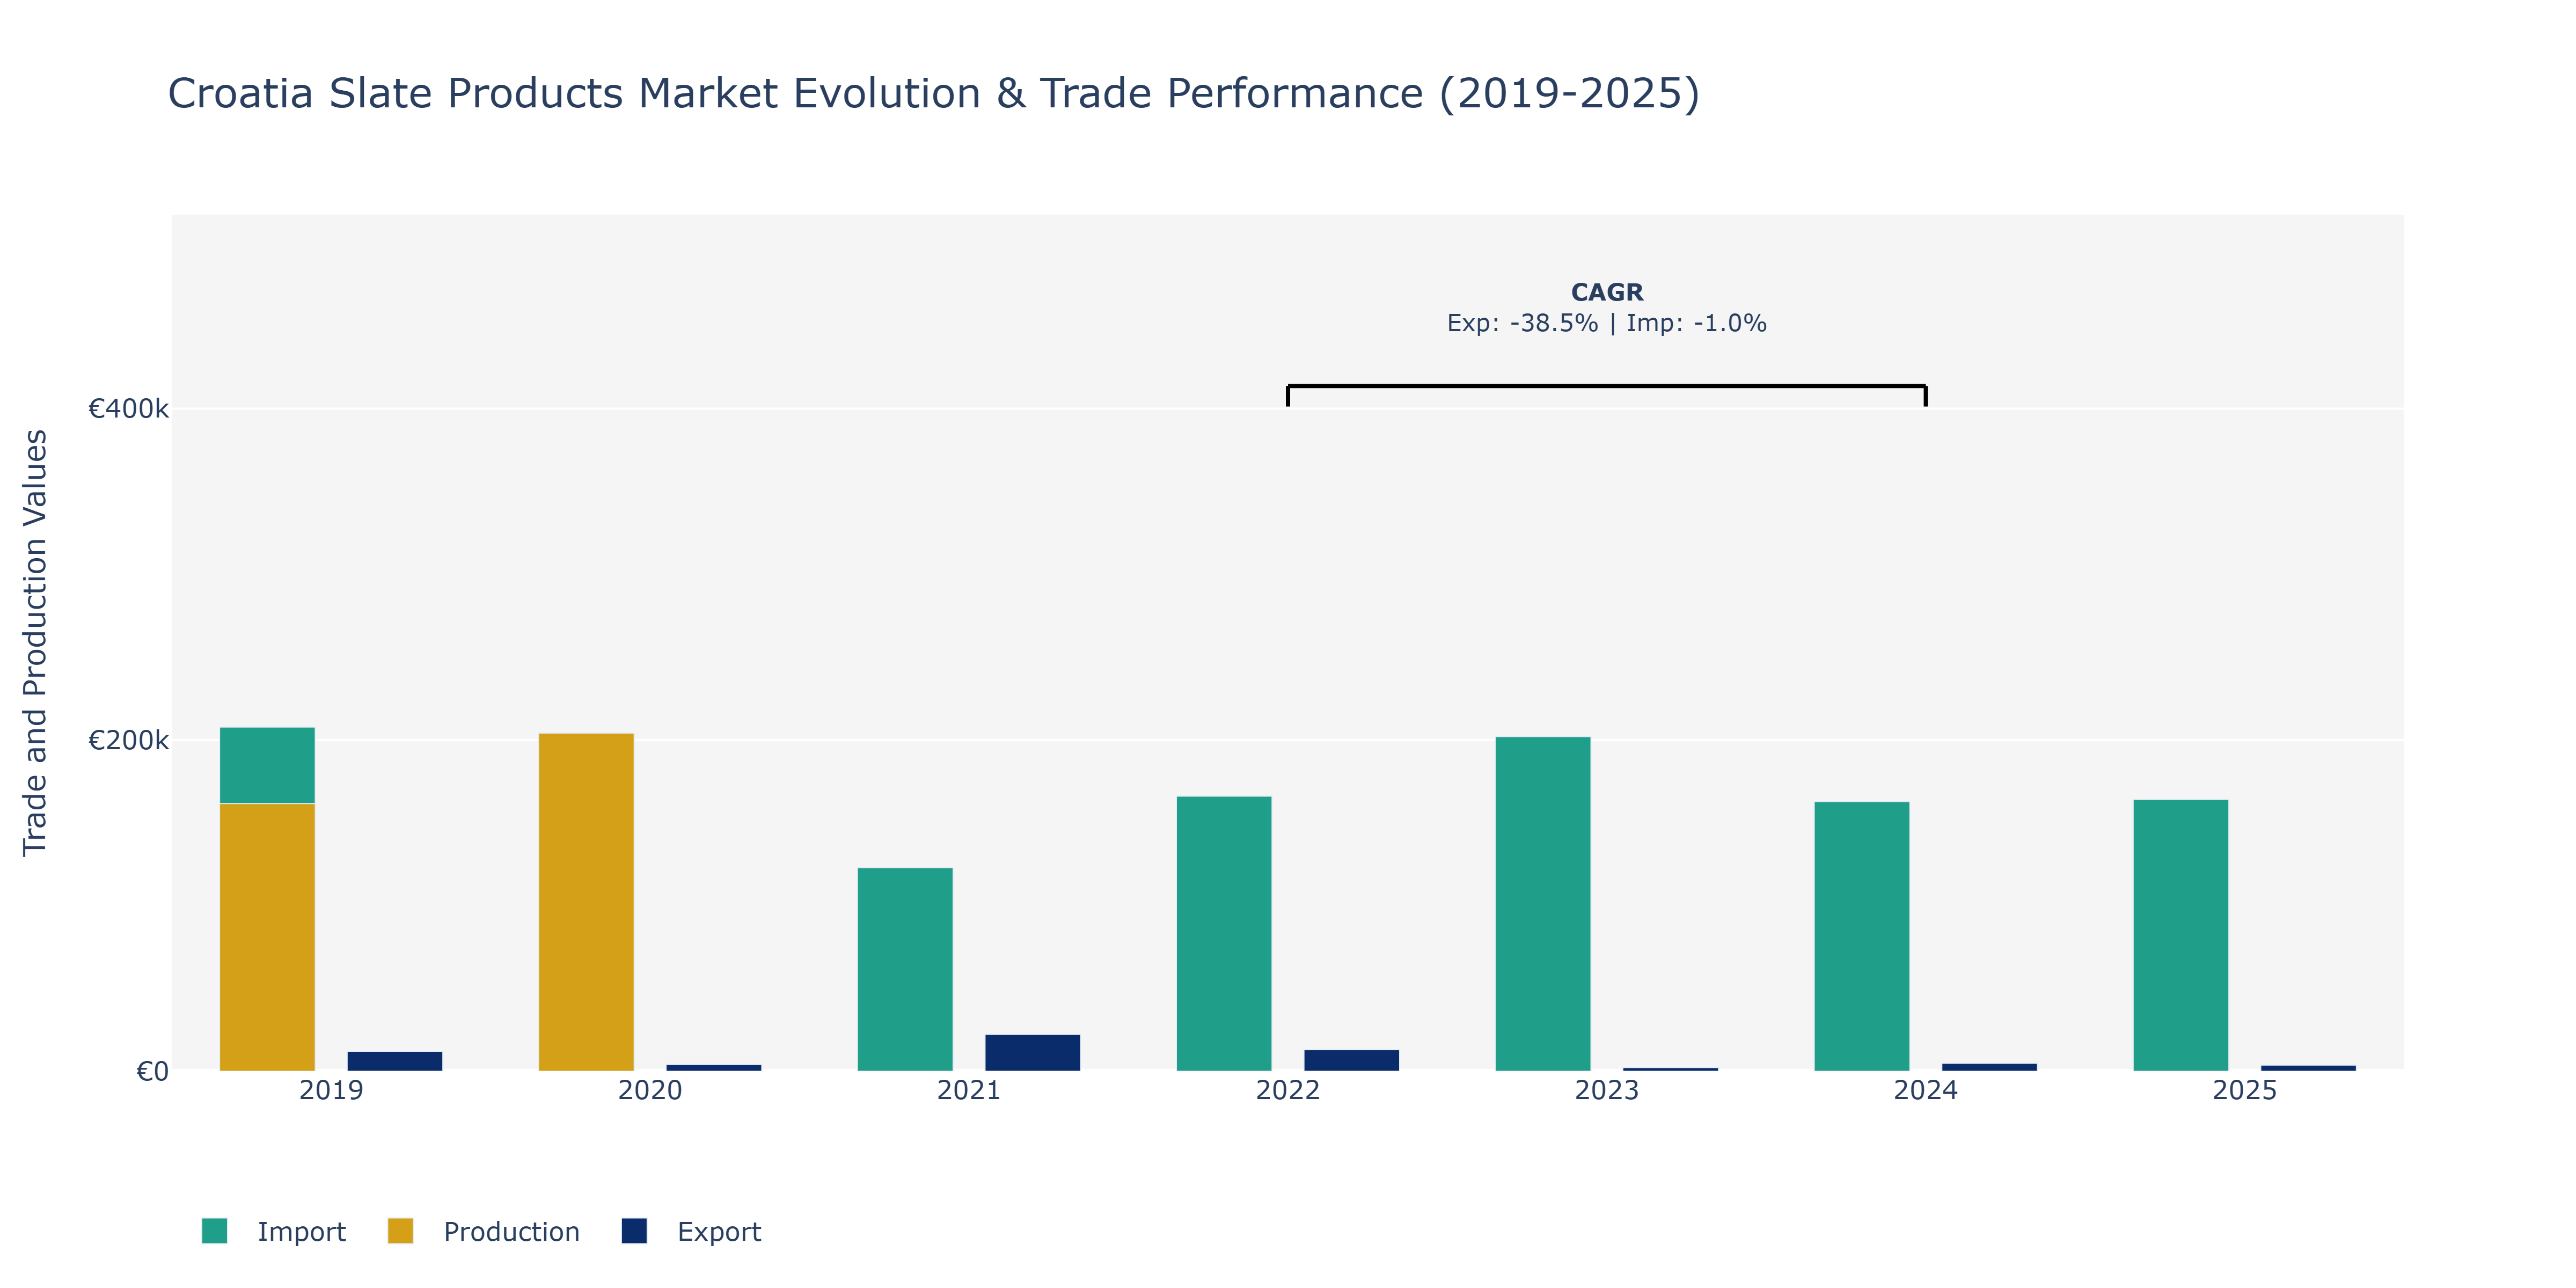
Between 2019 and 2025, the Croatia Slate Products Market saw noticeable fluctuations in exports, imports, and production. Exports peaked in 2021 at €22.27 thousand, representing a significant increase from 2019's €12.01 thousand, before declining sharply in subsequent years, hitting €3.68 thousand in 2025. Imports, on the other hand, experienced a more stable pattern, with the highest value recorded in 2019 at €207.78 thousand. Despite a slight decrease in 2020, imports remained relatively consistent until 2025 when they reached €164.05 thousand. Production also displayed a steady upward trend throughout the period, reaching €204.17 thousand in 2020. The fluctuating Export value could be attributed to changing global demand for slate products or shifts in competitive pricing strategies. Meanwhile, the resilient import numbers may reflect consistent domestic consumption or stable supplier relationships in the industry.
Key Highlights of the Report:
- Croatia Slate Products Market Outlook
- Market Size of Croatia Slate Products Market, 2025
- Forecast of Croatia Slate Products Market, 2032
- Historical Data and Forecast of Croatia Slate Products Revenues & Volume for the Period 2022 - 2032F
- Croatia Slate Products Market Trend Evolution
- Croatia Slate Products Market Drivers and Challenges
- Croatia Slate Products Price Trends
- Croatia Slate Products Porter`s Five Forces
- Croatia Slate Products Industry Life Cycle
- Historical Data and Forecast of Croatia Slate Products Market Revenues & Volume By Type for the Period 2022 - 2032F
- Historical Data and Forecast of Croatia Slate Products Market Revenues & Volume By Natural for the Period 2022 - 2032F
- Historical Data and Forecast of Croatia Slate Products Market Revenues & Volume By Synthetic Slate for the Period 2022 - 2032F
- Historical Data and Forecast of Croatia Slate Products Market Revenues & Volume By Application for the Period 2022 - 2032F
- Historical Data and Forecast of Croatia Slate Products Market Revenues & Volume By Roof for the Period 2022 - 2032F
- Historical Data and Forecast of Croatia Slate Products Market Revenues & Volume By Floor for the Period 2022 - 2032F
- Historical Data and Forecast of Croatia Slate Products Market Revenues & Volume By Wall for the Period 2022 - 2032F
- Historical Data and Forecast of Croatia Slate Products Market Revenues & Volume By Others for the Period 2022 - 2032F
- Croatia Slate Products Import Export Trade Statistics
- Market Opportunity Assessment By Type
- Market Opportunity Assessment By Application
- Croatia Slate Products Top Companies Market Share
- Croatia Slate Products Competitive Benchmarking By Technical and Operational Parameters
- Croatia Slate Products Company Profiles
- Croatia Slate Products Key Strategic Recommendations
Frequently Asked Questions About the Market Study (FAQs):
6Wresearch actively monitors the Croatia Slate Products Market and publishes its comprehensive annual report, highlighting emerging trends, growth drivers, revenue analysis, and forecast outlook. Our insights help businesses to make data-backed strategic decisions with ongoing market dynamics. Our analysts track relevent industries related to the Croatia Slate Products Market, allowing our clients with actionable intelligence and reliable forecasts tailored to emerging regional needs.
Yes, we provide customisation as per your requirements. To learn more, feel free to contact us on sales@6wresearch.com
1 Executive Summary |
2 Introduction |
2.1 Key Highlights of the Report |
2.2 Report Description |
2.3 Market Scope & Segmentation |
2.4 Research Methodology |
2.5 Assumptions |
3 Croatia Slate Products Market Overview |
3.1 Croatia Country Macro Economic Indicators |
3.2 Croatia Slate Products Market Revenues & Volume, 2022 & 2032F |
3.3 Croatia Slate Products Market - Industry Life Cycle |
3.4 Croatia Slate Products Market - Porter's Five Forces |
3.5 Croatia Slate Products Market Revenues & Volume Share, By Type, 2022 & 2032F |
3.6 Croatia Slate Products Market Revenues & Volume Share, By Application, 2022 & 2032F |
4 Croatia Slate Products Market Dynamics |
4.1 Impact Analysis |
4.2 Market Drivers |
4.2.1 Growing demand for eco-friendly and sustainable building materials |
4.2.2 Increasing popularity of natural stone products in interior and exterior design |
4.2.3 Rise in construction activities and infrastructure development in Croatia |
4.3 Market Restraints |
4.3.1 High initial cost associated with slate products |
4.3.2 Limited availability of high-quality slate reserves in Croatia |
4.3.3 Competition from alternative materials like ceramic tiles and engineered stone |
5 Croatia Slate Products Market Trends |
6 Croatia Slate Products Market Segmentations |
6.1 Croatia Slate Products Market, By Type |
6.1.1 Overview and Analysis |
6.1.2 Croatia Slate Products Market Revenues & Volume, By Natural, 2022 - 2032F |
6.1.3 Croatia Slate Products Market Revenues & Volume, By Synthetic Slate, 2022 - 2032F |
6.2 Croatia Slate Products Market, By Application |
6.2.1 Overview and Analysis |
6.2.2 Croatia Slate Products Market Revenues & Volume, By Roof, 2022 - 2032F |
6.2.3 Croatia Slate Products Market Revenues & Volume, By Floor, 2022 - 2032F |
6.2.4 Croatia Slate Products Market Revenues & Volume, By Wall, 2022 - 2032F |
6.2.5 Croatia Slate Products Market Revenues & Volume, By Others, 2022 - 2032F |
7 Croatia Slate Products Market Import-Export Trade Statistics |
7.1 Croatia Slate Products Market Export to Major Countries |
7.2 Croatia Slate Products Market Imports from Major Countries |
8 Croatia Slate Products Market Key Performance Indicators |
8.1 Number of new construction projects incorporating slate products |
8.2 Percentage of architects and designers specifying slate products in their projects |
8.3 Average price per unit of slate products sold |
8.4 Customer satisfaction ratings for slate product quality and durability |
8.5 Percentage of repeat customers purchasing slate products |
9 Croatia Slate Products Market - Opportunity Assessment |
9.1 Croatia Slate Products Market Opportunity Assessment, By Type, 2022 & 2032F |
9.2 Croatia Slate Products Market Opportunity Assessment, By Application, 2022 & 2032F |
10 Croatia Slate Products Market - Competitive Landscape |
10.1 Croatia Slate Products Market Revenue Share, By Companies, 2025 |
10.2 Croatia Slate Products Market Competitive Benchmarking, By Operating and Technical Parameters |
11 Company Profiles |
12 Recommendations | 13 Disclaimer |
Export potential assessment - trade Analytics for 2030
Export potential enables firms to identify high-growth global markets with greater confidence by combining advanced trade intelligence with a structured quantitative methodology. The framework analyzes emerging demand trends and country-level import patterns while integrating macroeconomic and trade datasets such as GDP and population forecasts, bilateral import–export flows, tariff structures, elasticity differentials between developed and developing economies, geographic distance, and import demand projections. Using weighted trade values from 2020–2024 as the base period to project country-to-country export potential for 2030, these inputs are operationalized through calculated drivers such as gravity model parameters, tariff impact factors, and projected GDP per-capita growth. Through an analysis of hidden potentials, demand hotspots, and market conditions that are most favorable to success, this method enables firms to focus on target countries, maximize returns, and global expansion with data, backed by accuracy.
By factoring in the projected importer demand gap that is currently unmet and could be potential opportunity, it identifies the potential for the Exporter (Country) among 190 countries, against the general trade analysis, which identifies the biggest importer or exporter.
To discover high-growth global markets and optimize your business strategy:
Click Here
Pricing
- Single User License$ 1,995
- Department License$ 2,400
- Site License$ 3,120
- Global License$ 3,795

Search
Thought Leadership and Analyst Meet


Our Clients
Latest Reports
- France Thermally Conductive Filler Dispersants Market (2026-2032) | Challenges, Restraints, Value, Share, Size, segmentation, Analysis, Trends, Investment Opportunities, Outlook, Pricing, Demand, Forecast, Revenue, Companies, Growth, Drivers, Strategy, Insights, Competition
- Egypt Thermally Conductive Filler Dispersants Market (2026-2032) | Competition, Forecast, Strategy, Value, Insights, Outlook, Investment Opportunities, Pricing, Demand, Share, segmentation, Drivers, Size, Companies, Restraints, Growth, Trends, Revenue, Challenges, Analysis
- Czech Republic Thermally Conductive Filler Dispersants Market (2026-2032) | Forecast, Pricing, Analysis, Drivers, Insights, Size, Demand, Growth, Challenges, segmentation, Competition, Outlook, Trends, Investment Opportunities, Companies, Strategy, Revenue, Share, Value, Restraints
- Colombia Thermally Conductive Filler Dispersants Market (2026-2032) | segmentation, Trends, Share, Drivers, Strategy, Companies, Demand, Insights, Size, Challenges, Value, Competition, Analysis, Growth, Revenue, Restraints, Forecast, Pricing, Outlook, Investment Opportunities
- China Thermally Conductive Filler Dispersants Market (2026-2032) | Restraints, Investment Opportunities, Pricing, Companies, Share, Size, Challenges, Trends, Outlook, Value, Analysis, Competition, Revenue, Drivers, Forecast, Demand, Insights, Growth, Strategy, segmentation
- Chile Thermally Conductive Filler Dispersants Market (2026-2032) | Investment Opportunities, Trends, Value, Restraints, Share, Companies, Forecast, segmentation, Pricing, Challenges, Demand, Size, Analysis, Drivers, Outlook, Growth, Competition, Strategy, Revenue, Insights
- Cambodia Thermally Conductive Filler Dispersants Market (2026-2032) | Analysis, Share, Outlook, Strategy, Pricing, Demand, Size, Growth, segmentation, Insights, Revenue, Forecast, Challenges, Competition, Companies, Investment Opportunities, Trends, Restraints, Value, Drivers
- Brazil Thermally Conductive Filler Dispersants Market (2026-2032) | Restraints, Forecast, Competition, Size, Revenue, Value, Investment Opportunities, Trends, Insights, Outlook, Growth, Analysis, Drivers, segmentation, Pricing, Challenges, Strategy, Share, Companies, Demand
- Bangladesh Thermally Conductive Filler Dispersants Market (2026-2032) | Restraints, Trends, Analysis, Competition, Insights, Forecast, Value, Investment Opportunities, Pricing, Share, Demand, Outlook, Revenue, segmentation, Companies, Drivers, Growth, Size, Challenges, Strategy
- Bahrain Thermally Conductive Filler Dispersants Market (2026-2032) | Trends, Outlook, Pricing, Demand, Value, Competition, Forecast, Growth, segmentation, Revenue, Companies, Analysis, Insights, Size, Drivers, Challenges, Strategy, Investment Opportunities, Share, Restraints
Industry Events and Analyst Meet

HIMTEX 2026

India Refining Summit 2026

India EV Show 2026

EV tech India Expo 2026

Auto Tech Asia 2026
Whitepaper
- Middle East & Africa Commercial Security Market Click here to view more.
- Middle East & Africa Fire Safety Systems & Equipment Market Click here to view more.
- GCC Drone Market Click here to view more.
- Middle East Lighting Fixture Market Click here to view more.
- GCC Physical & Perimeter Security Market Click here to view more.
6WResearch In News
- Doha a strategic location for EV manufacturing hub: IPA Qatar
- Demand for luxury TVs surging in the GCC, says Samsung
- Empowering Growth: The Thriving Journey of Bangladesh’s Cable Industry
- Demand for luxury TVs surging in the GCC, says Samsung
- Video call with a traditional healer? Once unthinkable, it’s now common in South Africa
- Intelligent Buildings To Smooth GCC’s Path To Net Zero