Croatia Soup Market (2026-2032) | Competitive Landscape, Outlook, Industry, Trends, Companies, Value, Analysis, Size & Revenue, Forecast, Segmentation, Growth, Share
Market Forecast By Category (Vegetarian Soup, Non-Vegetarian Soup), By Type (Dehydrated, Instant, Canned/Preserved, Chilled, Frozen, UHT, Others), By Packaging (Canned, Pouch, Other), By Distribution Channels (Supermarket/Hypermarkets, Convenience Stores, Online Retail Stores, Others) And Competitive Landscape
| Product Code: ETC6862137 | Publication Date: Sep 2024 | Updated Date: Apr 2026 | Product Type: Market Research Report | |
| Publisher: 6Wresearch | Author: Summon Dutta | No. of Pages: 75 | No. of Figures: 35 | No. of Tables: 20 |
Croatia Soup Market Size (2020-2030)
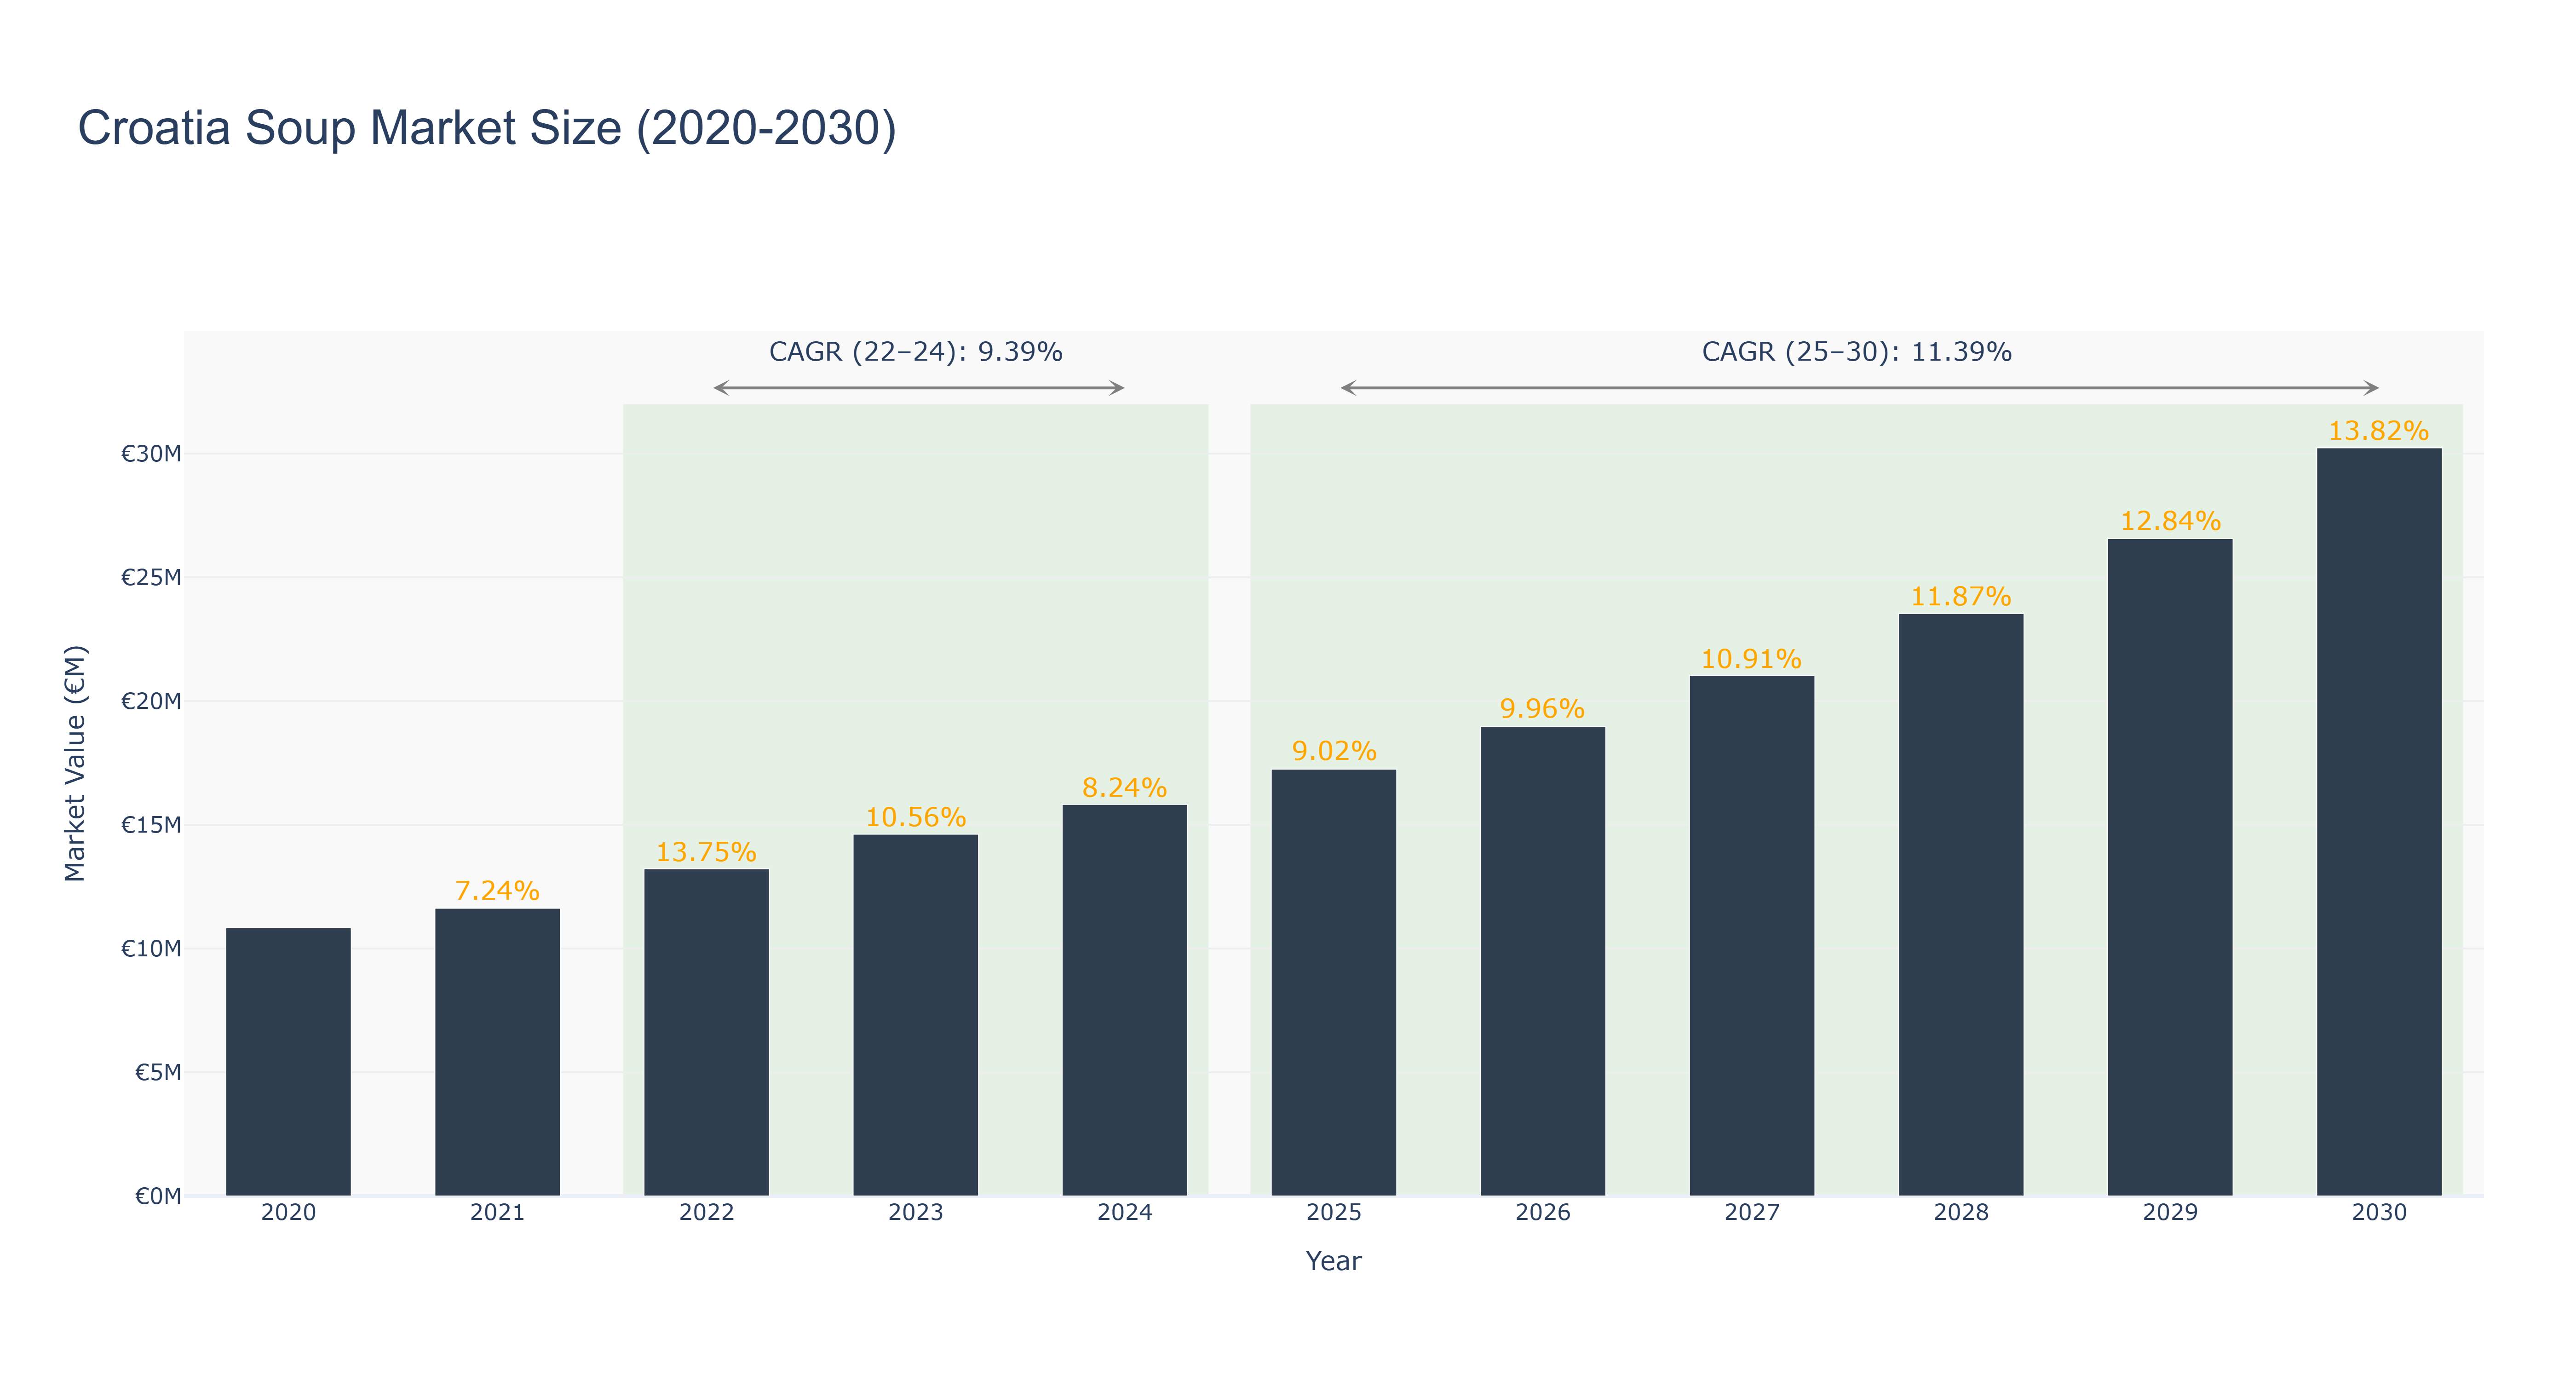
Croatia Soup Market has shown a steady growth trajectory over the years. The peak market size of €30.23 million is forecasted for 2030, with a notable increase in market size from 2020 to 2024, reaching €15.82 million in 2024. The CAGR from 2022 to 2024 is at 9.39%, while the CAGR from 2025 to 2030 is projected to be 11.39%. The market's growth can be attributed to factors such as changing consumer preferences towards healthier food options and the increasing demand for convenience foods. Recent developments in the market include the introduction of new product variants catering to diverse consumer tastes, along with plans for sustainable packaging solutions to align with environmental concerns. As the market continues to evolve, strategic partnerships with local suppliers and innovative marketing strategies are expected to drive further growth in the Croatia Soup Market.
Croatia Soup Market: Production & Trade Performance (2019-2025)
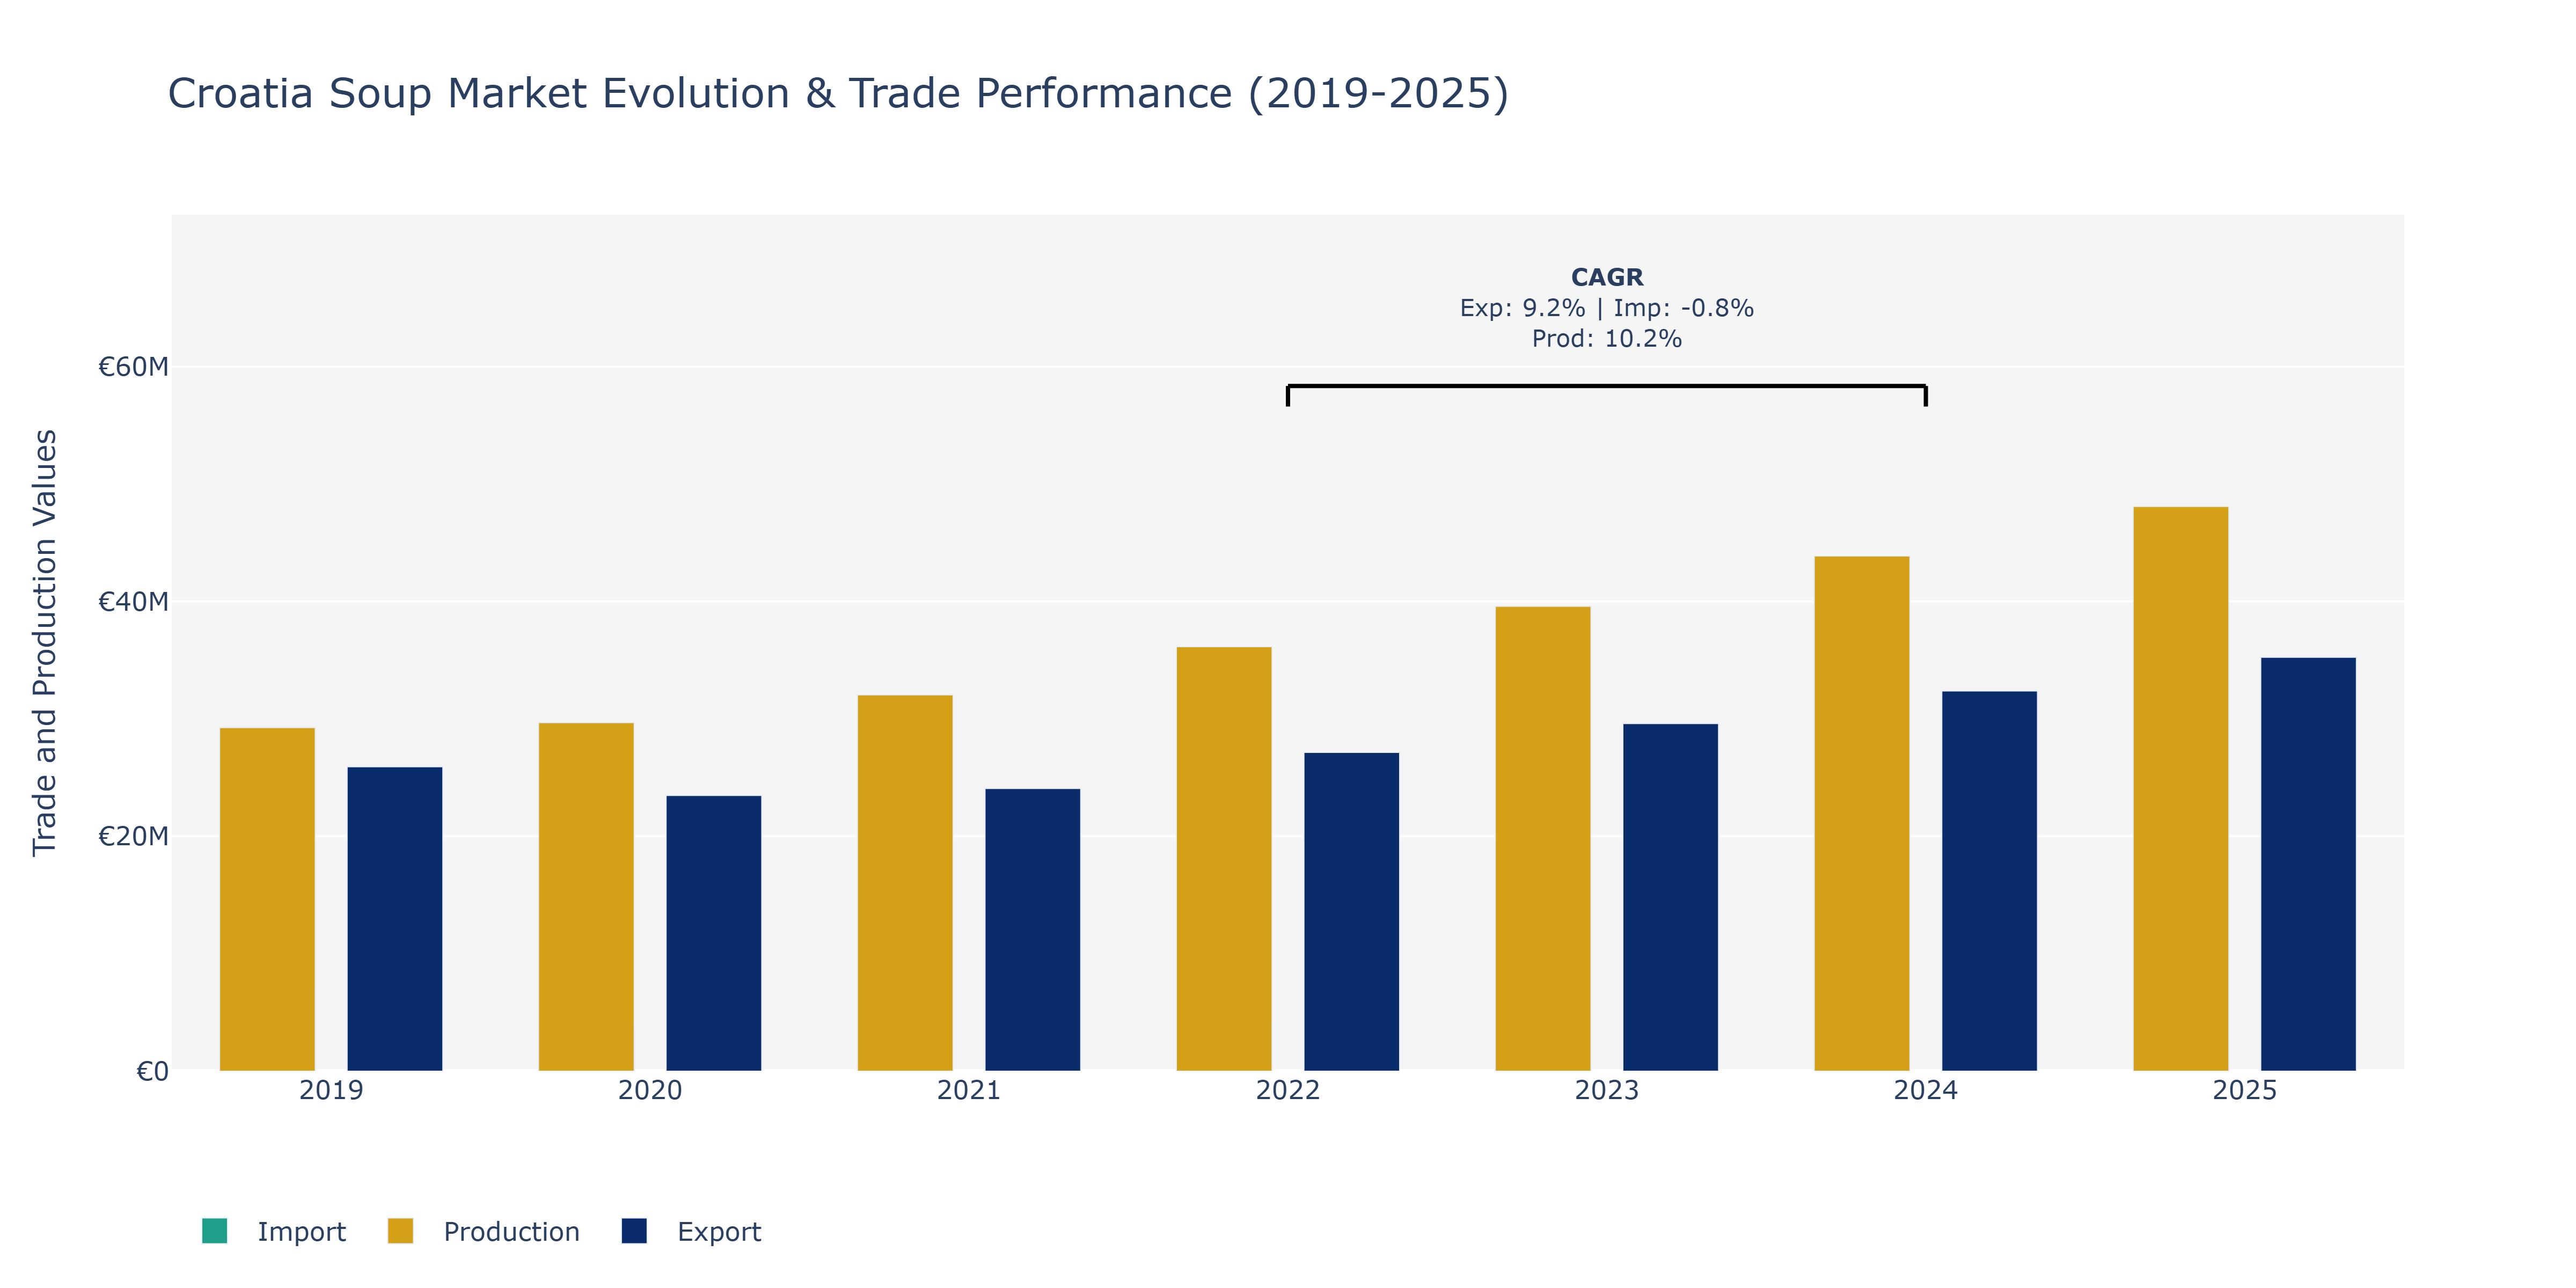
Between 2019 and 2025, Croatia's Soup Market witnessed notable shifts in exports, imports, and production. In 2019, exports stood at €25.93 million, gradually declining to €23.48 million in 2020 but resurging to €35.25 million by 2025, showing a clear upward trajectory. Conversely, imports fluctuated, decreasing from €6.4 million in 2019 to €3.71 million in 2020, then stabilizing around €4 billion annually from 2022 to 2025 with minor fluctuations. Production consistently increased from €29.27 million in 2019 to €48.09 million in 2025, reflecting steady growth. These trends may be attributed to Croatia's efforts to expand its soup market through improved production processes, international trade agreements boosting exports, and shifts in consumer preferences towards convenience foods. The country's focus on enhancing product quality and diversifying flavor profiles likely contributed to the market's overall positive performance.
Key Highlights of the Report:
- Croatia Soup Market Outlook
- Market Size of Croatia Soup Market, 2025
- Forecast of Croatia Soup Market, 2032
- Historical Data and Forecast of Croatia Soup Revenues & Volume for the Period 2022 - 2032
- Croatia Soup Market Trend Evolution
- Croatia Soup Market Drivers and Challenges
- Croatia Soup Price Trends
- Croatia Soup Porter's Five Forces
- Croatia Soup Industry Life Cycle
- Historical Data and Forecast of Croatia Soup Market Revenues & Volume By Category for the Period 2022 - 2032
- Historical Data and Forecast of Croatia Soup Market Revenues & Volume By Vegetarian Soup for the Period 2022 - 2032
- Historical Data and Forecast of Croatia Soup Market Revenues & Volume By Non-Vegetarian Soup for the Period 2022 - 2032
- Historical Data and Forecast of Croatia Soup Market Revenues & Volume By Type for the Period 2022 - 2032
- Historical Data and Forecast of Croatia Soup Market Revenues & Volume By Dehydrated for the Period 2022 - 2032
- Historical Data and Forecast of Croatia Soup Market Revenues & Volume By Instant for the Period 2022 - 2032
- Historical Data and Forecast of Croatia Soup Market Revenues & Volume By Canned/Preserved for the Period 2022 - 2032
- Historical Data and Forecast of Croatia Soup Market Revenues & Volume By Chilled for the Period 2022 - 2032
- Historical Data and Forecast of Croatia Soup Market Revenues & Volume By Frozen for the Period 2022 - 2032
- Historical Data and Forecast of Croatia Soup Market Revenues & Volume By UHT for the Period 2022 - 2032
- Historical Data and Forecast of Croatia Soup Market Revenues & Volume By Others for the Period 2022 - 2032
- Historical Data and Forecast of Croatia Soup Market Revenues & Volume By Packaging for the Period 2022 - 2032
- Historical Data and Forecast of Croatia Soup Market Revenues & Volume By Canned for the Period 2022 - 2032
- Historical Data and Forecast of Croatia Soup Market Revenues & Volume By Pouch for the Period 2022 - 2032
- Historical Data and Forecast of Croatia Soup Market Revenues & Volume By Other for the Period 2022 - 2032
- Historical Data and Forecast of Croatia Soup Market Revenues & Volume By Distribution Channels for the Period 2022 - 2032
- Historical Data and Forecast of Croatia Soup Market Revenues & Volume By Supermarket/Hypermarkets for the Period 2022 - 2032
- Historical Data and Forecast of Croatia Soup Market Revenues & Volume By Convenience Stores for the Period 2022 - 2032
- Historical Data and Forecast of Croatia Soup Market Revenues & Volume By Online Retail Stores for the Period 2022 - 2032
- Historical Data and Forecast of Croatia Soup Market Revenues & Volume By Others for the Period 2022 - 2032
- Croatia Soup Import Export Trade Statistics
- Market Opportunity Assessment By Category
- Market Opportunity Assessment By Type
- Market Opportunity Assessment By Packaging
- Market Opportunity Assessment By Distribution Channels
- Croatia Soup Top Companies Market Share
- Croatia Soup Competitive Benchmarking By Technical and Operational Parameters
- Croatia Soup Company Profiles
- Croatia Soup Key Strategic Recommendations
Frequently Asked Questions About the Market Study (FAQs):
6Wresearch actively monitors the Croatia Soup Market and publishes its comprehensive annual report, highlighting emerging trends, growth drivers, revenue analysis, and forecast outlook. Our insights help businesses to make data-backed strategic decisions with ongoing market dynamics. Our analysts track relevent industries related to the Croatia Soup Market, allowing our clients with actionable intelligence and reliable forecasts tailored to emerging regional needs.
Yes, we provide customisation as per your requirements. To learn more, feel free to contact us on sales@6wresearch.com
1 Executive Summary |
2 Introduction |
2.1 Key Highlights of the Report |
2.2 Report Description |
2.3 Market Scope & Segmentation |
2.4 Research Methodology |
2.5 Assumptions |
3 Croatia Soup Market Overview |
3.1 Croatia Country Macro Economic Indicators |
3.2 Croatia Soup Market Revenues & Volume, 2022 & 2032F |
3.3 Croatia Soup Market - Industry Life Cycle |
3.4 Croatia Soup Market - Porter's Five Forces |
3.5 Croatia Soup Market Revenues & Volume Share, By Category, 2022 & 2032F |
3.6 Croatia Soup Market Revenues & Volume Share, By Type, 2022 & 2032F |
3.7 Croatia Soup Market Revenues & Volume Share, By Packaging, 2022 & 2032F |
3.8 Croatia Soup Market Revenues & Volume Share, By Distribution Channels, 2022 & 2032F |
4 Croatia Soup Market Dynamics |
4.1 Impact Analysis |
4.2 Market Drivers |
4.2.1 Increasing consumer awareness about health benefits of soups as a nutritious meal option |
4.2.2 Growing demand for convenience foods due to busy lifestyles |
4.2.3 Rising popularity of ethnic and exotic flavors in the food industry |
4.3 Market Restraints |
4.3.1 Seasonal demand fluctuations impacting sales |
4.3.2 Competition from other ready-to-eat meal options like frozen foods |
4.3.3 Price sensitivity of consumers influencing purchase decisions |
5 Croatia Soup Market Trends |
6 Croatia Soup Market, By Types |
6.1 Croatia Soup Market, By Category |
6.1.1 Overview and Analysis |
6.1.2 Croatia Soup Market Revenues & Volume, By Category, 2022 - 2032F |
6.1.3 Croatia Soup Market Revenues & Volume, By Vegetarian Soup, 2022 - 2032F |
6.1.4 Croatia Soup Market Revenues & Volume, By Non-Vegetarian Soup, 2022 - 2032F |
6.2 Croatia Soup Market, By Type |
6.2.1 Overview and Analysis |
6.2.2 Croatia Soup Market Revenues & Volume, By Dehydrated, 2022 - 2032F |
6.2.3 Croatia Soup Market Revenues & Volume, By Instant, 2022 - 2032F |
6.2.4 Croatia Soup Market Revenues & Volume, By Canned/Preserved, 2022 - 2032F |
6.2.5 Croatia Soup Market Revenues & Volume, By Chilled, 2022 - 2032F |
6.2.6 Croatia Soup Market Revenues & Volume, By Frozen, 2022 - 2032F |
6.2.7 Croatia Soup Market Revenues & Volume, By UHT, 2022 - 2032F |
6.3 Croatia Soup Market, By Packaging |
6.3.1 Overview and Analysis |
6.3.2 Croatia Soup Market Revenues & Volume, By Canned, 2022 - 2032F |
6.3.3 Croatia Soup Market Revenues & Volume, By Pouch, 2022 - 2032F |
6.3.4 Croatia Soup Market Revenues & Volume, By Other, 2022 - 2032F |
6.4 Croatia Soup Market, By Distribution Channels |
6.4.1 Overview and Analysis |
6.4.2 Croatia Soup Market Revenues & Volume, By Supermarket/Hypermarkets, 2022 - 2032F |
6.4.3 Croatia Soup Market Revenues & Volume, By Convenience Stores, 2022 - 2032F |
6.4.4 Croatia Soup Market Revenues & Volume, By Online Retail Stores, 2022 - 2032F |
6.4.5 Croatia Soup Market Revenues & Volume, By Others, 2022 - 2032F |
7 Croatia Soup Market Import-Export Trade Statistics |
7.1 Croatia Soup Market Export to Major Countries |
7.2 Croatia Soup Market Imports from Major Countries |
8 Croatia Soup Market Key Performance Indicators |
8.1 Consumer engagement on social media platforms for soup-related content |
8.2 Number of new product launches and innovations in the soup market |
8.3 Consumer satisfaction and loyalty metrics towards soup brands |
8.4 Trends in soup consumption patterns and preferences |
8.5 Adoption rate of online ordering and delivery services for soups |
9 Croatia Soup Market - Opportunity Assessment |
9.1 Croatia Soup Market Opportunity Assessment, By Category, 2022 & 2032F |
9.2 Croatia Soup Market Opportunity Assessment, By Type, 2022 & 2032F |
9.3 Croatia Soup Market Opportunity Assessment, By Packaging, 2022 & 2032F |
9.4 Croatia Soup Market Opportunity Assessment, By Distribution Channels, 2022 & 2032F |
10 Croatia Soup Market - Competitive Landscape |
10.1 Croatia Soup Market Revenue Share, By Companies, 2025 |
10.2 Croatia Soup Market Competitive Benchmarking, By Operating and Technical Parameters |
11 Company Profiles |
12 Recommendations |
13 Disclaimer |
Global Go To Market Strategy - 2030
Export potential enables firms to identify high-growth global markets with greater confidence by combining advanced trade intelligence with a structured quantitative methodology. The framework analyzes emerging demand trends and country-level import patterns while integrating macroeconomic and trade datasets such as GDP and population forecasts, bilateral import–export flows, tariff structures, elasticity differentials between developed and developing economies, geographic distance, and import demand projections. Using weighted trade values from 2020–2024 as the base period to project country-to-country export potential for 2030, these inputs are operationalized through calculated drivers such as gravity model parameters, tariff impact factors, and projected GDP per-capita growth. Through an analysis of hidden potentials, demand hotspots, and market conditions that are most favorable to success, this method enables firms to focus on target countries, maximize returns, and global expansion with data, backed by accuracy.
By factoring in the projected importer demand gap that is currently unmet and could be potential opportunity, it identifies the potential for the Exporter (Country) among 190 countries, against the general trade analysis, which identifies the biggest importer or exporter.
To discover high-growth global markets and optimize your business strategy:
Click Here
Pricing
- Single User License$ 1,995
- Department License$ 2,400
- Site License$ 3,120
- Global License$ 3,795

Leadership Perspectives from Industry Events
Search
Thought Leadership and Analyst Meet


Our Clients
6WResearch In News
- India Air Conditioner Market Set for Strong Rebound in 2026 After Weather-Led Correction and GST-Driven Recovery: 6Wresearch
- ADAS in India: How Automatic Emergency Braking, Blind Spot Detection & Driver Monitoring are Transforming Road Safety
- Doha a strategic location for EV manufacturing hub: IPA Qatar
- Demand for luxury TVs surging in the GCC, says Samsung
- Empowering Growth: The Thriving Journey of Bangladesh’s Cable Industry
- Demand for luxury TVs surging in the GCC, says Samsung
Latest Reports
- Poland Fire Protection Systems Market (2026-2032)
- Cape Verde Portable Hand-Thrown Extinguisher Market (2026-2032)
- Canada Portable Hand-Thrown Extinguisher Market (2026-2032)
- Cameroon Portable Hand-Thrown Extinguisher Market (2026-2032)
- Burundi Portable Hand-Thrown Extinguisher Market (2026-2032)
- Burkina Faso Portable Hand-Thrown Extinguisher Market (2026-2032)
- Bulgaria Portable Hand-Thrown Extinguisher Market (2026-2032)
- Brunei Portable Hand-Thrown Extinguisher Market (2026-2032)
- Botswana Portable Hand-Thrown Extinguisher Market (2026-2032)
- Bosnia and Herzegovina Portable Hand-Thrown Extinguisher Market (2026-2032)
Industry Events and Analyst Meet

HIMTEX 2026

India Refining Summit 2026

India EV Show 2026

EV tech India Expo 2026

Auto Tech Asia 2026
Whitepaper
- Middle East & Africa Commercial Security Market Click here to view more.
- Middle East & Africa Fire Safety Systems & Equipment Market Click here to view more.
- GCC Drone Market Click here to view more.
- Middle East Lighting Fixture Market Click here to view more.
- GCC Physical & Perimeter Security Market Click here to view more.