Croatia Synthetic Tannins Market (2026-2032) | Trends, Value, Competitive Landscape, Companies, Outlook, Forecast, Share, Industry, Growth, Analysis, Segmentation, Size & Revenue
Market Forecast By Type (Hydrolyzable, Condensed), By Application (Pharmaceutical Industry, Food Industry, Paper Industry, Textile Industry, Others) And Competitive Landscape
| Product Code: ETC6862985 | Publication Date: Sep 2024 | Updated Date: Apr 2026 | Product Type: Market Research Report | |
| Publisher: 6Wresearch | Author: Dhaval Chaurasia | No. of Pages: 75 | No. of Figures: 35 | No. of Tables: 20 |
Croatia Synthetic Tannins Market Size (2020-2030)
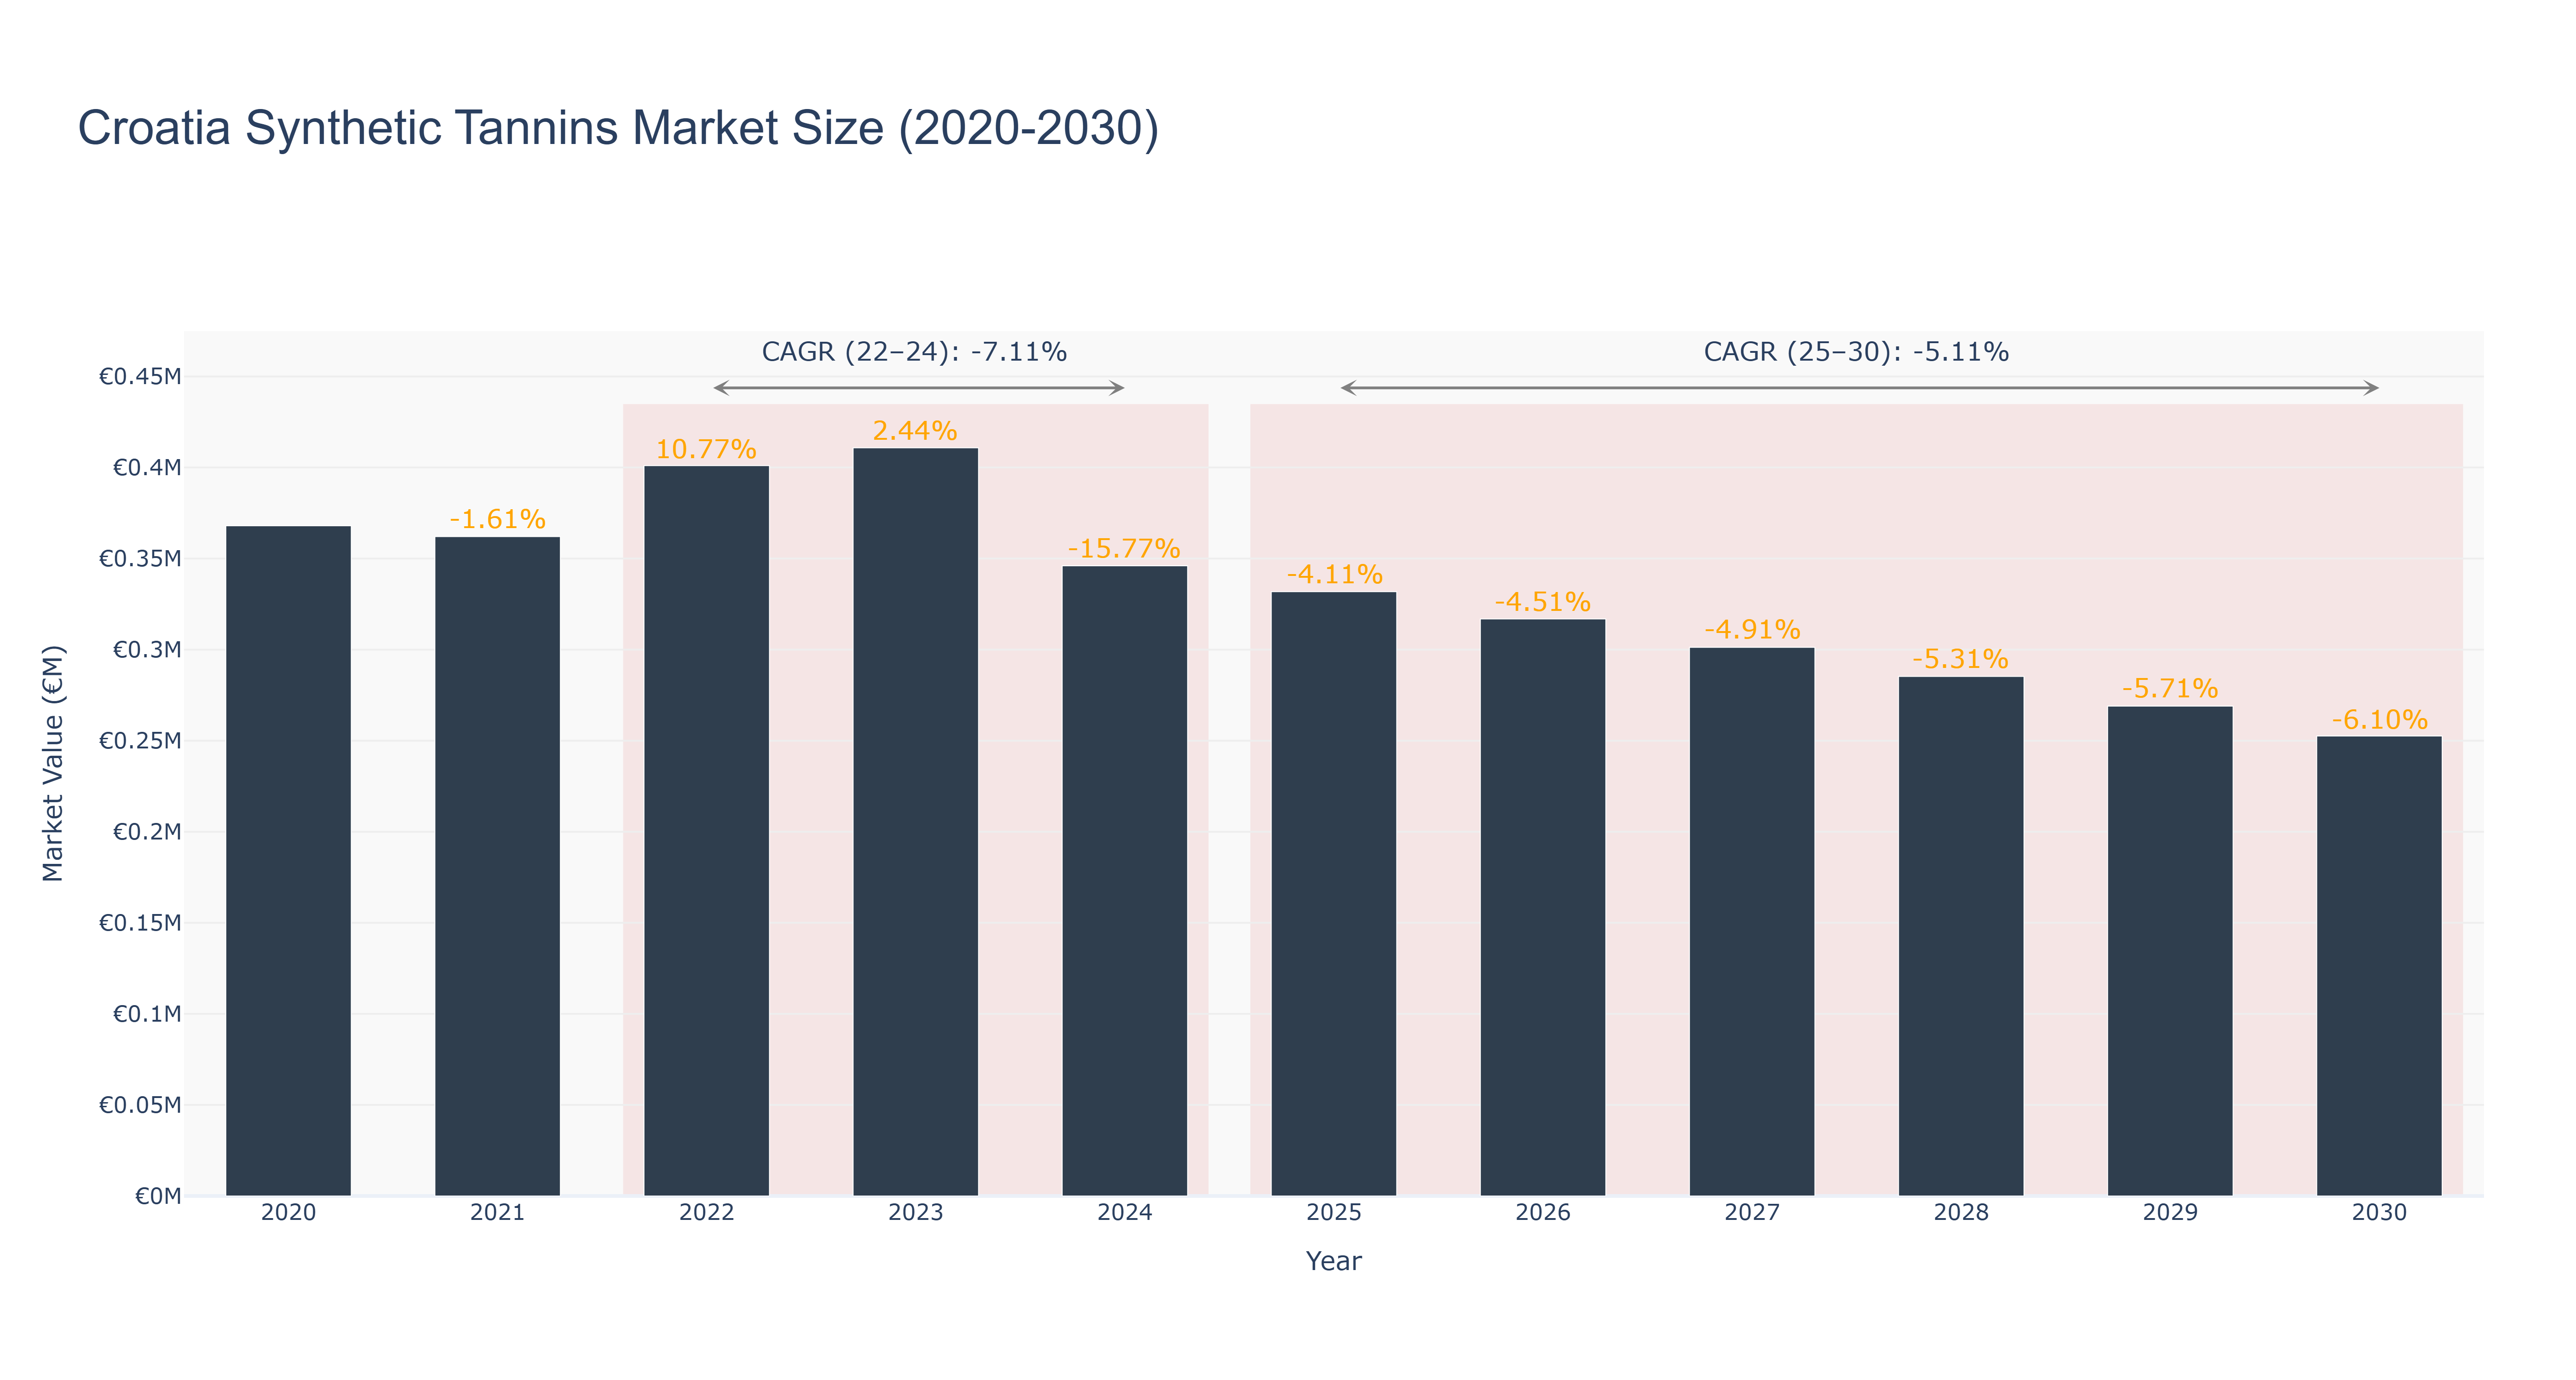
The Croatia Synthetic Tannins Market witnessed a peak market size of €0.41 million in 2023, followed by a decline to €0.25 million in 2030. From 2020 to 2024, the market size decreased steadily, attributed to factors like economic downturns impacting the demand for synthetic tannins. The forecasted market size from 2025 to 2030 is expected to continue the downward trend with a CAGR of -5.11%. The market's CAGR from 2022 to 2024 was -7.11%, indicating a significant contraction during that period. Looking ahead, industry drivers such as increasing environmental regulations promoting sustainable alternatives may influence the market. Recent developments in Croatia's chemical industry, focusing on eco-friendly tanning solutions, are poised to shape the future landscape of the synthetic tannins market in the country.
Croatia Synthetic Tannins Market: Production & Trade Performance (2019-2025)
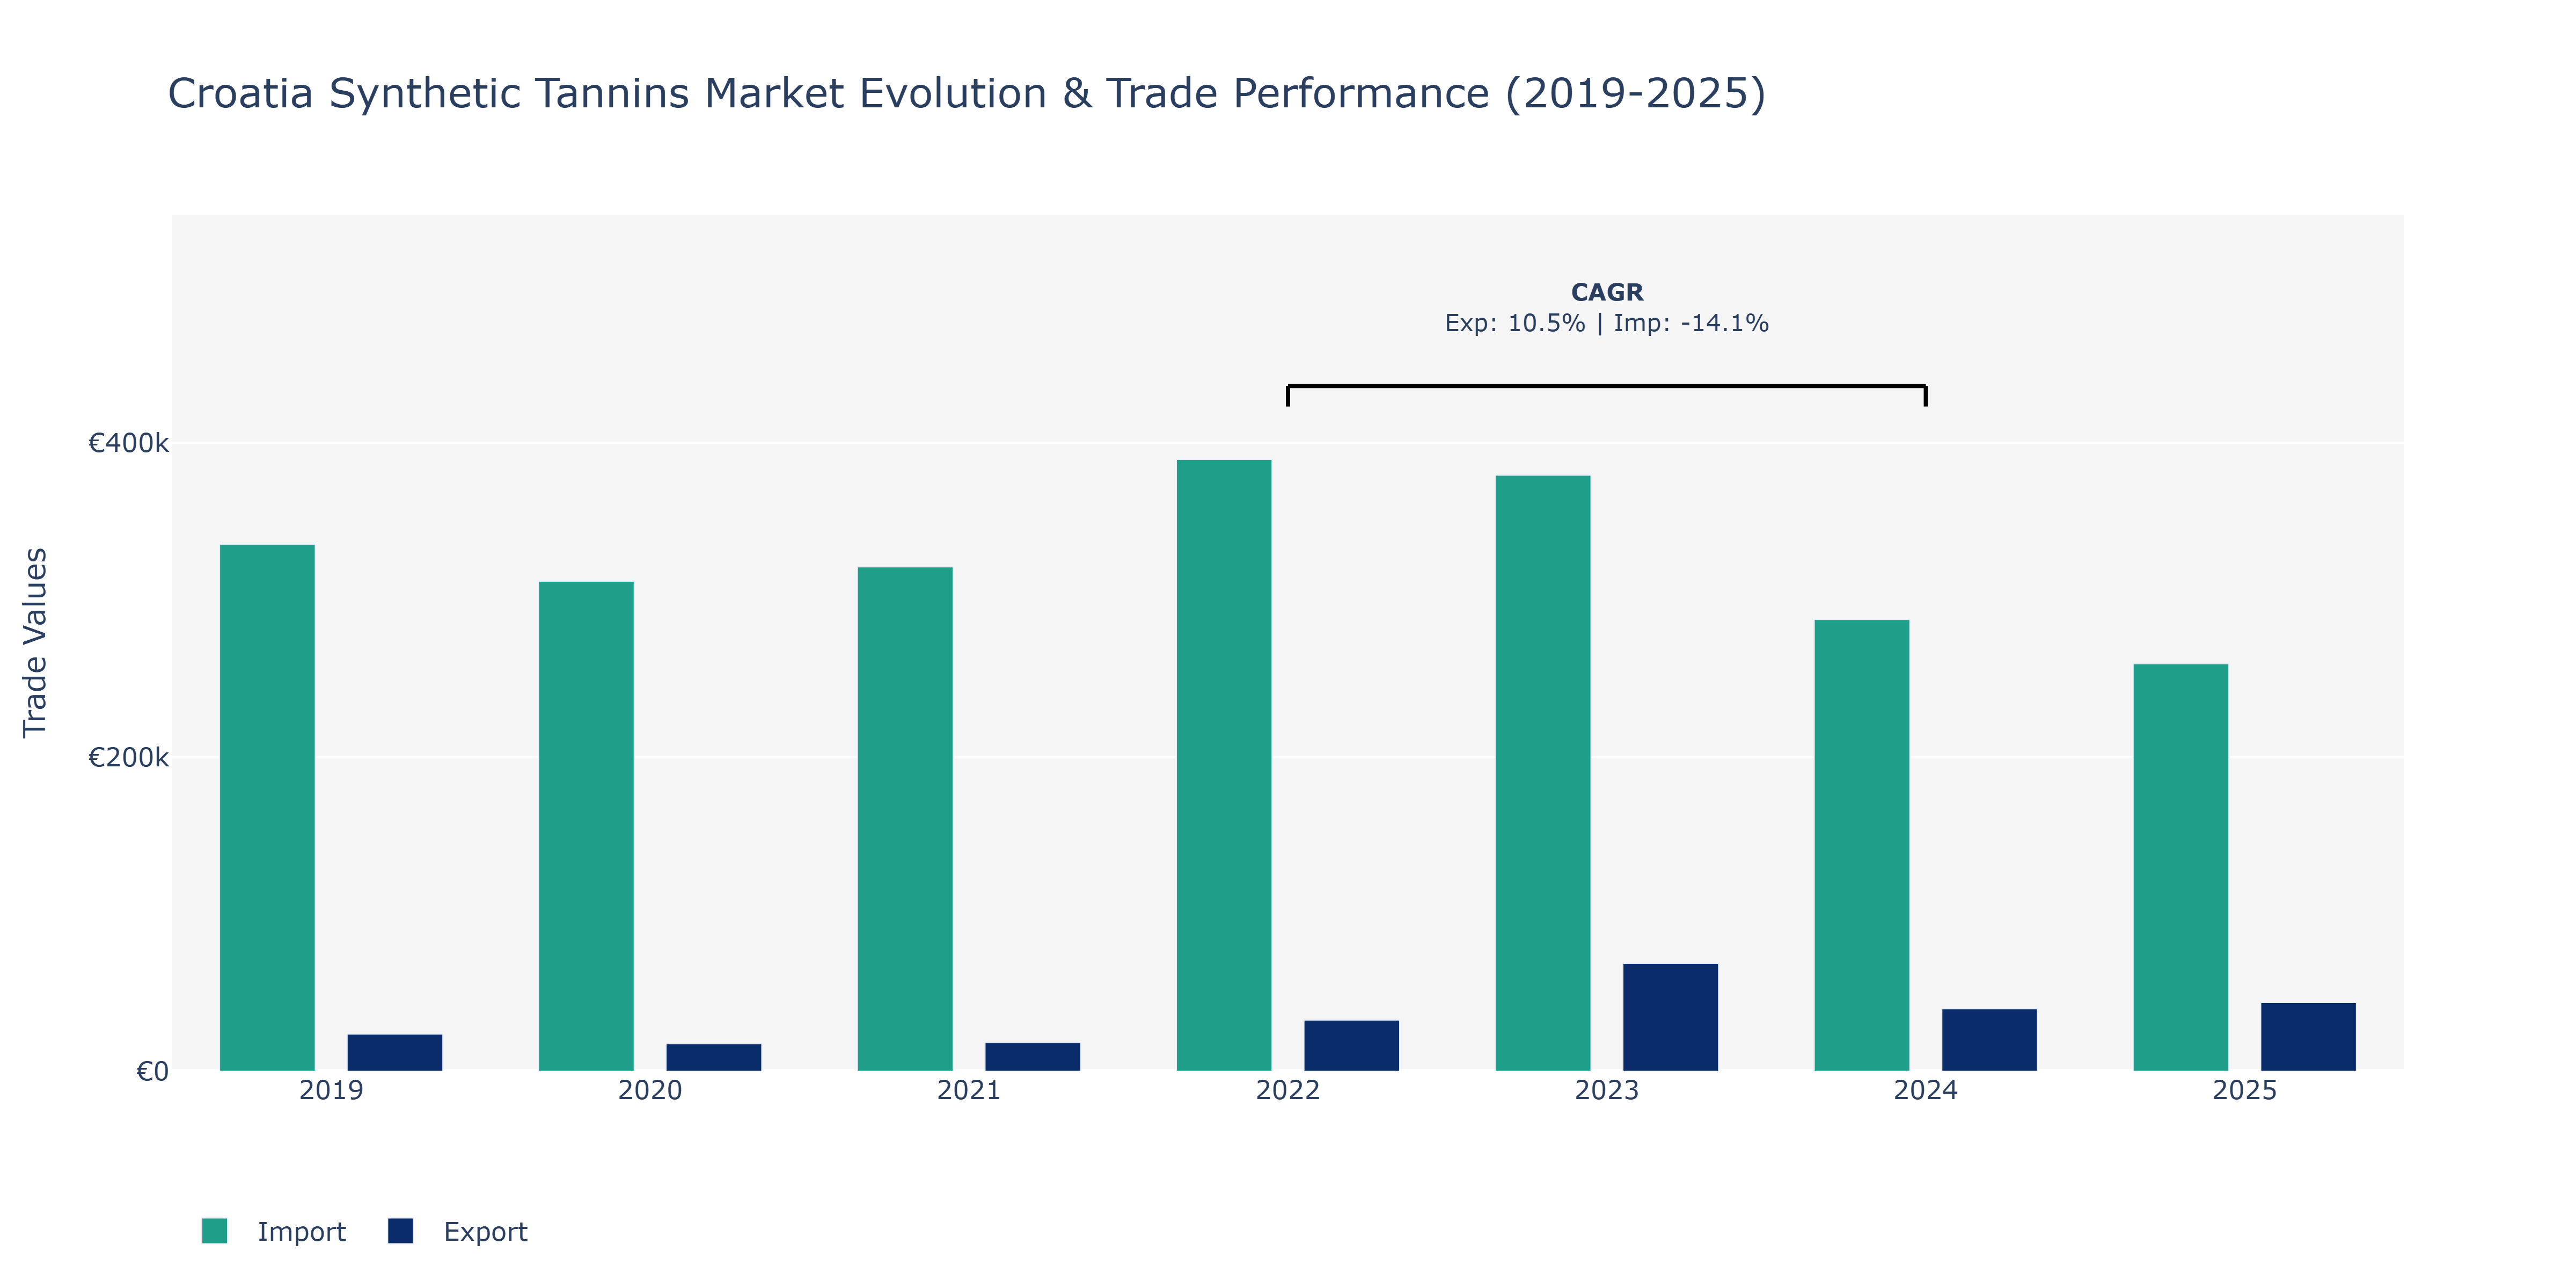
Between 2019 and 2025, Croatia's Synthetic Tannins Market witnessed fluctuations in both Exports and Imports. Exports experienced a notable peak in 2023 at around €68.7 thousand, showcasing a significant surge from the previous years. In contrast, Imports peaked in 2019 at approximately €335.59 thousand before exhibiting a declining trend, reaching about €259.5 thousand in 2025. The drop in Imports could be attributed to evolving consumer preferences, leading to a shift towards locally sourced materials or alternative solutions. The fluctuations in Exports may be tied to global demand dynamics and competitive pricing strategies. These observations suggest a need for market participants to adapt to changing market conditions by enhancing product quality, exploring new export markets, and optimizing supply chain efficiency to maintain competitiveness in the Synthetic Tannins industry.
Key Highlights of the Report:
- Croatia Synthetic Tannins Market Outlook
- Market Size of Croatia Synthetic Tannins Market, 2025
- Forecast of Croatia Synthetic Tannins Market, 2032
- Historical Data and Forecast of Croatia Synthetic Tannins Revenues & Volume for the Period 2022 - 2032
- Croatia Synthetic Tannins Market Trend Evolution
- Croatia Synthetic Tannins Market Drivers and Challenges
- Croatia Synthetic Tannins Price Trends
- Croatia Synthetic Tannins Porter's Five Forces
- Croatia Synthetic Tannins Industry Life Cycle
- Historical Data and Forecast of Croatia Synthetic Tannins Market Revenues & Volume By Type for the Period 2022 - 2032
- Historical Data and Forecast of Croatia Synthetic Tannins Market Revenues & Volume By Hydrolyzable for the Period 2022 - 2032
- Historical Data and Forecast of Croatia Synthetic Tannins Market Revenues & Volume By Condensed for the Period 2022 - 2032
- Historical Data and Forecast of Croatia Synthetic Tannins Market Revenues & Volume By Application for the Period 2022 - 2032
- Historical Data and Forecast of Croatia Synthetic Tannins Market Revenues & Volume By Pharmaceutical Industry for the Period 2022 - 2032
- Historical Data and Forecast of Croatia Synthetic Tannins Market Revenues & Volume By Food Industry for the Period 2022 - 2032
- Historical Data and Forecast of Croatia Synthetic Tannins Market Revenues & Volume By Paper Industry for the Period 2022 - 2032
- Historical Data and Forecast of Croatia Synthetic Tannins Market Revenues & Volume By Textile Industry for the Period 2022 - 2032
- Historical Data and Forecast of Croatia Synthetic Tannins Market Revenues & Volume By Others for the Period 2022 - 2032
- Croatia Synthetic Tannins Import Export Trade Statistics
- Market Opportunity Assessment By Type
- Market Opportunity Assessment By Application
- Croatia Synthetic Tannins Top Companies Market Share
- Croatia Synthetic Tannins Competitive Benchmarking By Technical and Operational Parameters
- Croatia Synthetic Tannins Company Profiles
- Croatia Synthetic Tannins Key Strategic Recommendations
Frequently Asked Questions About the Market Study (FAQs):
6Wresearch actively monitors the Croatia Synthetic Tannins Market and publishes its comprehensive annual report, highlighting emerging trends, growth drivers, revenue analysis, and forecast outlook. Our insights help businesses to make data-backed strategic decisions with ongoing market dynamics. Our analysts track relevent industries related to the Croatia Synthetic Tannins Market, allowing our clients with actionable intelligence and reliable forecasts tailored to emerging regional needs.
Yes, we provide customisation as per your requirements. To learn more, feel free to contact us on sales@6wresearch.com
1 Executive Summary |
2 Introduction |
2.1 Key Highlights of the Report |
2.2 Report Description |
2.3 Market Scope & Segmentation |
2.4 Research Methodology |
2.5 Assumptions |
3 Croatia Synthetic Tannins Market Overview |
3.1 Croatia Country Macro Economic Indicators |
3.2 Croatia Synthetic Tannins Market Revenues & Volume, 2022 & 2032F |
3.3 Croatia Synthetic Tannins Market - Industry Life Cycle |
3.4 Croatia Synthetic Tannins Market - Porter's Five Forces |
3.5 Croatia Synthetic Tannins Market Revenues & Volume Share, By Type, 2022 & 2032F |
3.6 Croatia Synthetic Tannins Market Revenues & Volume Share, By Application, 2022 & 2032F |
4 Croatia Synthetic Tannins Market Dynamics |
4.1 Impact Analysis |
4.2 Market Drivers |
4.2.1 Increasing demand for synthetic tannins in the food and beverage industry for flavor enhancement and color stabilization. |
4.2.2 Growing adoption of synthetic tannins in the pharmaceutical sector for their medicinal properties. |
4.2.3 Rising awareness about the benefits of synthetic tannins in the cosmetics industry for skin care products. |
4.3 Market Restraints |
4.3.1 Stringent regulations regarding the usage of synthetic tannins in certain applications. |
4.3.2 Fluctuating prices of raw materials used in the production of synthetic tannins. |
5 Croatia Synthetic Tannins Market Trends |
6 Croatia Synthetic Tannins Market, By Types |
6.1 Croatia Synthetic Tannins Market, By Type |
6.1.1 Overview and Analysis |
6.1.2 Croatia Synthetic Tannins Market Revenues & Volume, By Type, 2022 - 2032F |
6.1.3 Croatia Synthetic Tannins Market Revenues & Volume, By Hydrolyzable, 2022 - 2032F |
6.1.4 Croatia Synthetic Tannins Market Revenues & Volume, By Condensed, 2022 - 2032F |
6.2 Croatia Synthetic Tannins Market, By Application |
6.2.1 Overview and Analysis |
6.2.2 Croatia Synthetic Tannins Market Revenues & Volume, By Pharmaceutical Industry, 2022 - 2032F |
6.2.3 Croatia Synthetic Tannins Market Revenues & Volume, By Food Industry, 2022 - 2032F |
6.2.4 Croatia Synthetic Tannins Market Revenues & Volume, By Paper Industry, 2022 - 2032F |
6.2.5 Croatia Synthetic Tannins Market Revenues & Volume, By Textile Industry, 2022 - 2032F |
6.2.6 Croatia Synthetic Tannins Market Revenues & Volume, By Others, 2022 - 2032F |
7 Croatia Synthetic Tannins Market Import-Export Trade Statistics |
7.1 Croatia Synthetic Tannins Market Export to Major Countries |
7.2 Croatia Synthetic Tannins Market Imports from Major Countries |
8 Croatia Synthetic Tannins Market Key Performance Indicators |
8.1 Research and development investment in new applications of synthetic tannins. |
8.2 Number of patents filed for innovative synthetic tannin formulations. |
8.3 Adoption rate of synthetic tannins in emerging industries. |
9 Croatia Synthetic Tannins Market - Opportunity Assessment |
9.1 Croatia Synthetic Tannins Market Opportunity Assessment, By Type, 2022 & 2032F |
9.2 Croatia Synthetic Tannins Market Opportunity Assessment, By Application, 2022 & 2032F |
10 Croatia Synthetic Tannins Market - Competitive Landscape |
10.1 Croatia Synthetic Tannins Market Revenue Share, By Companies, 2025 |
10.2 Croatia Synthetic Tannins Market Competitive Benchmarking, By Operating and Technical Parameters |
11 Company Profiles |
12 Recommendations |
13 Disclaimer |
Export potential assessment - trade Analytics for 2030
Export potential enables firms to identify high-growth global markets with greater confidence by combining advanced trade intelligence with a structured quantitative methodology. The framework analyzes emerging demand trends and country-level import patterns while integrating macroeconomic and trade datasets such as GDP and population forecasts, bilateral import–export flows, tariff structures, elasticity differentials between developed and developing economies, geographic distance, and import demand projections. Using weighted trade values from 2020–2024 as the base period to project country-to-country export potential for 2030, these inputs are operationalized through calculated drivers such as gravity model parameters, tariff impact factors, and projected GDP per-capita growth. Through an analysis of hidden potentials, demand hotspots, and market conditions that are most favorable to success, this method enables firms to focus on target countries, maximize returns, and global expansion with data, backed by accuracy.
By factoring in the projected importer demand gap that is currently unmet and could be potential opportunity, it identifies the potential for the Exporter (Country) among 190 countries, against the general trade analysis, which identifies the biggest importer or exporter.
To discover high-growth global markets and optimize your business strategy:
Click Here
Pricing
- Single User License$ 1,995
- Department License$ 2,400
- Site License$ 3,120
- Global License$ 3,795

Search
Thought Leadership and Analyst Meet


Our Clients
Latest Reports
- China Electric Appliance Rental Market (2026-2032) | Trends, Revenue, Growth, Challenges, Size, Value, Outlook, Pricing, Strategy, Insights, Restraints, segmentation, Companies, Investment Opportunities, Analysis, Demand, Drivers, Competition, Forecast, Share
- Chile Electric Appliance Rental Market (2026-2032) | Outlook, Competition, Drivers, Strategy, Revenue, Analysis, Value, Pricing, Restraints, Size, Demand, Share, Growth, Forecast, Challenges, Insights, Investment Opportunities, Companies, Trends, segmentation
- Cambodia Electric Appliance Rental Market (2026-2032) | Companies, Analysis, Restraints, Pricing, Insights, Challenges, Outlook, Strategy, Forecast, Trends, Competition, Value, Revenue, Investment Opportunities, segmentation, Drivers, Size, Demand, Growth, Share
- Brazil Electric Appliance Rental Market (2026-2032) | Revenue, Strategy, Forecast, Companies, segmentation, Competition, Size, Investment Opportunities, Pricing, Restraints, Outlook, Challenges, Analysis, Drivers, Value, Demand, Insights, Trends, Growth, Share
- Bangladesh Electric Appliance Rental Market (2026-2032) | Drivers, Forecast, Investment Opportunities, Strategy, Insights, Demand, Challenges, Outlook, Trends, Competition, Value, Revenue, Size, Pricing, Analysis, Companies, Restraints, segmentation, Share, Growth
- Bahrain Electric Appliance Rental Market (2026-2032) | Outlook, Size, Competition, Restraints, Drivers, Value, Trends, Investment Opportunities, Insights, Forecast, Revenue, Strategy, Growth, Share, Demand, Analysis, Challenges, Companies, segmentation, Pricing
- Azerbaijan Electric Appliance Rental Market (2026-2032) | Trends, Investment Opportunities, Restraints, Insights, Strategy, Competition, Value, Growth, Demand, Drivers, Analysis, Forecast, Size, Share, Outlook, segmentation, Pricing, Challenges, Revenue, Companies
- Australia Electric Appliance Rental Market (2026-2032) | Challenges, Restraints, Forecast, Demand, Size, Competition, Pricing, Investment Opportunities, Revenue, Trends, Drivers, Growth, Outlook, Analysis, Strategy, Value, segmentation, Insights, Companies, Share
- Argentina Electric Appliance Rental Market (2026-2032) | Growth, Trends, Insights, Outlook, Forecast, Size, Drivers, Analysis, Restraints, Challenges, Share, Revenue, Investment Opportunities, Strategy, Demand, Value, Companies, segmentation, Competition, Pricing
- Algeria Electric Appliance Rental Market (2026-2032) | Share, Size, Value, Strategy, Competition, Outlook, Challenges, Companies, Trends, Pricing, Insights, Forecast, Investment Opportunities, Revenue, Growth, Restraints, segmentation, Analysis, Demand, Drivers
Industry Events and Analyst Meet

HIMTEX 2026

India Refining Summit 2026

India EV Show 2026

EV tech India Expo 2026

Auto Tech Asia 2026
Whitepaper
- Middle East & Africa Commercial Security Market Click here to view more.
- Middle East & Africa Fire Safety Systems & Equipment Market Click here to view more.
- GCC Drone Market Click here to view more.
- Middle East Lighting Fixture Market Click here to view more.
- GCC Physical & Perimeter Security Market Click here to view more.
6WResearch In News
- Doha a strategic location for EV manufacturing hub: IPA Qatar
- Demand for luxury TVs surging in the GCC, says Samsung
- Empowering Growth: The Thriving Journey of Bangladesh’s Cable Industry
- Demand for luxury TVs surging in the GCC, says Samsung
- Video call with a traditional healer? Once unthinkable, it’s now common in South Africa
- Intelligent Buildings To Smooth GCC’s Path To Net Zero