Croatia Table Butter Market (2025-2031) | Outlook, Segmentation, Forecast, Analysis, Competitive Landscape, Size & Revenue, Value, Trends, Growth, Industry, Share, Companies
Market Forecast By Type (Organic, Non-Organic), By Application (Household, Bakery, Other) And Competitive Landscape
| Product Code: ETC6863033 | Publication Date: Sep 2024 | Updated Date: Oct 2025 | Product Type: Market Research Report | |
| Publisher: 6Wresearch | Author: Ravi Bhandari | No. of Pages: 75 | No. of Figures: 35 | No. of Tables: 20 |
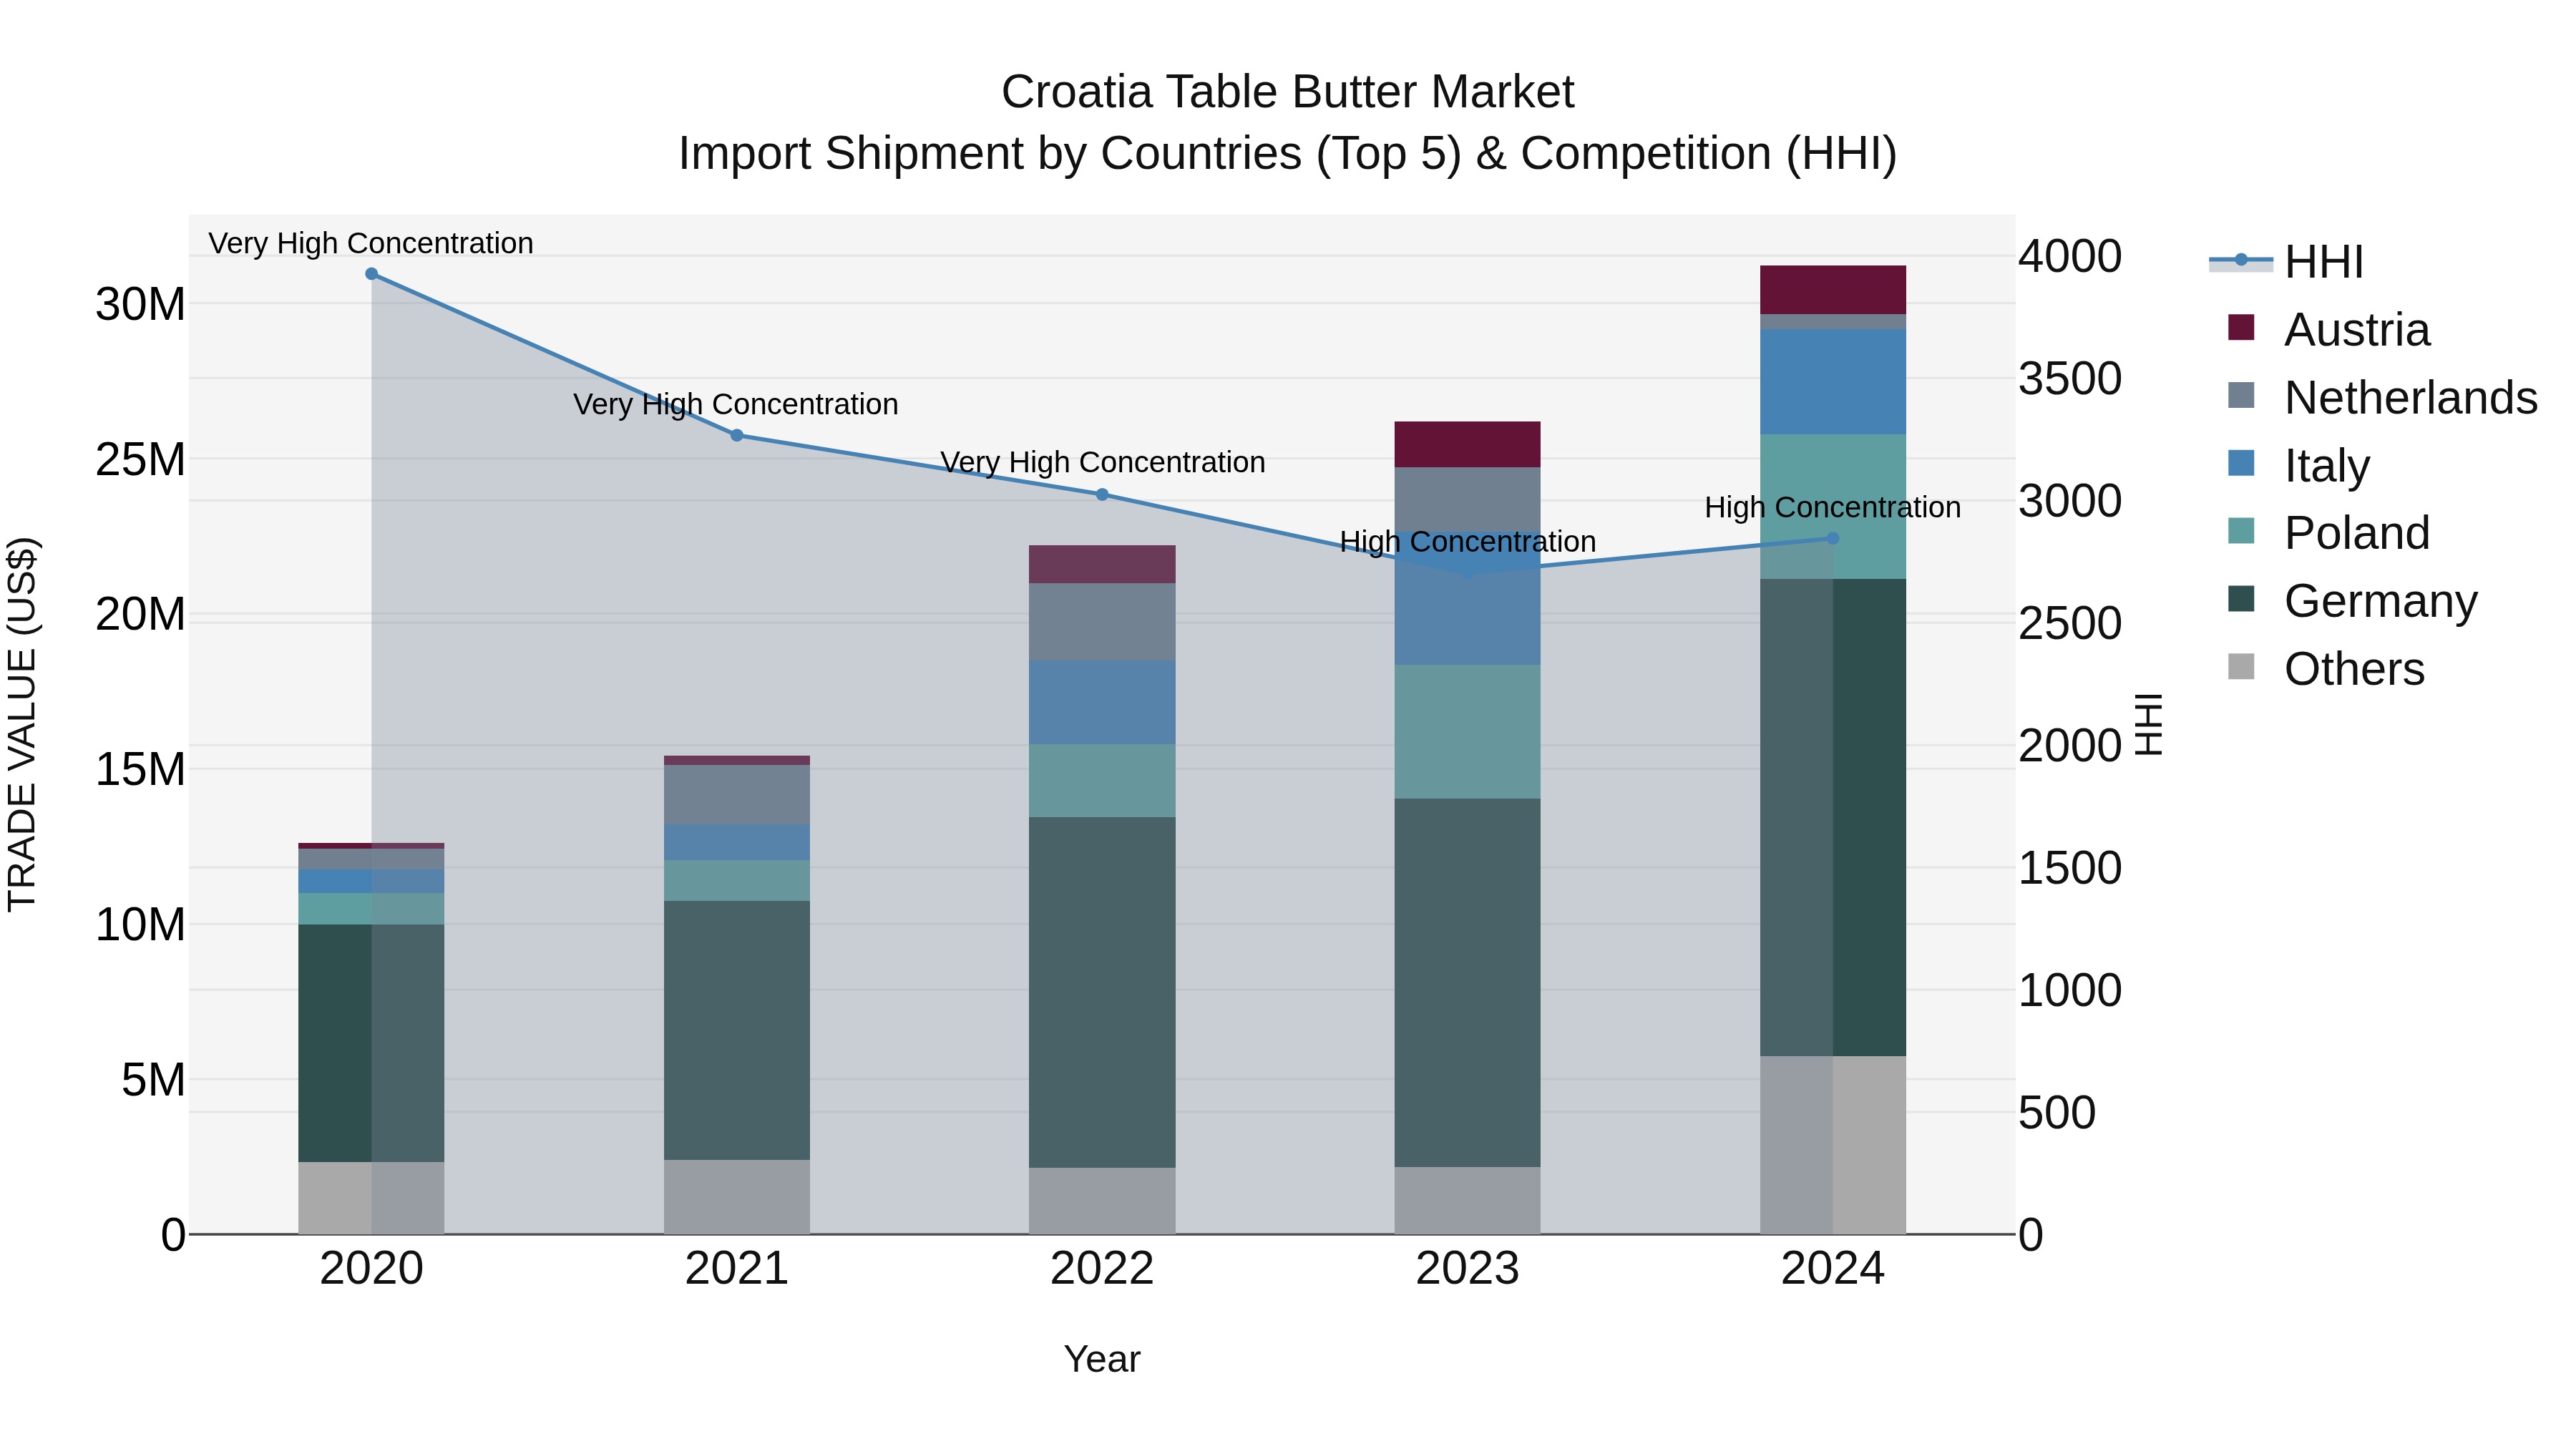
Croatia Table Butter Market Top 5 Importing Countries and Market Competition (HHI) Analysis
In 2024, Croatia saw a notable increase in table butter import shipments with top exporting countries being Germany, Poland, Italy, Austria, and Metropolitan France. The market remained highly concentrated, as indicated by the high Herfindahl-Hirschman Index (HHI). The compound annual growth rate (CAGR) from 2020 to 2024 was impressive at 25.42%, reflecting a robust expansion in the market. Moreover, the growth rate from 2023 to 2024 reached 19.18%, suggesting continued momentum in the import of table butter into Croatia. This data indicates a thriving market for table butter imports in the country.
Croatia Table Butter Market Synopsis
The Croatia Table Butter Market is a dynamic and competitive industry characterized by a growing demand for high-quality dairy products. Consumers in Croatia have a preference for locally produced butter, which has led to a surge in domestic butter production. The market is also influenced by changing consumer preferences towards natural and organic food products, leading to an increased demand for premium and specialty butters. Key players in the market focus on product innovation, packaging, and marketing strategies to differentiate themselves and cater to evolving consumer tastes. Additionally, the market is witnessing a trend towards online retail channels and convenient packaging formats to enhance accessibility and convenience for consumers. Overall, the Croatia Table Butter Market is poised for steady growth driven by consumer demand for quality, variety, and convenience in butter products.
Croatia Table Butter Market Trends
The Croatia Table Butter Market is experiencing a shift towards increased demand for premium and high-quality butter products. Consumers are showing a preference for organic and locally sourced butter, driving opportunities for producers to differentiate their offerings through sustainable and ethical practices. Health-conscious consumers are also seeking butter products with reduced salt or added health benefits, creating a niche market for specialized products. Additionally, there is a growing trend towards convenience and innovation in packaging, with single-serve portions and easy-to-use packaging formats gaining popularity. Producers who can cater to these evolving consumer preferences and effectively communicate the value proposition of their products are well-positioned to capitalize on the opportunities present in the Croatia Table Butter Market.
Croatia Table Butter Market Challenges
In the Croatia Table Butter Market, some key challenges include fluctuating raw material costs, competition from imported butter products, and changing consumer preferences towards healthier alternatives. The volatility in raw material prices, such as milk and cream, can impact the production costs for butter manufacturers, affecting pricing strategies and profit margins. Imported butter products from other countries may offer competitive pricing or different quality attributes, posing a threat to domestic producers. Additionally, with a growing focus on health-conscious consumption habits, consumers are increasingly seeking alternatives to traditional butter, such as plant-based spreads or lower-fat options. To address these challenges, companies in the Croatia Table Butter Market may need to innovate their product offerings, optimize production processes, and invest in marketing strategies to differentiate themselves in the market.
Croatia Table Butter Market Investment Opportunities
The Croatia Table Butter Market is primarily driven by factors such as the growing consumer preference for natural and organic products, increasing disposable income leading to higher purchasing power, and the rising demand for high-quality dairy products. Additionally, the changing food habits and the influence of Western eating patterns are contributing to the growth of the table butter market in Croatia. The focus on traditional and authentic products, along with the health benefits associated with consuming butter in moderation, also play a significant role in driving the market. Furthermore, the expanding retail sector, including supermarkets and hypermarkets, provides greater accessibility to a wide range of table butter products, further fueling market growth in Croatia.
Croatia Table Butter Market Government Polices
Government policies related to the Croatia Table Butter Market include regulations on product quality, labeling requirements, and import/export restrictions. The Croatian Ministry of Agriculture and the Food Safety and Veterinary Directorate oversee the standards for production, packaging, and distribution of table butter to ensure consumer safety and fair trade practices. Additionally, there are policies in place to promote domestic production and support local farmers, including subsidies and incentives for butter producers. Import regulations aim to protect the domestic market from unfair competition and maintain the quality standards of imported butter products. Overall, the government`s policies in Croatia`s Table Butter Market focus on ensuring product quality, promoting domestic production, and safeguarding consumer interests.
Croatia Table Butter Market Future Outlook
The future outlook for the Croatia Table Butter Market appears positive, driven by factors such as increasing consumer preference for natural and high-quality dairy products, rising disposable income levels, and growing awareness about the health benefits of butter. Additionally, the expanding tourism industry in Croatia is expected to boost demand for table butter in the food service sector. Market players are likely to focus on product innovation, packaging enhancements, and marketing strategies to cater to evolving consumer preferences and distinguish themselves in a competitive market landscape. However, challenges such as fluctuating raw material prices and intensifying competition from alternative spreads may pose a threat to market growth. Overall, the Croatia Table Butter Market is anticipated to witness steady growth in the coming years, with opportunities for market expansion and diversification.
Key Highlights of the Report:
- Croatia Table Butter Market Outlook
- Market Size of Croatia Table Butter Market, 2024
- Forecast of Croatia Table Butter Market, 2031
- Historical Data and Forecast of Croatia Table Butter Revenues & Volume for the Period 2021- 2031
- Croatia Table Butter Market Trend Evolution
- Croatia Table Butter Market Drivers and Challenges
- Croatia Table Butter Price Trends
- Croatia Table Butter Porter's Five Forces
- Croatia Table Butter Industry Life Cycle
- Historical Data and Forecast of Croatia Table Butter Market Revenues & Volume By Type for the Period 2021- 2031
- Historical Data and Forecast of Croatia Table Butter Market Revenues & Volume By Organic for the Period 2021- 2031
- Historical Data and Forecast of Croatia Table Butter Market Revenues & Volume By Non-Organic for the Period 2021- 2031
- Historical Data and Forecast of Croatia Table Butter Market Revenues & Volume By Application for the Period 2021- 2031
- Historical Data and Forecast of Croatia Table Butter Market Revenues & Volume By Household for the Period 2021- 2031
- Historical Data and Forecast of Croatia Table Butter Market Revenues & Volume By Bakery for the Period 2021- 2031
- Historical Data and Forecast of Croatia Table Butter Market Revenues & Volume By Other for the Period 2021- 2031
- Croatia Table Butter Import Export Trade Statistics
- Market Opportunity Assessment By Type
- Market Opportunity Assessment By Application
- Croatia Table Butter Top Companies Market Share
- Croatia Table Butter Competitive Benchmarking By Technical and Operational Parameters
- Croatia Table Butter Company Profiles
- Croatia Table Butter Key Strategic Recommendations
Frequently Asked Questions About the Market Study (FAQs):
6Wresearch actively monitors the Croatia Table Butter Market and publishes its comprehensive annual report, highlighting emerging trends, growth drivers, revenue analysis, and forecast outlook. Our insights help businesses to make data-backed strategic decisions with ongoing market dynamics. Our analysts track relevent industries related to the Croatia Table Butter Market, allowing our clients with actionable intelligence and reliable forecasts tailored to emerging regional needs.
Yes, we provide customisation as per your requirements. To learn more, feel free to contact us on sales@6wresearch.com
1 Executive Summary |
2 Introduction |
2.1 Key Highlights of the Report |
2.2 Report Description |
2.3 Market Scope & Segmentation |
2.4 Research Methodology |
2.5 Assumptions |
3 Croatia Table Butter Market Overview |
3.1 Croatia Country Macro Economic Indicators |
3.2 Croatia Table Butter Market Revenues & Volume, 2021 & 2031F |
3.3 Croatia Table Butter Market - Industry Life Cycle |
3.4 Croatia Table Butter Market - Porter's Five Forces |
3.5 Croatia Table Butter Market Revenues & Volume Share, By Type, 2021 & 2031F |
3.6 Croatia Table Butter Market Revenues & Volume Share, By Application, 2021 & 2031F |
4 Croatia Table Butter Market Dynamics |
4.1 Impact Analysis |
4.2 Market Drivers |
4.2.1 Growing consumer preference for natural and organic food products |
4.2.2 Increasing awareness about the health benefits of consuming butter |
4.2.3 Rising disposable incomes leading to higher spending on premium food products |
4.3 Market Restraints |
4.3.1 Fluctuating prices of raw materials such as milk and cream |
4.3.2 Competition from margarine and other butter substitutes in the market |
4.3.3 Changing dietary preferences towards healthier alternatives |
5 Croatia Table Butter Market Trends |
6 Croatia Table Butter Market, By Types |
6.1 Croatia Table Butter Market, By Type |
6.1.1 Overview and Analysis |
6.1.2 Croatia Table Butter Market Revenues & Volume, By Type, 2021- 2031F |
6.1.3 Croatia Table Butter Market Revenues & Volume, By Organic, 2021- 2031F |
6.1.4 Croatia Table Butter Market Revenues & Volume, By Non-Organic, 2021- 2031F |
6.2 Croatia Table Butter Market, By Application |
6.2.1 Overview and Analysis |
6.2.2 Croatia Table Butter Market Revenues & Volume, By Household, 2021- 2031F |
6.2.3 Croatia Table Butter Market Revenues & Volume, By Bakery, 2021- 2031F |
6.2.4 Croatia Table Butter Market Revenues & Volume, By Other, 2021- 2031F |
7 Croatia Table Butter Market Import-Export Trade Statistics |
7.1 Croatia Table Butter Market Export to Major Countries |
7.2 Croatia Table Butter Market Imports from Major Countries |
8 Croatia Table Butter Market Key Performance Indicators |
8.1 Consumer perception and preference towards natural and organic butter products |
8.2 Household expenditure on premium food items including table butter |
8.3 Trend in per capita consumption of table butter in Croatia |
9 Croatia Table Butter Market - Opportunity Assessment |
9.1 Croatia Table Butter Market Opportunity Assessment, By Type, 2021 & 2031F |
9.2 Croatia Table Butter Market Opportunity Assessment, By Application, 2021 & 2031F |
10 Croatia Table Butter Market - Competitive Landscape |
10.1 Croatia Table Butter Market Revenue Share, By Companies, 2024 |
10.2 Croatia Table Butter Market Competitive Benchmarking, By Operating and Technical Parameters |
11 Company Profiles |
12 Recommendations |
13 Disclaimer |
Export potential assessment - trade Analytics for 2030
Export potential enables firms to identify high-growth global markets with greater confidence by combining advanced trade intelligence with a structured quantitative methodology. The framework analyzes emerging demand trends and country-level import patterns while integrating macroeconomic and trade datasets such as GDP and population forecasts, bilateral import–export flows, tariff structures, elasticity differentials between developed and developing economies, geographic distance, and import demand projections. Using weighted trade values from 2020–2024 as the base period to project country-to-country export potential for 2030, these inputs are operationalized through calculated drivers such as gravity model parameters, tariff impact factors, and projected GDP per-capita growth. Through an analysis of hidden potentials, demand hotspots, and market conditions that are most favorable to success, this method enables firms to focus on target countries, maximize returns, and global expansion with data, backed by accuracy.
By factoring in the projected importer demand gap that is currently unmet and could be potential opportunity, it identifies the potential for the Exporter (Country) among 190 countries, against the general trade analysis, which identifies the biggest importer or exporter.
To discover high-growth global markets and optimize your business strategy:
Click Here
Pricing
- Single User License$ 1,995
- Department License$ 2,400
- Site License$ 3,120
- Global License$ 3,795

Search
Thought Leadership and Analyst Meet


Our Clients
Latest Reports
- Taiwan Food Delivery Platform Market (2026-2032) | Companies, Outlook, Analysis, Trends, Value, Revenue, Segmentation, Share, Forecast, Competitive Landscape, Growth, Size & Forecast
- United Kingdom (UK) Long-term Care Insurance Market (2026-2032) | Growth, Share, Consumer Insights, Drivers, Opportunities, Competition, Pricing Analysis, Segments, Restraints, Companies, Competitive, Value, Outlook, Size, Demand, Analysis, Challenges, Strategic Insights, Investment Trends, Revenue, Trends, Supply, Forecast
- United Kingdom (UK) Long Term Care Market (2026-2032) | Companies, Outlook, Analysis, Trends, Value, Revenue, Segmentation, Share, Forecast, Competitive Landscape, Growth, Size & Forecast
- Iraq Insulation and Waterproofing Market (2026-2032) | Outlook, Drivers, Growth, Size, Share, Industry, Revenue, Trends, Demand, Competitive, Strategic Insights, Opportunities, Segments, Companies, Challenges, Strategy, Consumer Insights, Analysis, Investment Trends, Value, Segmentation, Forecast, Restraints
- India Switchgear Market Outlook (2026-2032) | Size, Share, Trends, Growth, Revenue, Forecast, Analysis, Value, Outlook
- Pakistan Contraceptive Implants Market (2025-2031) | Demand, Growth, Size, Share, Industry, Pricing Analysis, Competitive, Strategic Insights, Strategy, Consumer Insights, Analysis, Investment Trends, Opportunities, Revenue, Segments, Value, Segmentation, Supply, Forecast, Restraints, Outlook, Competition, Drivers, Trends, Companies, Challenges
- Sri Lanka Packaging Market (2026-2032) | Outlook, Competition, Drivers, Trends, Demand, Pricing Analysis, Competitive, Strategic Insights, Companies, Challenges, Strategy, Consumer Insights, Analysis, Investment Trends, Opportunities, Growth, Size, Share, Industry, Revenue, Segments, Value, Segmentation, Supply, Forecast, Restraints
- India Kids Watches Market (2026-2032) | Strategy, Consumer Insights, Analysis, Investment Trends, Opportunities, Growth, Size, Share, Industry, Revenue, Segments, Value, Segmentation, Supply, Forecast, Restraints, Outlook, Competition, Drivers, Trends, Demand, Pricing Analysis, Competitive, Strategic Insights, Companies, Challenges
- Saudi Arabia Core Assurance Service Market (2025-2031) | Strategy, Consumer Insights, Analysis, Investment Trends, Opportunities, Growth, Size, Share, Industry, Revenue, Segments, Value, Segmentation, Supply, Forecast, Restraints, Outlook, Competition, Drivers, Trends, Demand, Pricing Analysis, Competitive, Strategic Insights, Companies, Challenges
- Romania Uninterruptible Power Supply (UPS) Market (2026-2032) | Industry, Analysis, Revenue, Size, Forecast, Outlook, Value, Trends, Share, Growth & Companies
Industry Events and Analyst Meet

India EV Show 2026

EV tech India Expo 2026

Auto Tech Asia 2026

Battery Tech India 2026

Smart Production Solutions Guangzhou 2026
Whitepaper
- Middle East & Africa Commercial Security Market Click here to view more.
- Middle East & Africa Fire Safety Systems & Equipment Market Click here to view more.
- GCC Drone Market Click here to view more.
- Middle East Lighting Fixture Market Click here to view more.
- GCC Physical & Perimeter Security Market Click here to view more.
6WResearch In News
- Doha a strategic location for EV manufacturing hub: IPA Qatar
- Demand for luxury TVs surging in the GCC, says Samsung
- Empowering Growth: The Thriving Journey of Bangladesh’s Cable Industry
- Demand for luxury TVs surging in the GCC, says Samsung
- Video call with a traditional healer? Once unthinkable, it’s now common in South Africa
- Intelligent Buildings To Smooth GCC’s Path To Net Zero