Croatia Varnish Market (2026-2032) | Share, Analysis, Outlook, Value, Industry, Forecast, Growth, Competitive Landscape, Companies, Trends, Size & Revenue, Segmentation
Market Forecast By Type (UV Curable Overprint Varnishes, Water Based Overprint Varnish), By Application (Commercial prints, Food Industry, Pharmaceuticals, Others) And Competitive Landscape
| Product Code: ETC6864068 | Publication Date: Sep 2024 | Updated Date: Apr 2026 | Product Type: Market Research Report | |
| Publisher: 6Wresearch | Author: Sumit Sagar | No. of Pages: 75 | No. of Figures: 35 | No. of Tables: 20 |
Croatia Varnish Market Size (2020-2030)
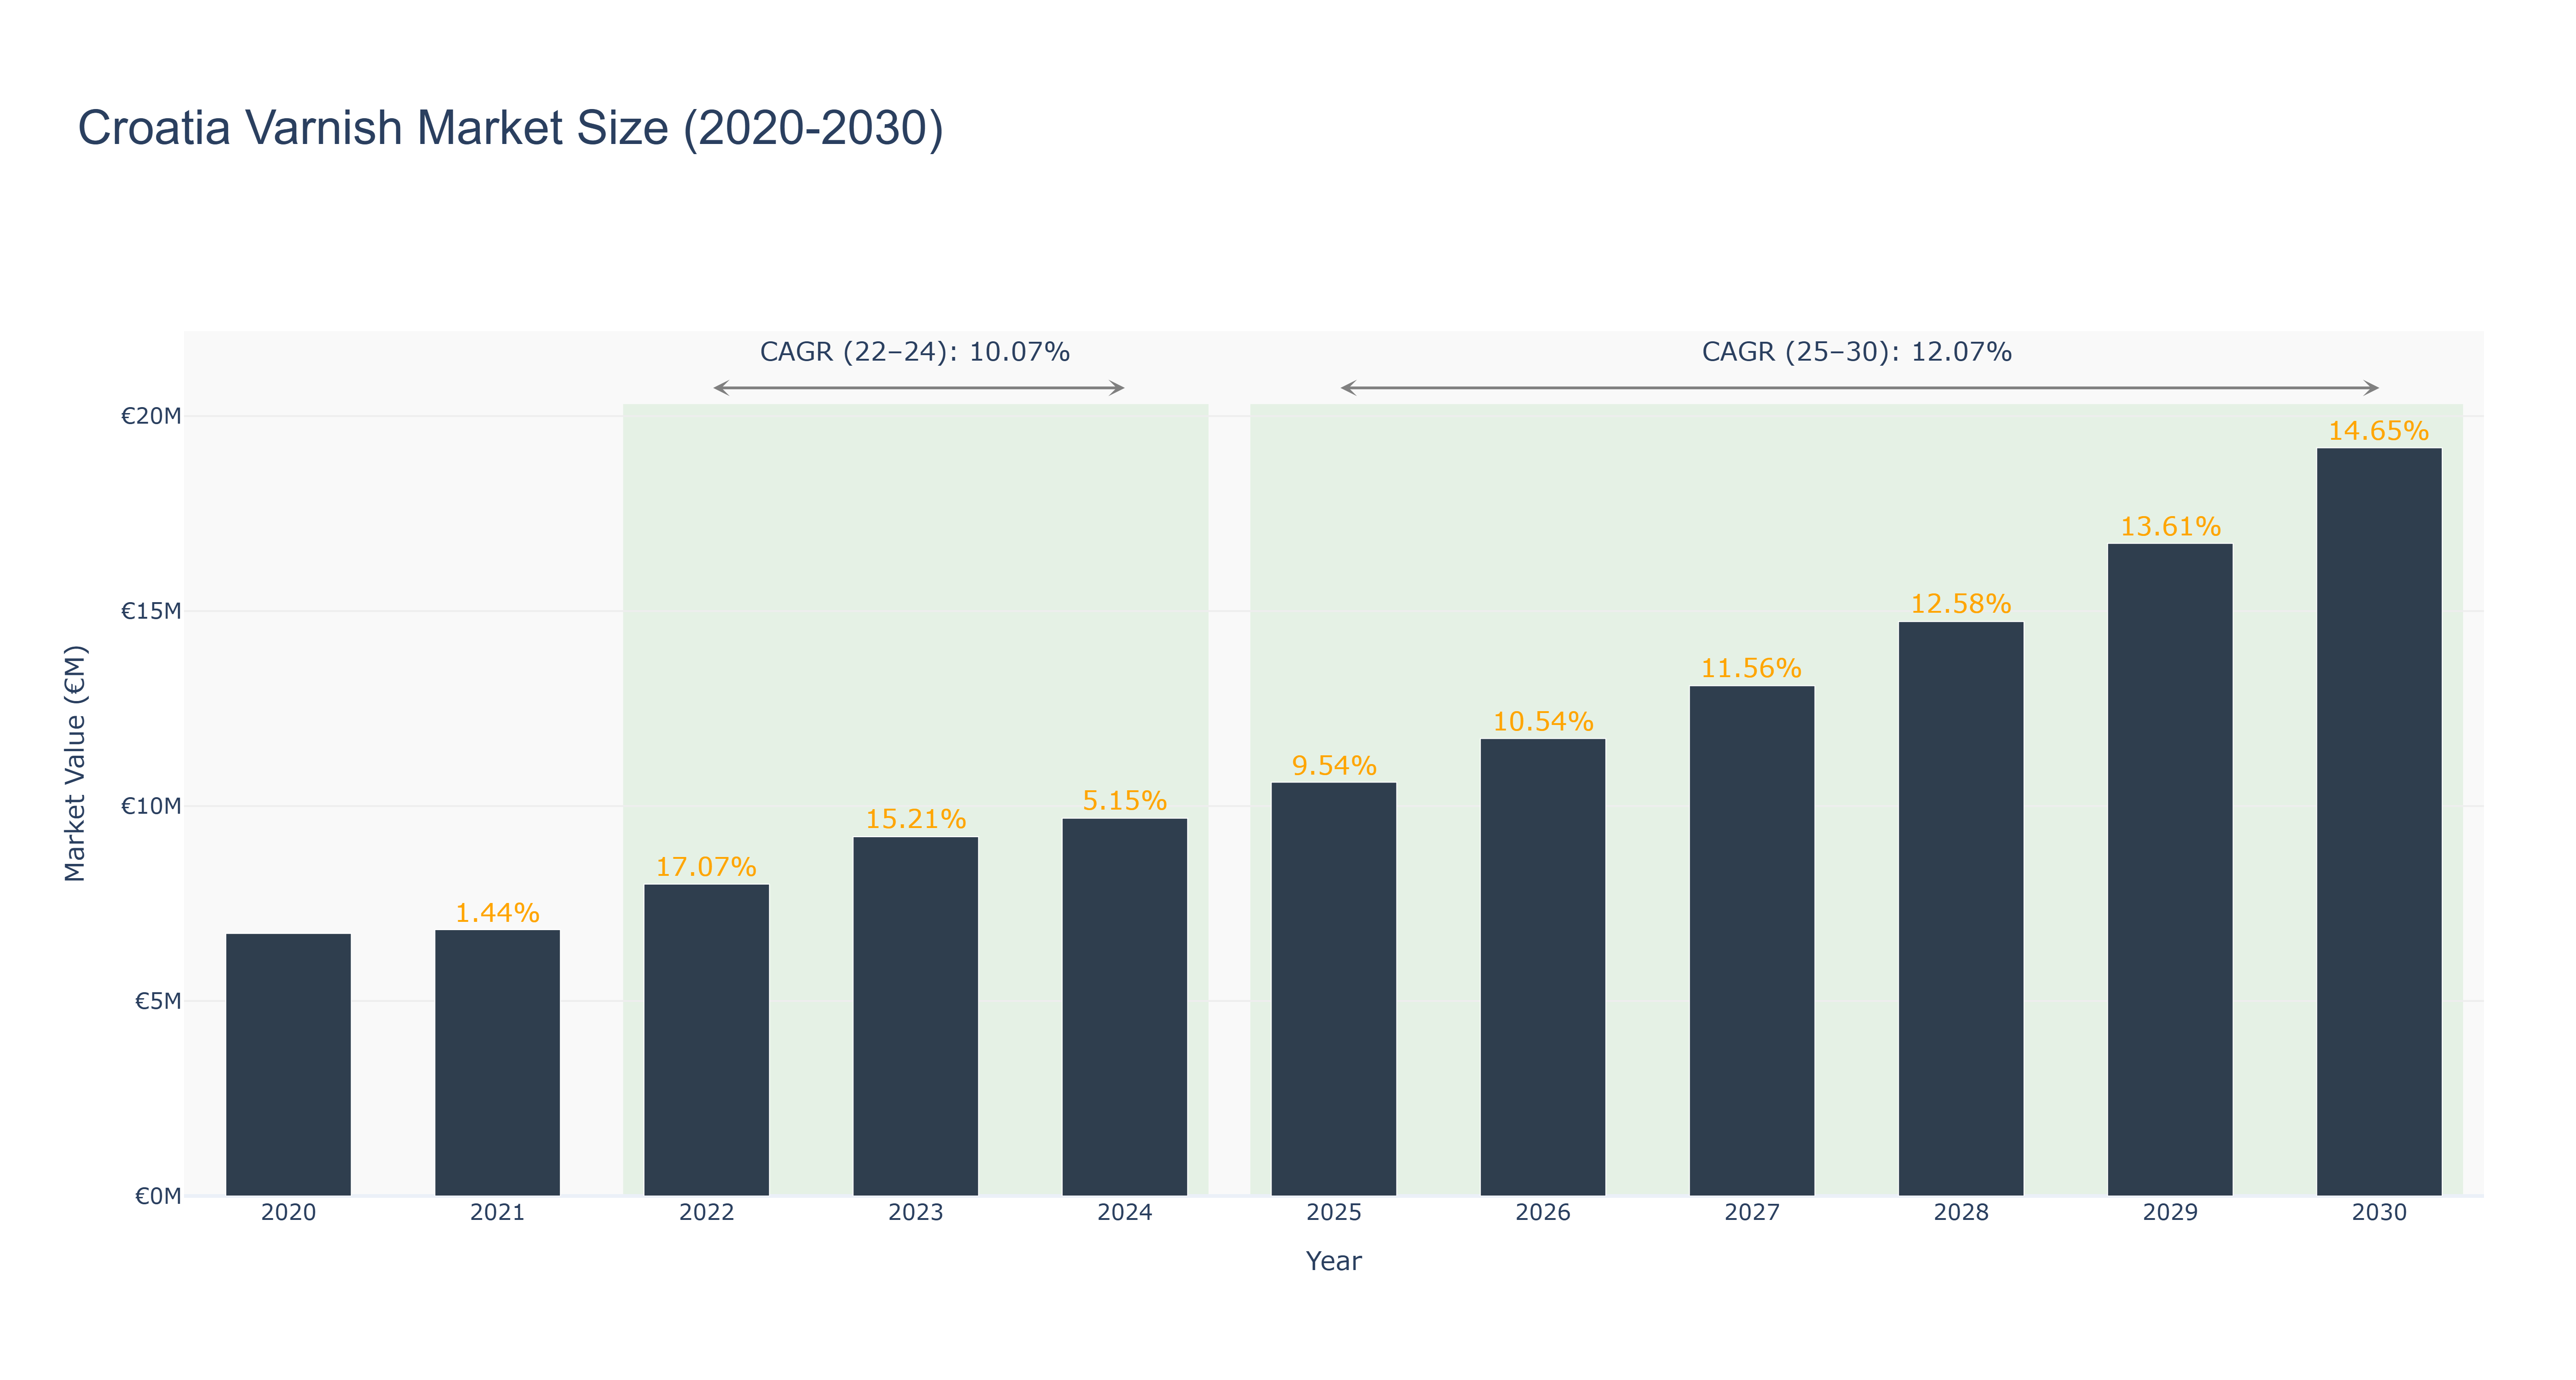
The Croatia Varnish Market has demonstrated significant growth, peaking at a market size of €9.69 million in 2024, following actual values of €6.73 million in 2020, €6.83 million in 2021, €8.00 million in 2022, and €9.21 million in 2023. The market recorded a robust CAGR of 10.07% from 2022 to 2024, driven by increased demand in the construction and automotive sectors, alongside a general rise in consumer spending. Looking ahead, the forecasted period from 2025 to 2030 anticipates a further expansion, with projected market sizes reaching €19.19 million by 2030 and a CAGR of 12.07%. This growth is likely fueled by ongoing investments in infrastructure and eco-friendly product innovations. As the varnish market evolves, companies are expected to capitalize on sustainability trends, enhancing their product offerings to meet consumer preferences and regulatory standards.
Croatia Varnish Market: Production & Trade Performance (2019-2025)
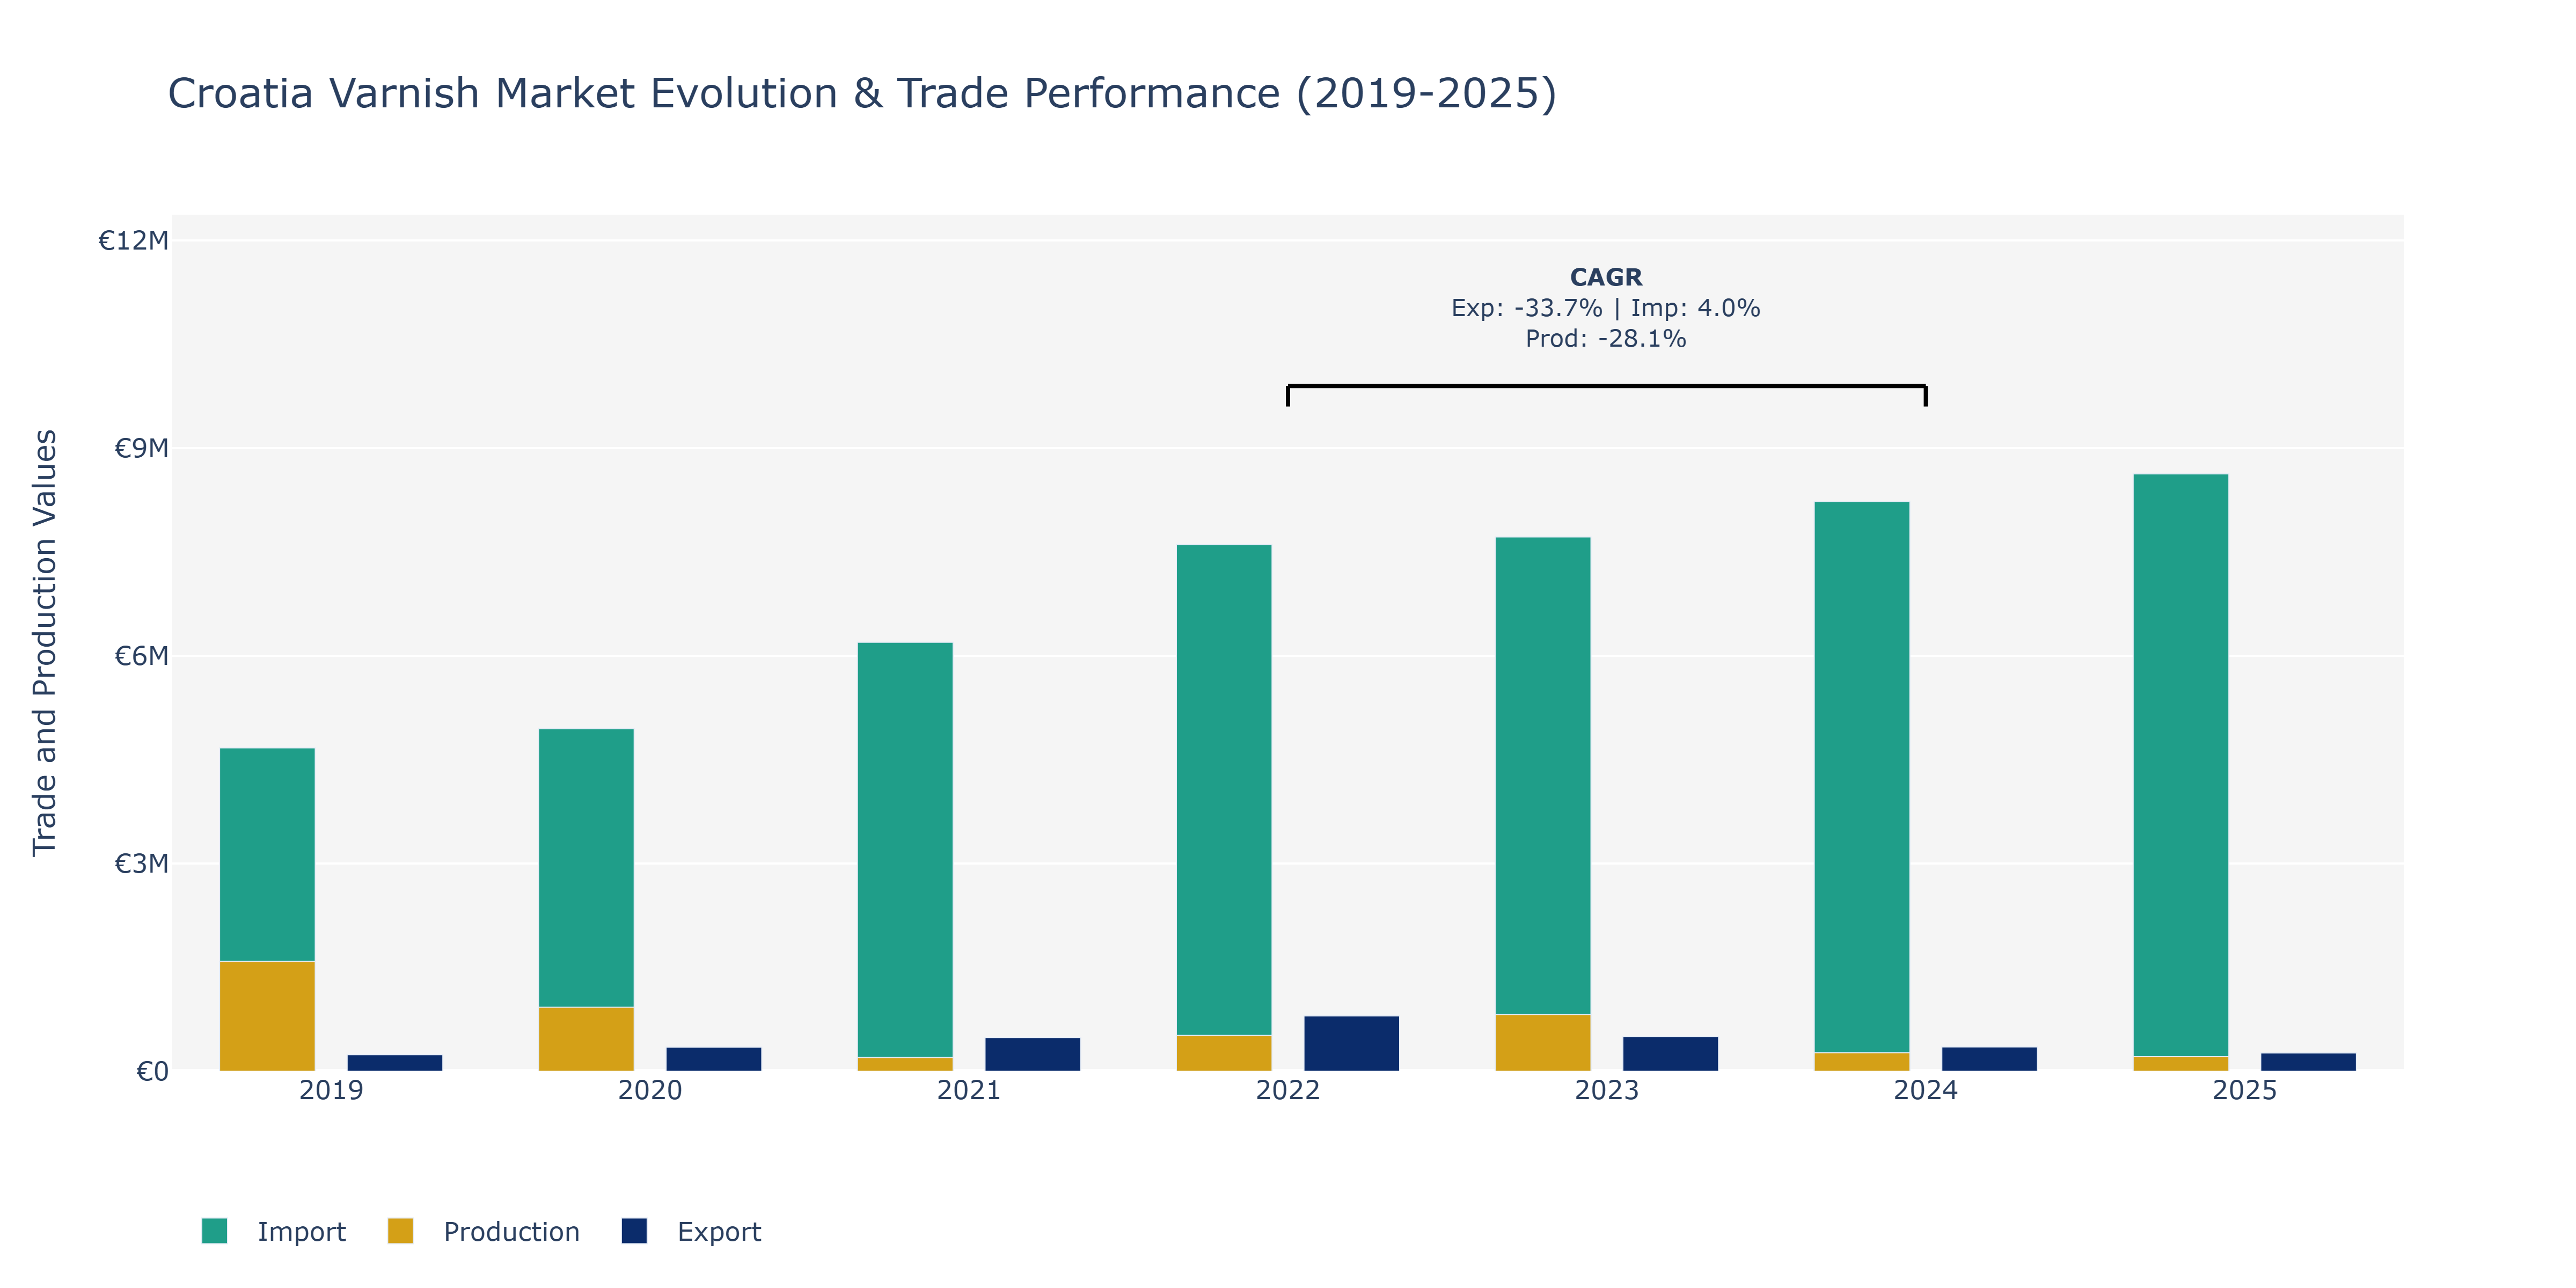
Between 2019 and 2025, Croatia's Varnish Market witnessed varying trends in Exports, Imports, and Production. In 2019, Imports stood notably higher than Exports, with Imports totaling €4.67 million and Exports at €237.68 thousand. The year 2021 marked a significant rise in both Exports, reaching €486.54 thousand, and Imports, escalating to €6.2 million. However, in 2022, Exports surged to €797.46 thousand, reflecting a peak, while Production peaked in 2019 at €1.58 billion. Subsequently, both Exports and Production experienced a decline by 2024, with Exports dropping to €350.7 thousand and Production to €270 thousand. This dip could be attributed to various factors such as changing consumer preferences, fluctuating raw material costs, and global economic conditions. Despite the fluctuations, Imports showed a consistent growth trend throughout the period, reaching €8.63 million in 2025, showcasing the market's reliance on external sources for raw materials, potentially influenced by international trade agreements and supply chain dynamics.
Key Highlights of the Report:
- Croatia Varnish Market Outlook
- Market Size of Croatia Varnish Market, 2025
- Forecast of Croatia Varnish Market, 2032
- Historical Data and Forecast of Croatia Varnish Revenues & Volume for the Period 2022 - 2032
- Croatia Varnish Market Trend Evolution
- Croatia Varnish Market Drivers and Challenges
- Croatia Varnish Price Trends
- Croatia Varnish Porter's Five Forces
- Croatia Varnish Industry Life Cycle
- Historical Data and Forecast of Croatia Varnish Market Revenues & Volume By Type for the Period 2022 - 2032
- Historical Data and Forecast of Croatia Varnish Market Revenues & Volume By UV Curable Overprint Varnishes for the Period 2022 - 2032
- Historical Data and Forecast of Croatia Varnish Market Revenues & Volume By Water Based Overprint Varnish for the Period 2022 - 2032
- Historical Data and Forecast of Croatia Varnish Market Revenues & Volume By Application for the Period 2022 - 2032
- Historical Data and Forecast of Croatia Varnish Market Revenues & Volume By Commercial prints for the Period 2022 - 2032
- Historical Data and Forecast of Croatia Varnish Market Revenues & Volume By Food Industry for the Period 2022 - 2032
- Historical Data and Forecast of Croatia Varnish Market Revenues & Volume By Pharmaceuticals for the Period 2022 - 2032
- Historical Data and Forecast of Croatia Varnish Market Revenues & Volume By Others for the Period 2022 - 2032
- Croatia Varnish Import Export Trade Statistics
- Market Opportunity Assessment By Type
- Market Opportunity Assessment By Application
- Croatia Varnish Top Companies Market Share
- Croatia Varnish Competitive Benchmarking By Technical and Operational Parameters
- Croatia Varnish Company Profiles
- Croatia Varnish Key Strategic Recommendations
Frequently Asked Questions About the Market Study (FAQs):
6Wresearch actively monitors the Croatia Varnish Market and publishes its comprehensive annual report, highlighting emerging trends, growth drivers, revenue analysis, and forecast outlook. Our insights help businesses to make data-backed strategic decisions with ongoing market dynamics. Our analysts track relevent industries related to the Croatia Varnish Market, allowing our clients with actionable intelligence and reliable forecasts tailored to emerging regional needs.
Yes, we provide customisation as per your requirements. To learn more, feel free to contact us on sales@6wresearch.com
1 Executive Summary |
2 Introduction |
2.1 Key Highlights of the Report |
2.2 Report Description |
2.3 Market Scope & Segmentation |
2.4 Research Methodology |
2.5 Assumptions |
3 Croatia Varnish Market Overview |
3.1 Croatia Country Macro Economic Indicators |
3.2 Croatia Varnish Market Revenues & Volume, 2022 & 2032F |
3.3 Croatia Varnish Market - Industry Life Cycle |
3.4 Croatia Varnish Market - Porter's Five Forces |
3.5 Croatia Varnish Market Revenues & Volume Share, By Type, 2022 & 2032F |
3.6 Croatia Varnish Market Revenues & Volume Share, By Application, 2022 & 2032F |
4 Croatia Varnish Market Dynamics |
4.1 Impact Analysis |
4.2 Market Drivers |
4.2.1 Growth in the construction industry in Croatia, leading to increased demand for varnish for wood finishing. |
4.2.2 Rising disposable income among consumers in Croatia, allowing for higher spending on home improvement projects. |
4.2.3 Increasing awareness about the benefits of using varnish for protection and aesthetic enhancement of wood surfaces. |
4.3 Market Restraints |
4.3.1 Fluctuations in raw material prices, impacting the production cost of varnish. |
4.3.2 Stringent environmental regulations and growing consumer preference for eco-friendly products, requiring varnish manufacturers to adapt their formulations. |
4.3.3 Competition from alternative wood finishing products such as paints and stains, affecting the market share of varnish. |
5 Croatia Varnish Market Trends |
6 Croatia Varnish Market, By Types |
6.1 Croatia Varnish Market, By Type |
6.1.1 Overview and Analysis |
6.1.2 Croatia Varnish Market Revenues & Volume, By Type, 2022 - 2032F |
6.1.3 Croatia Varnish Market Revenues & Volume, By UV Curable Overprint Varnishes, 2022 - 2032F |
6.1.4 Croatia Varnish Market Revenues & Volume, By Water Based Overprint Varnish, 2022 - 2032F |
6.2 Croatia Varnish Market, By Application |
6.2.1 Overview and Analysis |
6.2.2 Croatia Varnish Market Revenues & Volume, By Commercial prints, 2022 - 2032F |
6.2.3 Croatia Varnish Market Revenues & Volume, By Food Industry, 2022 - 2032F |
6.2.4 Croatia Varnish Market Revenues & Volume, By Pharmaceuticals, 2022 - 2032F |
6.2.5 Croatia Varnish Market Revenues & Volume, By Others, 2022 - 2032F |
7 Croatia Varnish Market Import-Export Trade Statistics |
7.1 Croatia Varnish Market Export to Major Countries |
7.2 Croatia Varnish Market Imports from Major Countries |
8 Croatia Varnish Market Key Performance Indicators |
8.1 Average price of varnish products in the Croatian market. |
8.2 Number of new construction projects in Croatia using varnish for wood finishing. |
8.3 Consumer satisfaction levels with the quality and durability of varnish products available in the market. |
9 Croatia Varnish Market - Opportunity Assessment |
9.1 Croatia Varnish Market Opportunity Assessment, By Type, 2022 & 2032F |
9.2 Croatia Varnish Market Opportunity Assessment, By Application, 2022 & 2032F |
10 Croatia Varnish Market - Competitive Landscape |
10.1 Croatia Varnish Market Revenue Share, By Companies, 2025 |
10.2 Croatia Varnish Market Competitive Benchmarking, By Operating and Technical Parameters |
11 Company Profiles |
12 Recommendations |
13 Disclaimer |
Global Go To Market Strategy - 2030
Export potential enables firms to identify high-growth global markets with greater confidence by combining advanced trade intelligence with a structured quantitative methodology. The framework analyzes emerging demand trends and country-level import patterns while integrating macroeconomic and trade datasets such as GDP and population forecasts, bilateral import–export flows, tariff structures, elasticity differentials between developed and developing economies, geographic distance, and import demand projections. Using weighted trade values from 2020–2024 as the base period to project country-to-country export potential for 2030, these inputs are operationalized through calculated drivers such as gravity model parameters, tariff impact factors, and projected GDP per-capita growth. Through an analysis of hidden potentials, demand hotspots, and market conditions that are most favorable to success, this method enables firms to focus on target countries, maximize returns, and global expansion with data, backed by accuracy.
By factoring in the projected importer demand gap that is currently unmet and could be potential opportunity, it identifies the potential for the Exporter (Country) among 190 countries, against the general trade analysis, which identifies the biggest importer or exporter.
To discover high-growth global markets and optimize your business strategy:
Click Here
Pricing
- Single User License$ 1,995
- Department License$ 2,400
- Site License$ 3,120
- Global License$ 3,795

Leadership Perspectives from Industry Events
Search
Thought Leadership and Analyst Meet


Our Clients
6WResearch In News
- India Air Conditioner Market Set for Strong Rebound in 2026 After Weather-Led Correction and GST-Driven Recovery: 6Wresearch
- ADAS in India: How Automatic Emergency Braking, Blind Spot Detection & Driver Monitoring are Transforming Road Safety
- Doha a strategic location for EV manufacturing hub: IPA Qatar
- Demand for luxury TVs surging in the GCC, says Samsung
- Empowering Growth: The Thriving Journey of Bangladesh’s Cable Industry
- Demand for luxury TVs surging in the GCC, says Samsung
Latest Reports
- Poland Fire Protection Systems Market (2026-2032)
- Cape Verde Portable Hand-Thrown Extinguisher Market (2026-2032)
- Canada Portable Hand-Thrown Extinguisher Market (2026-2032)
- Cameroon Portable Hand-Thrown Extinguisher Market (2026-2032)
- Burundi Portable Hand-Thrown Extinguisher Market (2026-2032)
- Burkina Faso Portable Hand-Thrown Extinguisher Market (2026-2032)
- Bulgaria Portable Hand-Thrown Extinguisher Market (2026-2032)
- Brunei Portable Hand-Thrown Extinguisher Market (2026-2032)
- Botswana Portable Hand-Thrown Extinguisher Market (2026-2032)
- Bosnia and Herzegovina Portable Hand-Thrown Extinguisher Market (2026-2032)
Industry Events and Analyst Meet

HIMTEX 2026

India Refining Summit 2026

India EV Show 2026

EV tech India Expo 2026

Auto Tech Asia 2026
Whitepaper
- Middle East & Africa Commercial Security Market Click here to view more.
- Middle East & Africa Fire Safety Systems & Equipment Market Click here to view more.
- GCC Drone Market Click here to view more.
- Middle East Lighting Fixture Market Click here to view more.
- GCC Physical & Perimeter Security Market Click here to view more.