Cyprus Bar Soap Market (2025-2031) | Share, Companies, Forecast, Value, Growth, Size & Revenue, Segmentation, Industry, Trends, Competitive Landscape, Outlook, Analysis
Market Forecast By Type (Organic, Synthetic), By Application (Hair Care, Skin/Body Care, Facial Care, Specialized), By Distribution Channel (Supermarkets/Hypermarkets, Convenience Stores, Specialty Stores, Online Retailers, Others) And Competitive Landscape
| Product Code: ETC6889211 | Publication Date: Sep 2024 | Updated Date: Apr 2026 | Product Type: Market Research Report | |
| Publisher: 6Wresearch | Author: Summon Dutta | No. of Pages: 75 | No. of Figures: 35 | No. of Tables: 20 |
Cyprus Bar Soap Market Size (2020-2030)
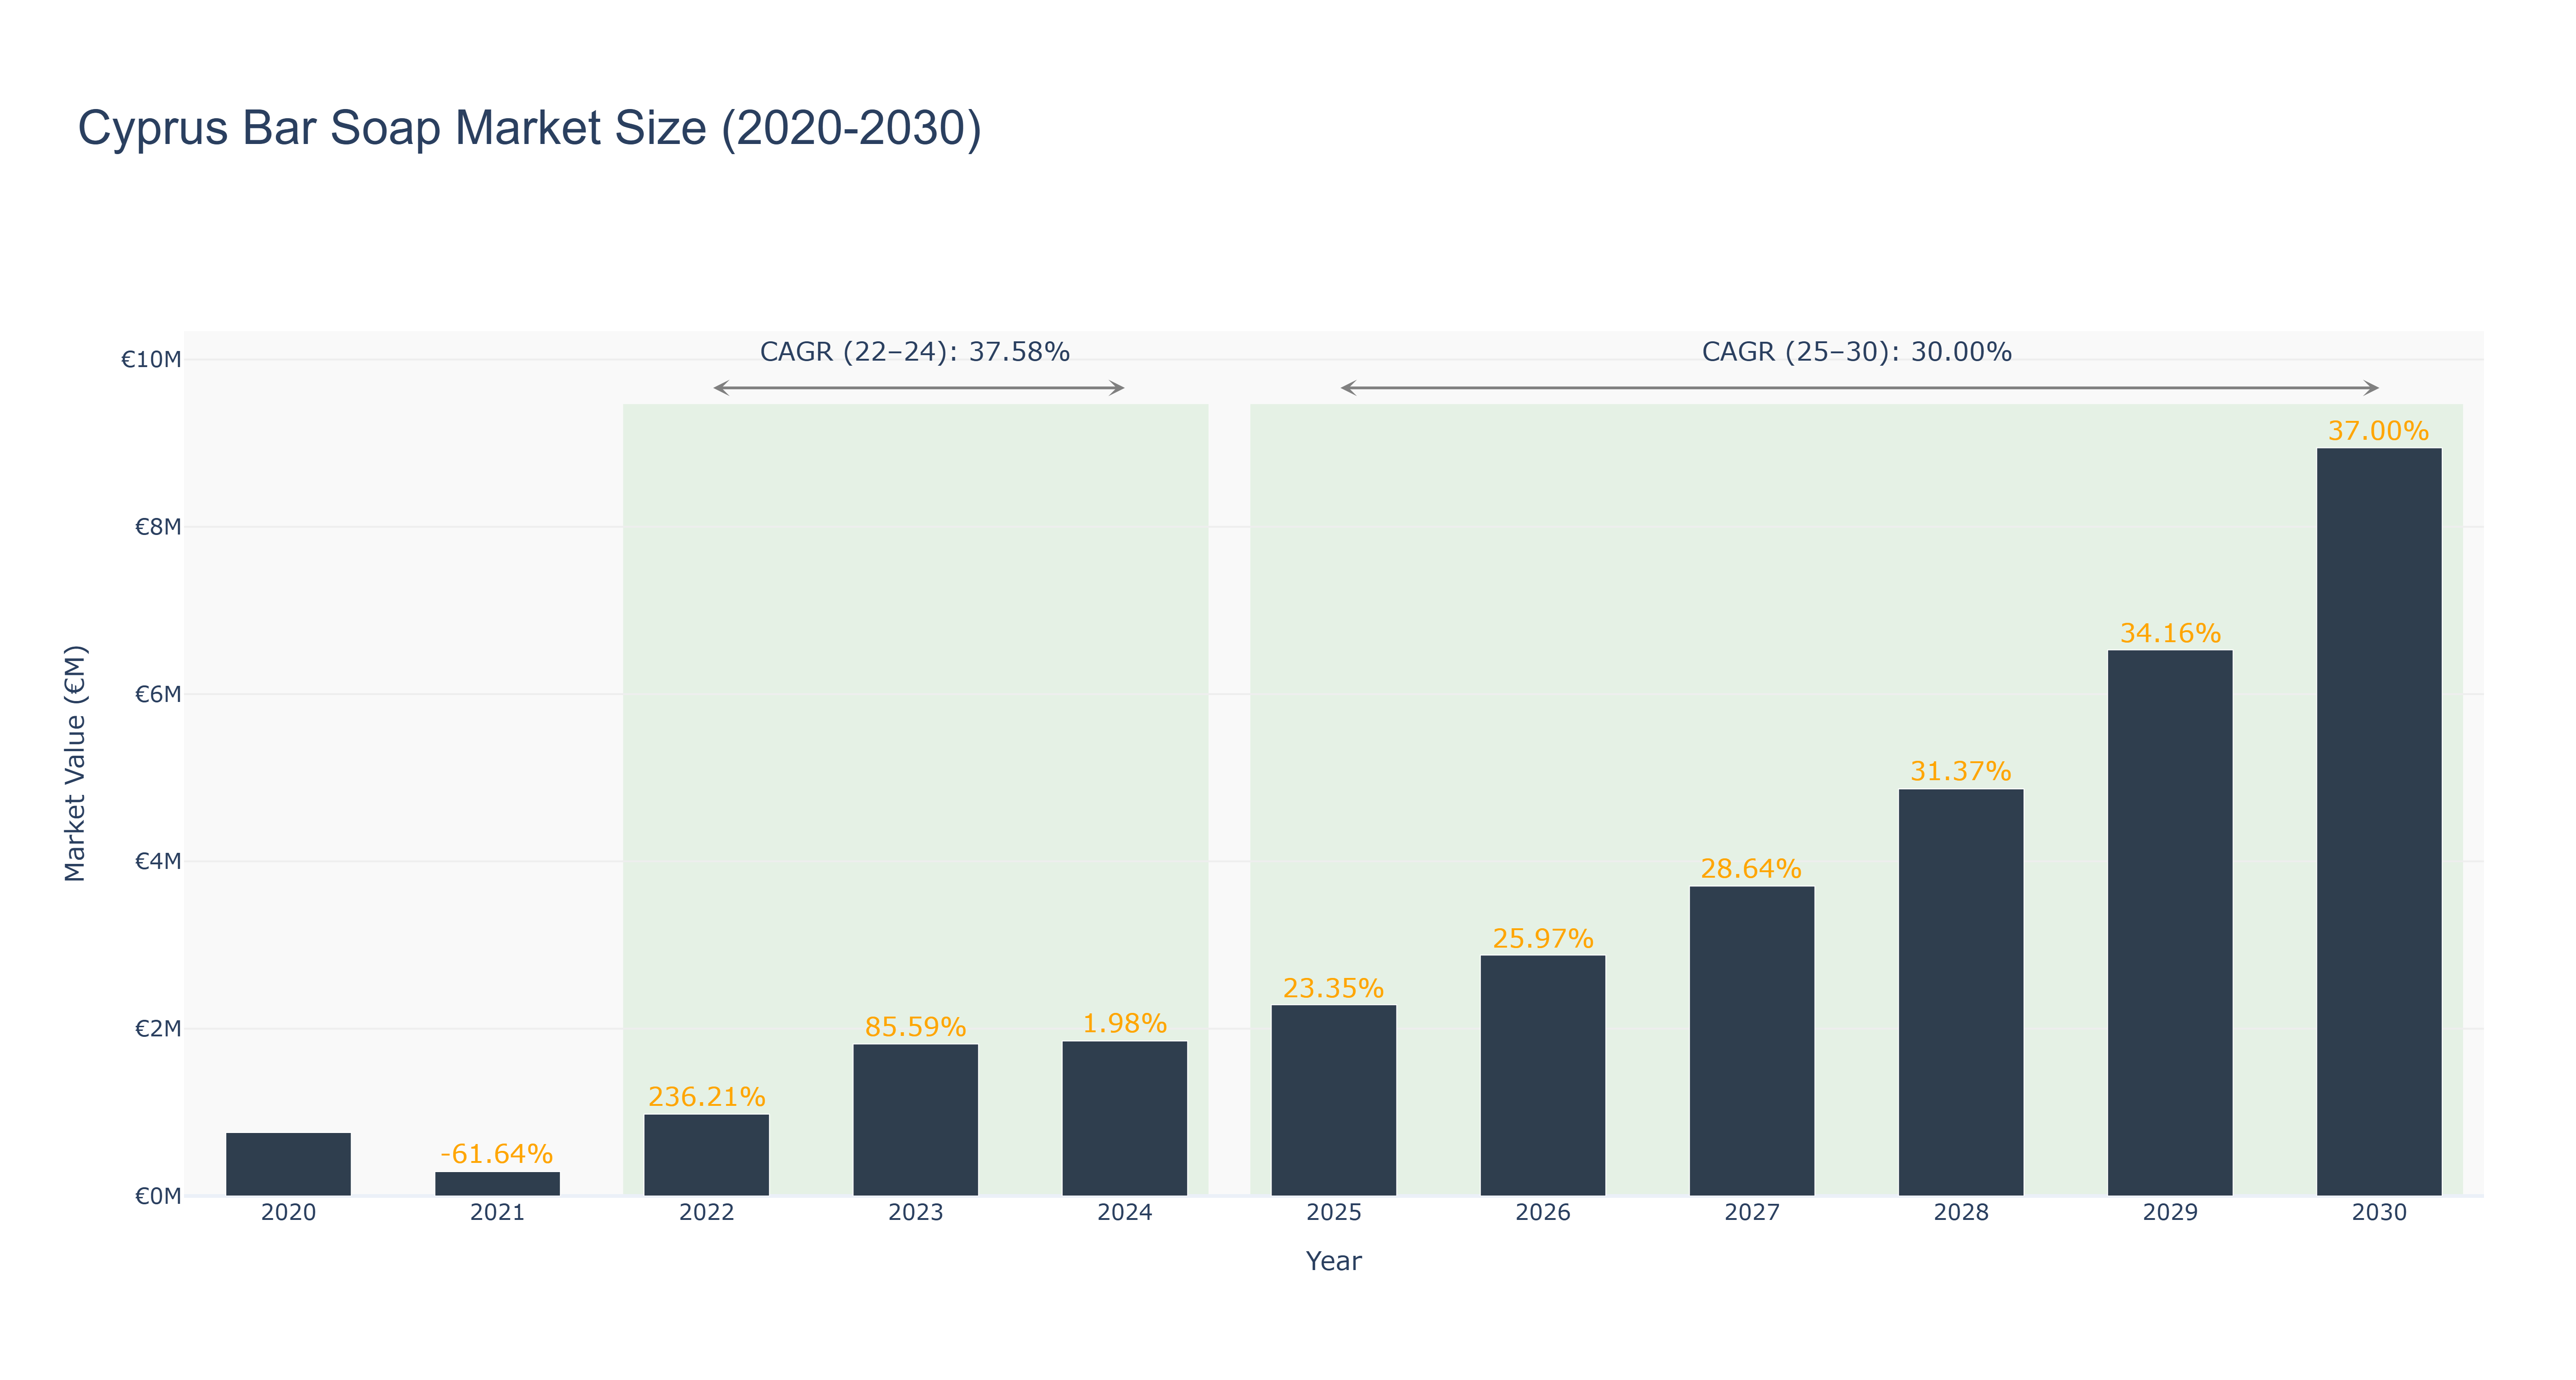
Cyprus Bar Soap Market has shown significant growth over the years. The market size peaked at €8.94 million in 2030, with a steady increase from €0.76 million in 2020. The CAGR from 2022 to 2024 was 37.58%, driven by changing consumer preferences towards natural and organic products. Subsequently, the CAGR from 2025 to 2030 is projected at 30.0%, indicating sustained growth potential. The market's expansion can be attributed to rising awareness of hygiene practices and the increasing focus on personal care products. Looking ahead, Cyprus is set to witness the launch of innovative soap formulations leveraging advanced technologies, catering to evolving consumer demands for eco-friendly and sustainable options. This trend aligns with the market's trajectory towards growth and innovation in the coming years.
Cyprus Bar Soap Market: Production & Trade Performance (2019-2025)
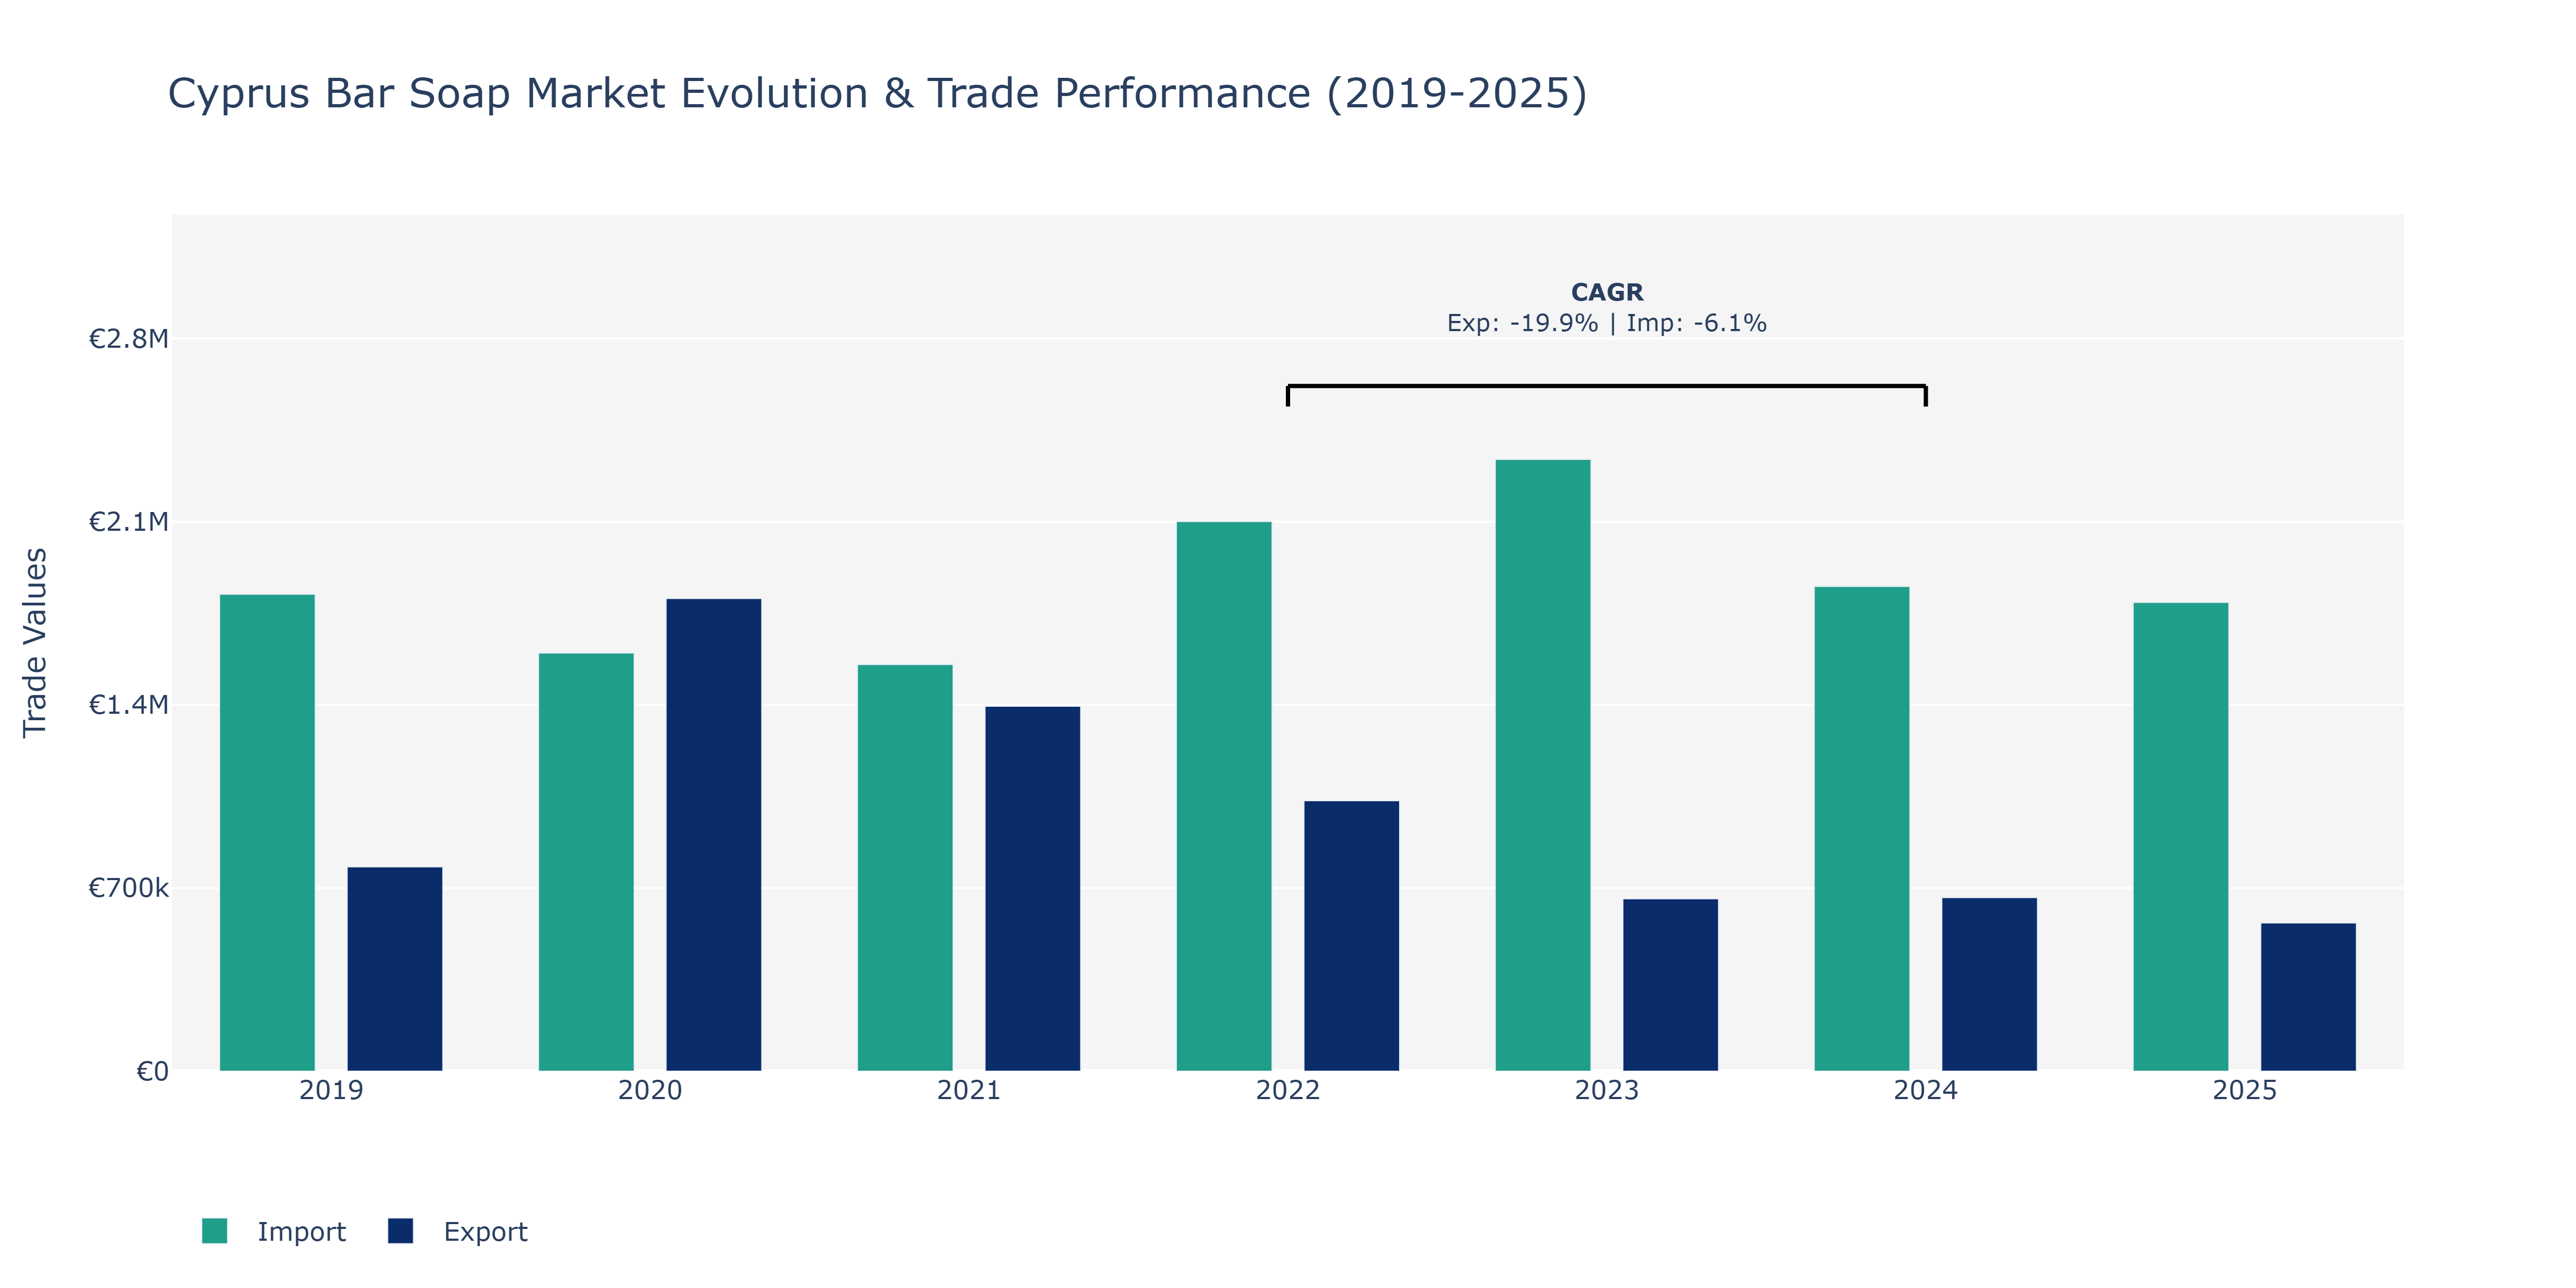
In the Cyprus Bar Soap Market, from 2019 to 2025, exports and imports experienced varying trends. Exports peaked in 2020 at €1.81 million and subsequently saw a decline, reaching €566.66 thousand in 2025. In contrast, imports fluctuated, with the highest value of €2.34 million in 2023 and a decrease to €1.79 million in 2025. The sharp decline in exports could be attributed to changing consumer preferences towards organic or natural soap products, impacting the demand for traditional bar soaps. On the other hand, the fluctuations in imports might reflect shifts in raw material costs or changes in global supply chain dynamics affecting the import volumes of bar soap ingredients. To stay competitive, local manufacturers may need to innovate their product offerings to align with market demands while efficiently managing import costs to maintain profitability in the evolving soap market landscape.
Key Highlights of the Report:
- Cyprus Bar Soap Market Outlook
- Market Size of Cyprus Bar Soap Market, 2024
- Forecast of Cyprus Bar Soap Market, 2031
- Historical Data and Forecast of Cyprus Bar Soap Revenues & Volume for the Period 2021- 2031
- Cyprus Bar Soap Market Trend Evolution
- Cyprus Bar Soap Market Drivers and Challenges
- Cyprus Bar Soap Price Trends
- Cyprus Bar Soap Porter's Five Forces
- Cyprus Bar Soap Industry Life Cycle
- Historical Data and Forecast of Cyprus Bar Soap Market Revenues & Volume By Type for the Period 2021- 2031
- Historical Data and Forecast of Cyprus Bar Soap Market Revenues & Volume By Organic for the Period 2021- 2031
- Historical Data and Forecast of Cyprus Bar Soap Market Revenues & Volume By Synthetic for the Period 2021- 2031
- Historical Data and Forecast of Cyprus Bar Soap Market Revenues & Volume By Application for the Period 2021- 2031
- Historical Data and Forecast of Cyprus Bar Soap Market Revenues & Volume By Hair Care for the Period 2021- 2031
- Historical Data and Forecast of Cyprus Bar Soap Market Revenues & Volume By Skin/Body Care for the Period 2021- 2031
- Historical Data and Forecast of Cyprus Bar Soap Market Revenues & Volume By Facial Care for the Period 2021- 2031
- Historical Data and Forecast of Cyprus Bar Soap Market Revenues & Volume By Specialized for the Period 2021- 2031
- Historical Data and Forecast of Cyprus Bar Soap Market Revenues & Volume By Distribution Channel for the Period 2021- 2031
- Historical Data and Forecast of Cyprus Bar Soap Market Revenues & Volume By Supermarkets/Hypermarkets for the Period 2021- 2031
- Historical Data and Forecast of Cyprus Bar Soap Market Revenues & Volume By Convenience Stores for the Period 2021- 2031
- Historical Data and Forecast of Cyprus Bar Soap Market Revenues & Volume By Specialty Stores for the Period 2021- 2031
- Historical Data and Forecast of Cyprus Bar Soap Market Revenues & Volume By Online Retailers for the Period 2021- 2031
- Historical Data and Forecast of Cyprus Bar Soap Market Revenues & Volume By Others for the Period 2021- 2031
- Cyprus Bar Soap Import Export Trade Statistics
- Market Opportunity Assessment By Type
- Market Opportunity Assessment By Application
- Market Opportunity Assessment By Distribution Channel
- Cyprus Bar Soap Top Companies Market Share
- Cyprus Bar Soap Competitive Benchmarking By Technical and Operational Parameters
- Cyprus Bar Soap Company Profiles
- Cyprus Bar Soap Key Strategic Recommendations
Frequently Asked Questions About the Market Study (FAQs):
6Wresearch actively monitors the Cyprus Bar Soap Market and publishes its comprehensive annual report, highlighting emerging trends, growth drivers, revenue analysis, and forecast outlook. Our insights help businesses to make data-backed strategic decisions with ongoing market dynamics. Our analysts track relevent industries related to the Cyprus Bar Soap Market, allowing our clients with actionable intelligence and reliable forecasts tailored to emerging regional needs.
Yes, we provide customisation as per your requirements. To learn more, feel free to contact us on sales@6wresearch.com
1 Executive Summary |
2 Introduction |
2.1 Key Highlights of the Report |
2.2 Report Description |
2.3 Market Scope & Segmentation |
2.4 Research Methodology |
2.5 Assumptions |
3 Cyprus Bar Soap Market Overview |
3.1 Cyprus Country Macro Economic Indicators |
3.2 Cyprus Bar Soap Market Revenues & Volume, 2021 & 2031F |
3.3 Cyprus Bar Soap Market - Industry Life Cycle |
3.4 Cyprus Bar Soap Market - Porter's Five Forces |
3.5 Cyprus Bar Soap Market Revenues & Volume Share, By Type, 2021 & 2031F |
3.6 Cyprus Bar Soap Market Revenues & Volume Share, By Application, 2021 & 2031F |
3.7 Cyprus Bar Soap Market Revenues & Volume Share, By Distribution Channel, 2021 & 2031F |
4 Cyprus Bar Soap Market Dynamics |
4.1 Impact Analysis |
4.2 Market Drivers |
4.3 Market Restraints |
5 Cyprus Bar Soap Market Trends |
6 Cyprus Bar Soap Market, By Types |
6.1 Cyprus Bar Soap Market, By Type |
6.1.1 Overview and Analysis |
6.1.2 Cyprus Bar Soap Market Revenues & Volume, By Type, 2021- 2031F |
6.1.3 Cyprus Bar Soap Market Revenues & Volume, By Organic, 2021- 2031F |
6.1.4 Cyprus Bar Soap Market Revenues & Volume, By Synthetic, 2021- 2031F |
6.2 Cyprus Bar Soap Market, By Application |
6.2.1 Overview and Analysis |
6.2.2 Cyprus Bar Soap Market Revenues & Volume, By Hair Care, 2021- 2031F |
6.2.3 Cyprus Bar Soap Market Revenues & Volume, By Skin/Body Care, 2021- 2031F |
6.2.4 Cyprus Bar Soap Market Revenues & Volume, By Facial Care, 2021- 2031F |
6.2.5 Cyprus Bar Soap Market Revenues & Volume, By Specialized, 2021- 2031F |
6.3 Cyprus Bar Soap Market, By Distribution Channel |
6.3.1 Overview and Analysis |
6.3.2 Cyprus Bar Soap Market Revenues & Volume, By Supermarkets/Hypermarkets, 2021- 2031F |
6.3.3 Cyprus Bar Soap Market Revenues & Volume, By Convenience Stores, 2021- 2031F |
6.3.4 Cyprus Bar Soap Market Revenues & Volume, By Specialty Stores, 2021- 2031F |
6.3.5 Cyprus Bar Soap Market Revenues & Volume, By Online Retailers, 2021- 2031F |
6.3.6 Cyprus Bar Soap Market Revenues & Volume, By Others, 2021- 2031F |
7 Cyprus Bar Soap Market Import-Export Trade Statistics |
7.1 Cyprus Bar Soap Market Export to Major Countries |
7.2 Cyprus Bar Soap Market Imports from Major Countries |
8 Cyprus Bar Soap Market Key Performance Indicators |
9 Cyprus Bar Soap Market - Opportunity Assessment |
9.1 Cyprus Bar Soap Market Opportunity Assessment, By Type, 2021 & 2031F |
9.2 Cyprus Bar Soap Market Opportunity Assessment, By Application, 2021 & 2031F |
9.3 Cyprus Bar Soap Market Opportunity Assessment, By Distribution Channel, 2021 & 2031F |
10 Cyprus Bar Soap Market - Competitive Landscape |
10.1 Cyprus Bar Soap Market Revenue Share, By Companies, 2024 |
10.2 Cyprus Bar Soap Market Competitive Benchmarking, By Operating and Technical Parameters |
11 Company Profiles |
12 Recommendations |
13 Disclaimer |
Global Go To Market Strategy - 2030
Export potential enables firms to identify high-growth global markets with greater confidence by combining advanced trade intelligence with a structured quantitative methodology. The framework analyzes emerging demand trends and country-level import patterns while integrating macroeconomic and trade datasets such as GDP and population forecasts, bilateral import–export flows, tariff structures, elasticity differentials between developed and developing economies, geographic distance, and import demand projections. Using weighted trade values from 2020–2024 as the base period to project country-to-country export potential for 2030, these inputs are operationalized through calculated drivers such as gravity model parameters, tariff impact factors, and projected GDP per-capita growth. Through an analysis of hidden potentials, demand hotspots, and market conditions that are most favorable to success, this method enables firms to focus on target countries, maximize returns, and global expansion with data, backed by accuracy.
By factoring in the projected importer demand gap that is currently unmet and could be potential opportunity, it identifies the potential for the Exporter (Country) among 190 countries, against the general trade analysis, which identifies the biggest importer or exporter.
To discover high-growth global markets and optimize your business strategy:
Click Here
Pricing
- Single User License$ 1,995
- Department License$ 2,400
- Site License$ 3,120
- Global License$ 3,795

Leadership Perspectives from Industry Events
Search
Thought Leadership and Analyst Meet


Our Clients
6WResearch In News
- Doha a strategic location for EV manufacturing hub: IPA Qatar
- Demand for luxury TVs surging in the GCC, says Samsung
- Empowering Growth: The Thriving Journey of Bangladesh’s Cable Industry
- Demand for luxury TVs surging in the GCC, says Samsung
- Video call with a traditional healer? Once unthinkable, it’s now common in South Africa
- Intelligent Buildings To Smooth GCC’s Path To Net Zero
Latest Reports
- New Zealand Aseptic Manufacturing Market (2026-2032)
- Netherlands Aseptic Manufacturing Market (2026-2032)
- Nauru Aseptic Manufacturing Market (2026-2032)
- Namibia Aseptic Manufacturing Market (2026-2032)
- Mozambique Aseptic Manufacturing Market (2026-2032)
- Montenegro Aseptic Manufacturing Market (2026-2032)
- Mongolia Aseptic Manufacturing Market (2026-2032)
- Monaco Aseptic Manufacturing Market (2026-2032)
- Micronesia Aseptic Manufacturing Market (2026-2032)
- Mauritius Aseptic Manufacturing Market (2026-2032)
Industry Events and Analyst Meet

HIMTEX 2026

India Refining Summit 2026

India EV Show 2026

EV tech India Expo 2026

Auto Tech Asia 2026
Whitepaper
- Middle East & Africa Commercial Security Market Click here to view more.
- Middle East & Africa Fire Safety Systems & Equipment Market Click here to view more.
- GCC Drone Market Click here to view more.
- Middle East Lighting Fixture Market Click here to view more.
- GCC Physical & Perimeter Security Market Click here to view more.