Cyprus Bio Ethanol Market (2025-2031) | Revenue, Consumer Insights, Restraints, Forecast, Trends, Competitive, Outlook, Investment Trends, Pricing Analysis, Supply, Challenges, Industry, Analysis, Value, Demand, Strategic Insights, Drivers, Strategy, Segments, Opportunities, Share, Segmentation, Competition, Companies, Growth, Size
Market Forecast By Feedstock Type (Sugarcane, Corn, Cellulosic Biomass), By Application (Fuel, Power Generation, Industrial Processes), By End User (Automotive, Energy Producers, Industrial), By Technology (Fermentation, Distillation, Enzymatic Hydrolysis), By Sustainability Factor (Renewable, Low Emissions, Sustainable) And Competitive Landscape
| Product Code: ETC11460055 | Publication Date: Apr 2025 | Updated Date: Apr 2026 | Product Type: Market Research Report | |
| Publisher: 6Wresearch | No. of Pages: 65 | No. of Figures: 34 | No. of Tables: 19 | |
Cyprus Bio Ethanol Market Size (2020-2030)
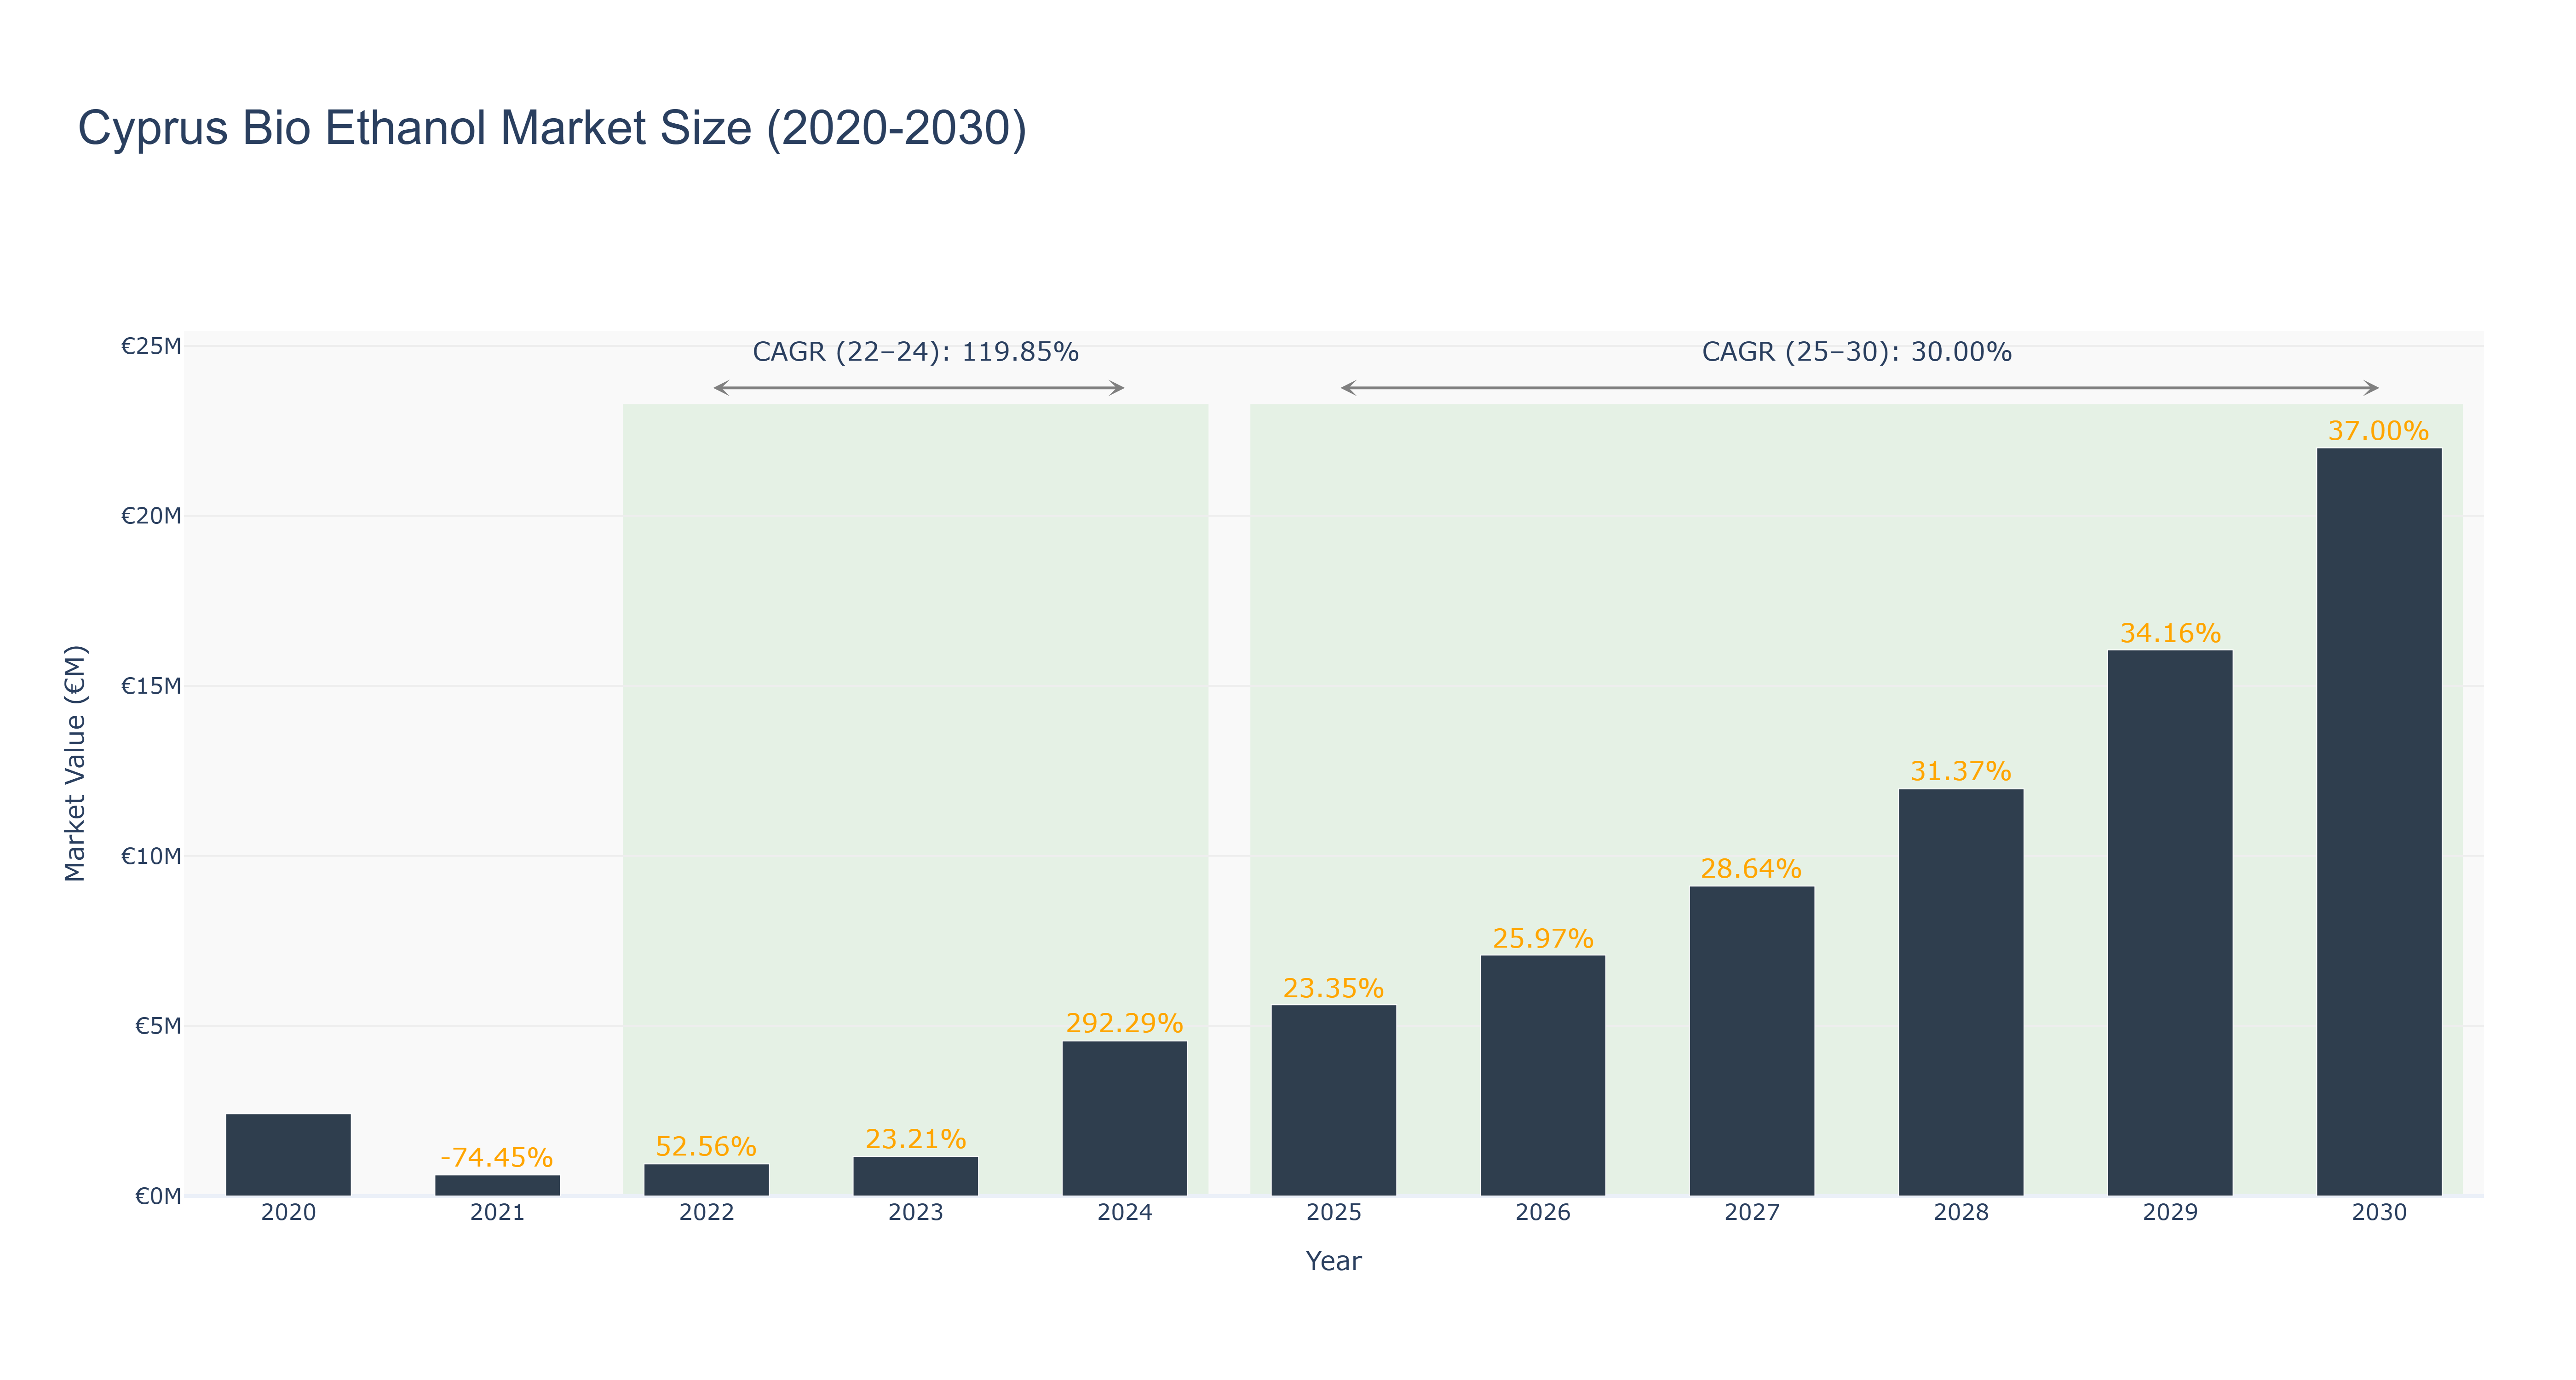
The Cyprus Bio Ethanol Market has shown a remarkable growth trend over the years. The peak market size of €22.00 million is forecasted for 2030, with a steady increase from €2.42 million in 2020. The market experienced a significant surge in 2024, reaching €4.56 million, attributed to increased demand for sustainable energy sources. The growth rate is expected to stabilize at 30.0% from 2025 to 2030, following a high CAGR of 119.85% from 2022 to 2024. Industry drivers such as government incentives for renewable energy and growing environmental awareness have propelled the market forward. Looking ahead, upcoming projects in Cyprus include the expansion of bio ethanol production facilities to meet the rising demand for eco-friendly fuel alternatives, indicating a promising future for the market.
Cyprus Bio Ethanol Market: Production & Trade Performance (2019-2025)
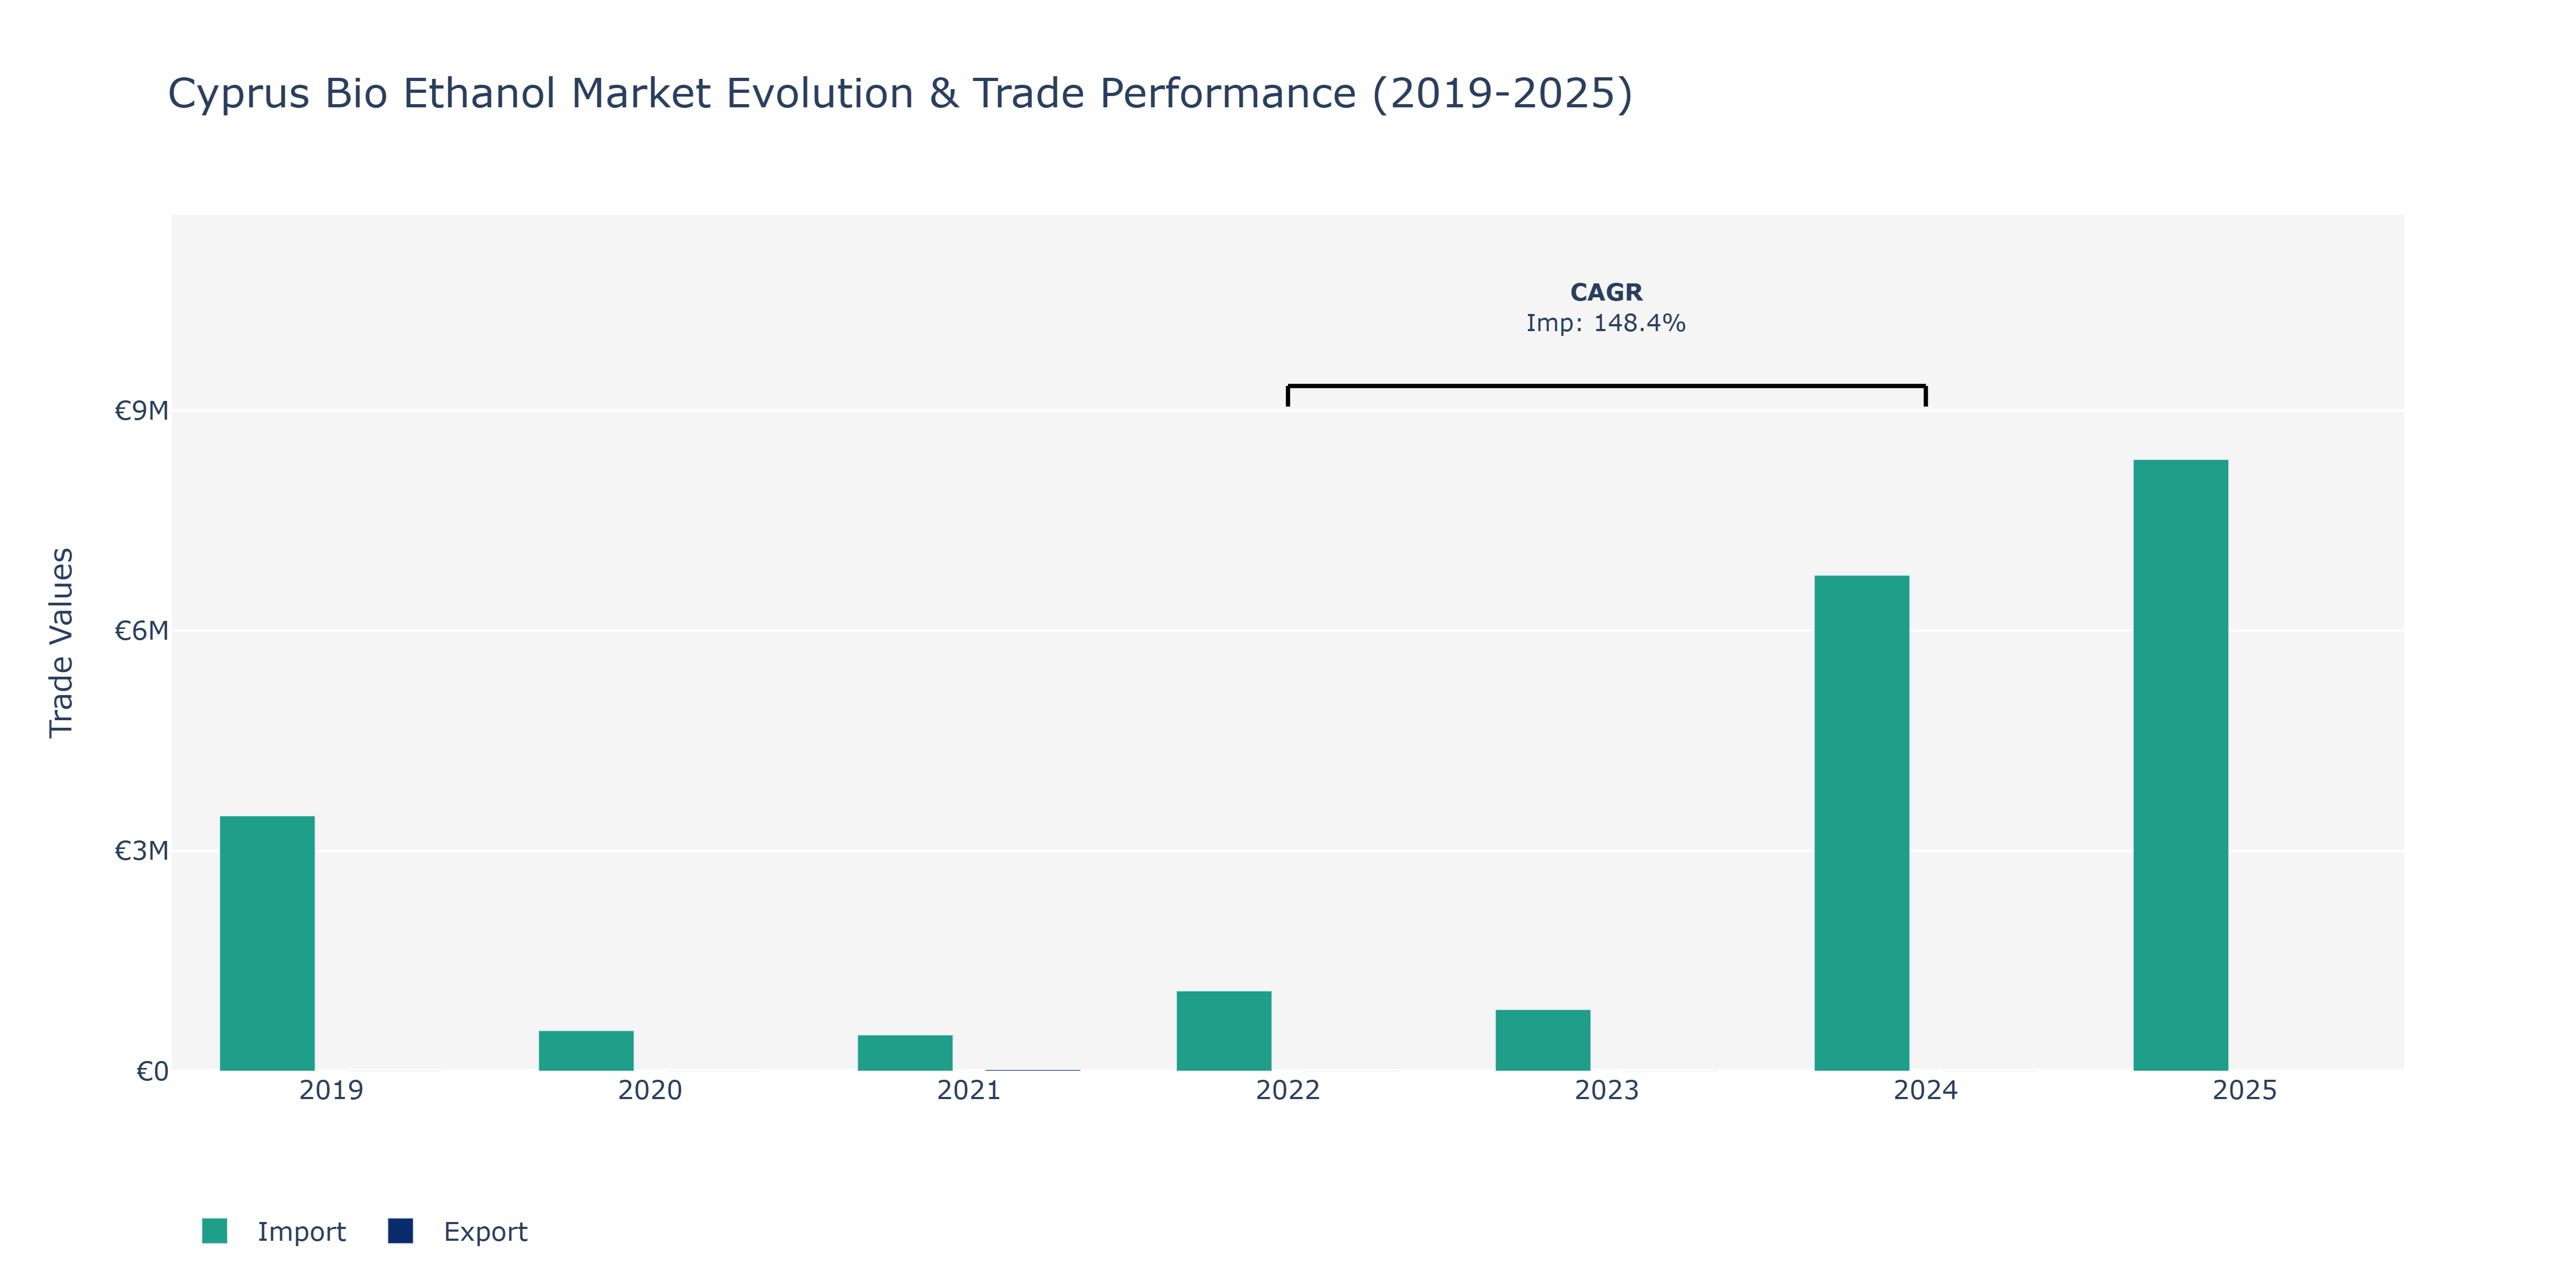
In the Cyprus Bio Ethanol Market, imports consistently dominated the trade landscape, showcasing substantial fluctuations over the years. In 2019, imports stood at €3.48 million, dropping to €0.55 million in 2020 before surging to €0.49 million in 2021. The peak import value was observed in 2025, reaching €8.33 million. This upward trend in imports reflects the growing demand for bioethanol in Cyprus, possibly driven by increasing environmental concerns and efforts to reduce carbon emissions. On the other hand, exports witnessed a fluctuating pattern with values of €1.26 thousand in 2019, dropping to €0.56 million in 2024. The decline in exports could indicate a shift in market dynamics, possibly due to local production capacity limitations or prioritization of domestic consumption. The notable increase in imports CAGR of 148.38% between 2022 and 2024 suggests a significant surge in foreign bioethanol purchases, highlighting Cyprus's reliance on international markets to meet its bioethanol needs.
Key Highlights of the Report:
- Cyprus Bio Ethanol Market Outlook
- Market Size of Cyprus Bio Ethanol Market,2024
- Forecast of Cyprus Bio Ethanol Market, 2031
- Historical Data and Forecast of Cyprus Bio Ethanol Revenues & Volume for the Period 2021-2031
- Cyprus Bio Ethanol Market Trend Evolution
- Cyprus Bio Ethanol Market Drivers and Challenges
- Cyprus Bio Ethanol Price Trends
- Cyprus Bio Ethanol Porter's Five Forces
- Cyprus Bio Ethanol Industry Life Cycle
- Historical Data and Forecast of Cyprus Bio Ethanol Market Revenues & Volume By Feedstock Type for the Period 2021-2031
- Historical Data and Forecast of Cyprus Bio Ethanol Market Revenues & Volume By Sugarcane for the Period 2021-2031
- Historical Data and Forecast of Cyprus Bio Ethanol Market Revenues & Volume By Corn for the Period 2021-2031
- Historical Data and Forecast of Cyprus Bio Ethanol Market Revenues & Volume By Cellulosic Biomass for the Period 2021-2031
- Historical Data and Forecast of Cyprus Bio Ethanol Market Revenues & Volume By Application for the Period 2021-2031
- Historical Data and Forecast of Cyprus Bio Ethanol Market Revenues & Volume By Fuel for the Period 2021-2031
- Historical Data and Forecast of Cyprus Bio Ethanol Market Revenues & Volume By Power Generation for the Period 2021-2031
- Historical Data and Forecast of Cyprus Bio Ethanol Market Revenues & Volume By Industrial Processes for the Period 2021-2031
- Historical Data and Forecast of Cyprus Bio Ethanol Market Revenues & Volume By End User for the Period 2021-2031
- Historical Data and Forecast of Cyprus Bio Ethanol Market Revenues & Volume By Automotive for the Period 2021-2031
- Historical Data and Forecast of Cyprus Bio Ethanol Market Revenues & Volume By Energy Producers for the Period 2021-2031
- Historical Data and Forecast of Cyprus Bio Ethanol Market Revenues & Volume By Industrial for the Period 2021-2031
- Historical Data and Forecast of Cyprus Bio Ethanol Market Revenues & Volume By Technology for the Period 2021-2031
- Historical Data and Forecast of Cyprus Bio Ethanol Market Revenues & Volume By Fermentation for the Period 2021-2031
- Historical Data and Forecast of Cyprus Bio Ethanol Market Revenues & Volume By Distillation for the Period 2021-2031
- Historical Data and Forecast of Cyprus Bio Ethanol Market Revenues & Volume By Enzymatic Hydrolysis for the Period 2021-2031
- Historical Data and Forecast of Cyprus Bio Ethanol Market Revenues & Volume By Sustainability Factor for the Period 2021-2031
- Historical Data and Forecast of Cyprus Bio Ethanol Market Revenues & Volume By Renewable for the Period 2021-2031
- Historical Data and Forecast of Cyprus Bio Ethanol Market Revenues & Volume By Low Emissions for the Period 2021-2031
- Historical Data and Forecast of Cyprus Bio Ethanol Market Revenues & Volume By Sustainable for the Period 2021-2031
- Cyprus Bio Ethanol Import Export Trade Statistics
- Market Opportunity Assessment By Feedstock Type
- Market Opportunity Assessment By Application
- Market Opportunity Assessment By End User
- Market Opportunity Assessment By Technology
- Market Opportunity Assessment By Sustainability Factor
- Cyprus Bio Ethanol Top Companies Market Share
- Cyprus Bio Ethanol Competitive Benchmarking By Technical and Operational Parameters
- Cyprus Bio Ethanol Company Profiles
- Cyprus Bio Ethanol Key Strategic Recommendations
Frequently Asked Questions About the Market Study (FAQs):
6Wresearch actively monitors the Cyprus Bio Ethanol Market and publishes its comprehensive annual report, highlighting emerging trends, growth drivers, revenue analysis, and forecast outlook. Our insights help businesses to make data-backed strategic decisions with ongoing market dynamics. Our analysts track relevent industries related to the Cyprus Bio Ethanol Market, allowing our clients with actionable intelligence and reliable forecasts tailored to emerging regional needs.
Yes, we provide customisation as per your requirements. To learn more, feel free to contact us on sales@6wresearch.com
1 Executive Summary |
2 Introduction |
2.1 Key Highlights of the Report |
2.2 Report Description |
2.3 Market Scope & Segmentation |
2.4 Research Methodology |
2.5 Assumptions |
3 Cyprus Bio Ethanol Market Overview |
3.1 Cyprus Country Macro Economic Indicators |
3.2 Cyprus Bio Ethanol Market Revenues & Volume, 2021 & 2031F |
3.3 Cyprus Bio Ethanol Market - Industry Life Cycle |
3.4 Cyprus Bio Ethanol Market - Porter's Five Forces |
3.5 Cyprus Bio Ethanol Market Revenues & Volume Share, By Feedstock Type, 2021 & 2031F |
3.6 Cyprus Bio Ethanol Market Revenues & Volume Share, By Application, 2021 & 2031F |
3.7 Cyprus Bio Ethanol Market Revenues & Volume Share, By End User, 2021 & 2031F |
3.8 Cyprus Bio Ethanol Market Revenues & Volume Share, By Technology, 2021 & 2031F |
3.9 Cyprus Bio Ethanol Market Revenues & Volume Share, By Sustainability Factor, 2021 & 2031F |
4 Cyprus Bio Ethanol Market Dynamics |
4.1 Impact Analysis |
4.2 Market Drivers |
4.3 Market Restraints |
5 Cyprus Bio Ethanol Market Trends |
6 Cyprus Bio Ethanol Market, By Types |
6.1 Cyprus Bio Ethanol Market, By Feedstock Type |
6.1.1 Overview and Analysis |
6.1.2 Cyprus Bio Ethanol Market Revenues & Volume, By Feedstock Type, 2021 - 2031F |
6.1.3 Cyprus Bio Ethanol Market Revenues & Volume, By Sugarcane, 2021 - 2031F |
6.1.4 Cyprus Bio Ethanol Market Revenues & Volume, By Corn, 2021 - 2031F |
6.1.5 Cyprus Bio Ethanol Market Revenues & Volume, By Cellulosic Biomass, 2021 - 2031F |
6.2 Cyprus Bio Ethanol Market, By Application |
6.2.1 Overview and Analysis |
6.2.2 Cyprus Bio Ethanol Market Revenues & Volume, By Fuel, 2021 - 2031F |
6.2.3 Cyprus Bio Ethanol Market Revenues & Volume, By Power Generation, 2021 - 2031F |
6.2.4 Cyprus Bio Ethanol Market Revenues & Volume, By Industrial Processes, 2021 - 2031F |
6.3 Cyprus Bio Ethanol Market, By End User |
6.3.1 Overview and Analysis |
6.3.2 Cyprus Bio Ethanol Market Revenues & Volume, By Automotive, 2021 - 2031F |
6.3.3 Cyprus Bio Ethanol Market Revenues & Volume, By Energy Producers, 2021 - 2031F |
6.3.4 Cyprus Bio Ethanol Market Revenues & Volume, By Industrial, 2021 - 2031F |
6.4 Cyprus Bio Ethanol Market, By Technology |
6.4.1 Overview and Analysis |
6.4.2 Cyprus Bio Ethanol Market Revenues & Volume, By Fermentation, 2021 - 2031F |
6.4.3 Cyprus Bio Ethanol Market Revenues & Volume, By Distillation, 2021 - 2031F |
6.4.4 Cyprus Bio Ethanol Market Revenues & Volume, By Enzymatic Hydrolysis, 2021 - 2031F |
6.5 Cyprus Bio Ethanol Market, By Sustainability Factor |
6.5.1 Overview and Analysis |
6.5.2 Cyprus Bio Ethanol Market Revenues & Volume, By Renewable, 2021 - 2031F |
6.5.3 Cyprus Bio Ethanol Market Revenues & Volume, By Low Emissions, 2021 - 2031F |
6.5.4 Cyprus Bio Ethanol Market Revenues & Volume, By Sustainable, 2021 - 2031F |
7 Cyprus Bio Ethanol Market Import-Export Trade Statistics |
7.1 Cyprus Bio Ethanol Market Export to Major Countries |
7.2 Cyprus Bio Ethanol Market Imports from Major Countries |
8 Cyprus Bio Ethanol Market Key Performance Indicators |
9 Cyprus Bio Ethanol Market - Opportunity Assessment |
9.1 Cyprus Bio Ethanol Market Opportunity Assessment, By Feedstock Type, 2021 & 2031F |
9.2 Cyprus Bio Ethanol Market Opportunity Assessment, By Application, 2021 & 2031F |
9.3 Cyprus Bio Ethanol Market Opportunity Assessment, By End User, 2021 & 2031F |
9.4 Cyprus Bio Ethanol Market Opportunity Assessment, By Technology, 2021 & 2031F |
9.5 Cyprus Bio Ethanol Market Opportunity Assessment, By Sustainability Factor, 2021 & 2031F |
10 Cyprus Bio Ethanol Market - Competitive Landscape |
10.1 Cyprus Bio Ethanol Market Revenue Share, By Companies, 2024 |
10.2 Cyprus Bio Ethanol Market Competitive Benchmarking, By Operating and Technical Parameters |
11 Company Profiles |
12 Recommendations |
13 Disclaimer |
Export potential assessment - trade Analytics for 2030
Export potential enables firms to identify high-growth global markets with greater confidence by combining advanced trade intelligence with a structured quantitative methodology. The framework analyzes emerging demand trends and country-level import patterns while integrating macroeconomic and trade datasets such as GDP and population forecasts, bilateral import–export flows, tariff structures, elasticity differentials between developed and developing economies, geographic distance, and import demand projections. Using weighted trade values from 2020–2024 as the base period to project country-to-country export potential for 2030, these inputs are operationalized through calculated drivers such as gravity model parameters, tariff impact factors, and projected GDP per-capita growth. Through an analysis of hidden potentials, demand hotspots, and market conditions that are most favorable to success, this method enables firms to focus on target countries, maximize returns, and global expansion with data, backed by accuracy.
By factoring in the projected importer demand gap that is currently unmet and could be potential opportunity, it identifies the potential for the Exporter (Country) among 190 countries, against the general trade analysis, which identifies the biggest importer or exporter.
To discover high-growth global markets and optimize your business strategy:
Click Here
Pricing
- Single User License$ 1,995
- Department License$ 2,400
- Site License$ 3,120
- Global License$ 3,795

Search
Thought Leadership and Analyst Meet


Our Clients
Latest Reports
- Philippines Polyhydroxybutyrate-co-Hydroxyvalerate Market (2026-2032) | Trends, Insights, Challenges, Restraints, Competition, Size, Value, Forecast, Pricing, Share, Outlook, Revenue, Investment Opportunities, Strategy, Drivers, Demand, Growth, segmentation, Analysis, Companies
- Peru Polyhydroxybutyrate-co-Hydroxyvalerate Market (2026-2032) | Growth, Demand, Challenges, Share, Trends, Analysis, Pricing, Investment Opportunities, Drivers, Value, Forecast, Competition, Size, Companies, Insights, Outlook, Restraints, segmentation, Revenue, Strategy
- Pakistan Polyhydroxybutyrate-co-Hydroxyvalerate Market (2026-2032) | Restraints, segmentation, Pricing, Forecast, Share, Strategy, Competition, Trends, Insights, Drivers, Challenges, Growth, Revenue, Outlook, Value, Investment Opportunities, Companies, Size, Analysis, Demand
- Oman Polyhydroxybutyrate-co-Hydroxyvalerate Market (2026-2032) | Drivers, segmentation, Insights, Competition, Pricing, Outlook, Size, Revenue, Challenges, Forecast, Analysis, Growth, Value, Share, Trends, Investment Opportunities, Strategy, Restraints, Companies, Demand
- Nigeria Polyhydroxybutyrate-co-Hydroxyvalerate Market (2026-2032) | Value, Investment Opportunities, Analysis, Revenue, Restraints, Pricing, Outlook, Competition, Demand, Growth, Forecast, Companies, Trends, Challenges, segmentation, Drivers, Insights, Share, Size, Strategy
- Nepal Polyhydroxybutyrate-co-Hydroxyvalerate Market (2026-2032) | Insights, Analysis, Drivers, Share, Revenue, Demand, segmentation, Investment Opportunities, Competition, Forecast, Growth, Pricing, Companies, Strategy, Trends, Restraints, Challenges, Outlook, Size, Value
- Myanmar Polyhydroxybutyrate-co-Hydroxyvalerate Market (2026-2032) | Outlook, Revenue, Strategy, Restraints, Drivers, segmentation, Share, Forecast, Competition, Insights, Growth, Pricing, Size, Demand, Value, Companies, Trends, Challenges, Investment Opportunities, Analysis
- Morocco Polyhydroxybutyrate-co-Hydroxyvalerate Market (2026-2032) | Outlook, Investment Opportunities, Restraints, Strategy, Forecast, Challenges, Drivers, Growth, Companies, segmentation, Trends, Size, Competition, Revenue, Demand, Insights, Share, Analysis, Value, Pricing
- Mexico Polyhydroxybutyrate-co-Hydroxyvalerate Market (2026-2032) | Size, Drivers, Outlook, Share, Strategy, Growth, Pricing, Challenges, Companies, Demand, Value, Investment Opportunities, Restraints, Trends, Forecast, segmentation, Analysis, Insights, Competition, Revenue
- Malaysia Polyhydroxybutyrate-co-Hydroxyvalerate Market (2026-2032) | Share, segmentation, Size, Companies, Analysis, Insights, Forecast, Value, Revenue, Drivers, Restraints, Challenges, Investment Opportunities, Trends, Competition, Strategy, Demand, Growth, Outlook, Pricing
Industry Events and Analyst Meet

HIMTEX 2026

India Refining Summit 2026

India EV Show 2026

EV tech India Expo 2026

Auto Tech Asia 2026
Whitepaper
- Middle East & Africa Commercial Security Market Click here to view more.
- Middle East & Africa Fire Safety Systems & Equipment Market Click here to view more.
- GCC Drone Market Click here to view more.
- Middle East Lighting Fixture Market Click here to view more.
- GCC Physical & Perimeter Security Market Click here to view more.
6WResearch In News
- Doha a strategic location for EV manufacturing hub: IPA Qatar
- Demand for luxury TVs surging in the GCC, says Samsung
- Empowering Growth: The Thriving Journey of Bangladesh’s Cable Industry
- Demand for luxury TVs surging in the GCC, says Samsung
- Video call with a traditional healer? Once unthinkable, it’s now common in South Africa
- Intelligent Buildings To Smooth GCC’s Path To Net Zero