Cyprus Porcelain Tableware Market (2025-2031) | Trends, Growth, Companies, Industry, Outlook, Value, Analysis, Segmentation, Size & Revenue, Share, Forecast, Competitive Landscape
Market Forecast By Product Type (Dinnerware, Drinkware, Others), By Price (Low, Medium, High), By End- use (Residential, Commercial, Others) And Competitive Landscape
| Product Code: ETC6902652 | Publication Date: Sep 2024 | Updated Date: Apr 2026 | Product Type: Market Research Report | |
| Publisher: 6Wresearch | Author: Shubham Padhi | No. of Pages: 75 | No. of Figures: 35 | No. of Tables: 20 |
Cyprus Porcelain Tableware Market Size (2020-2030)
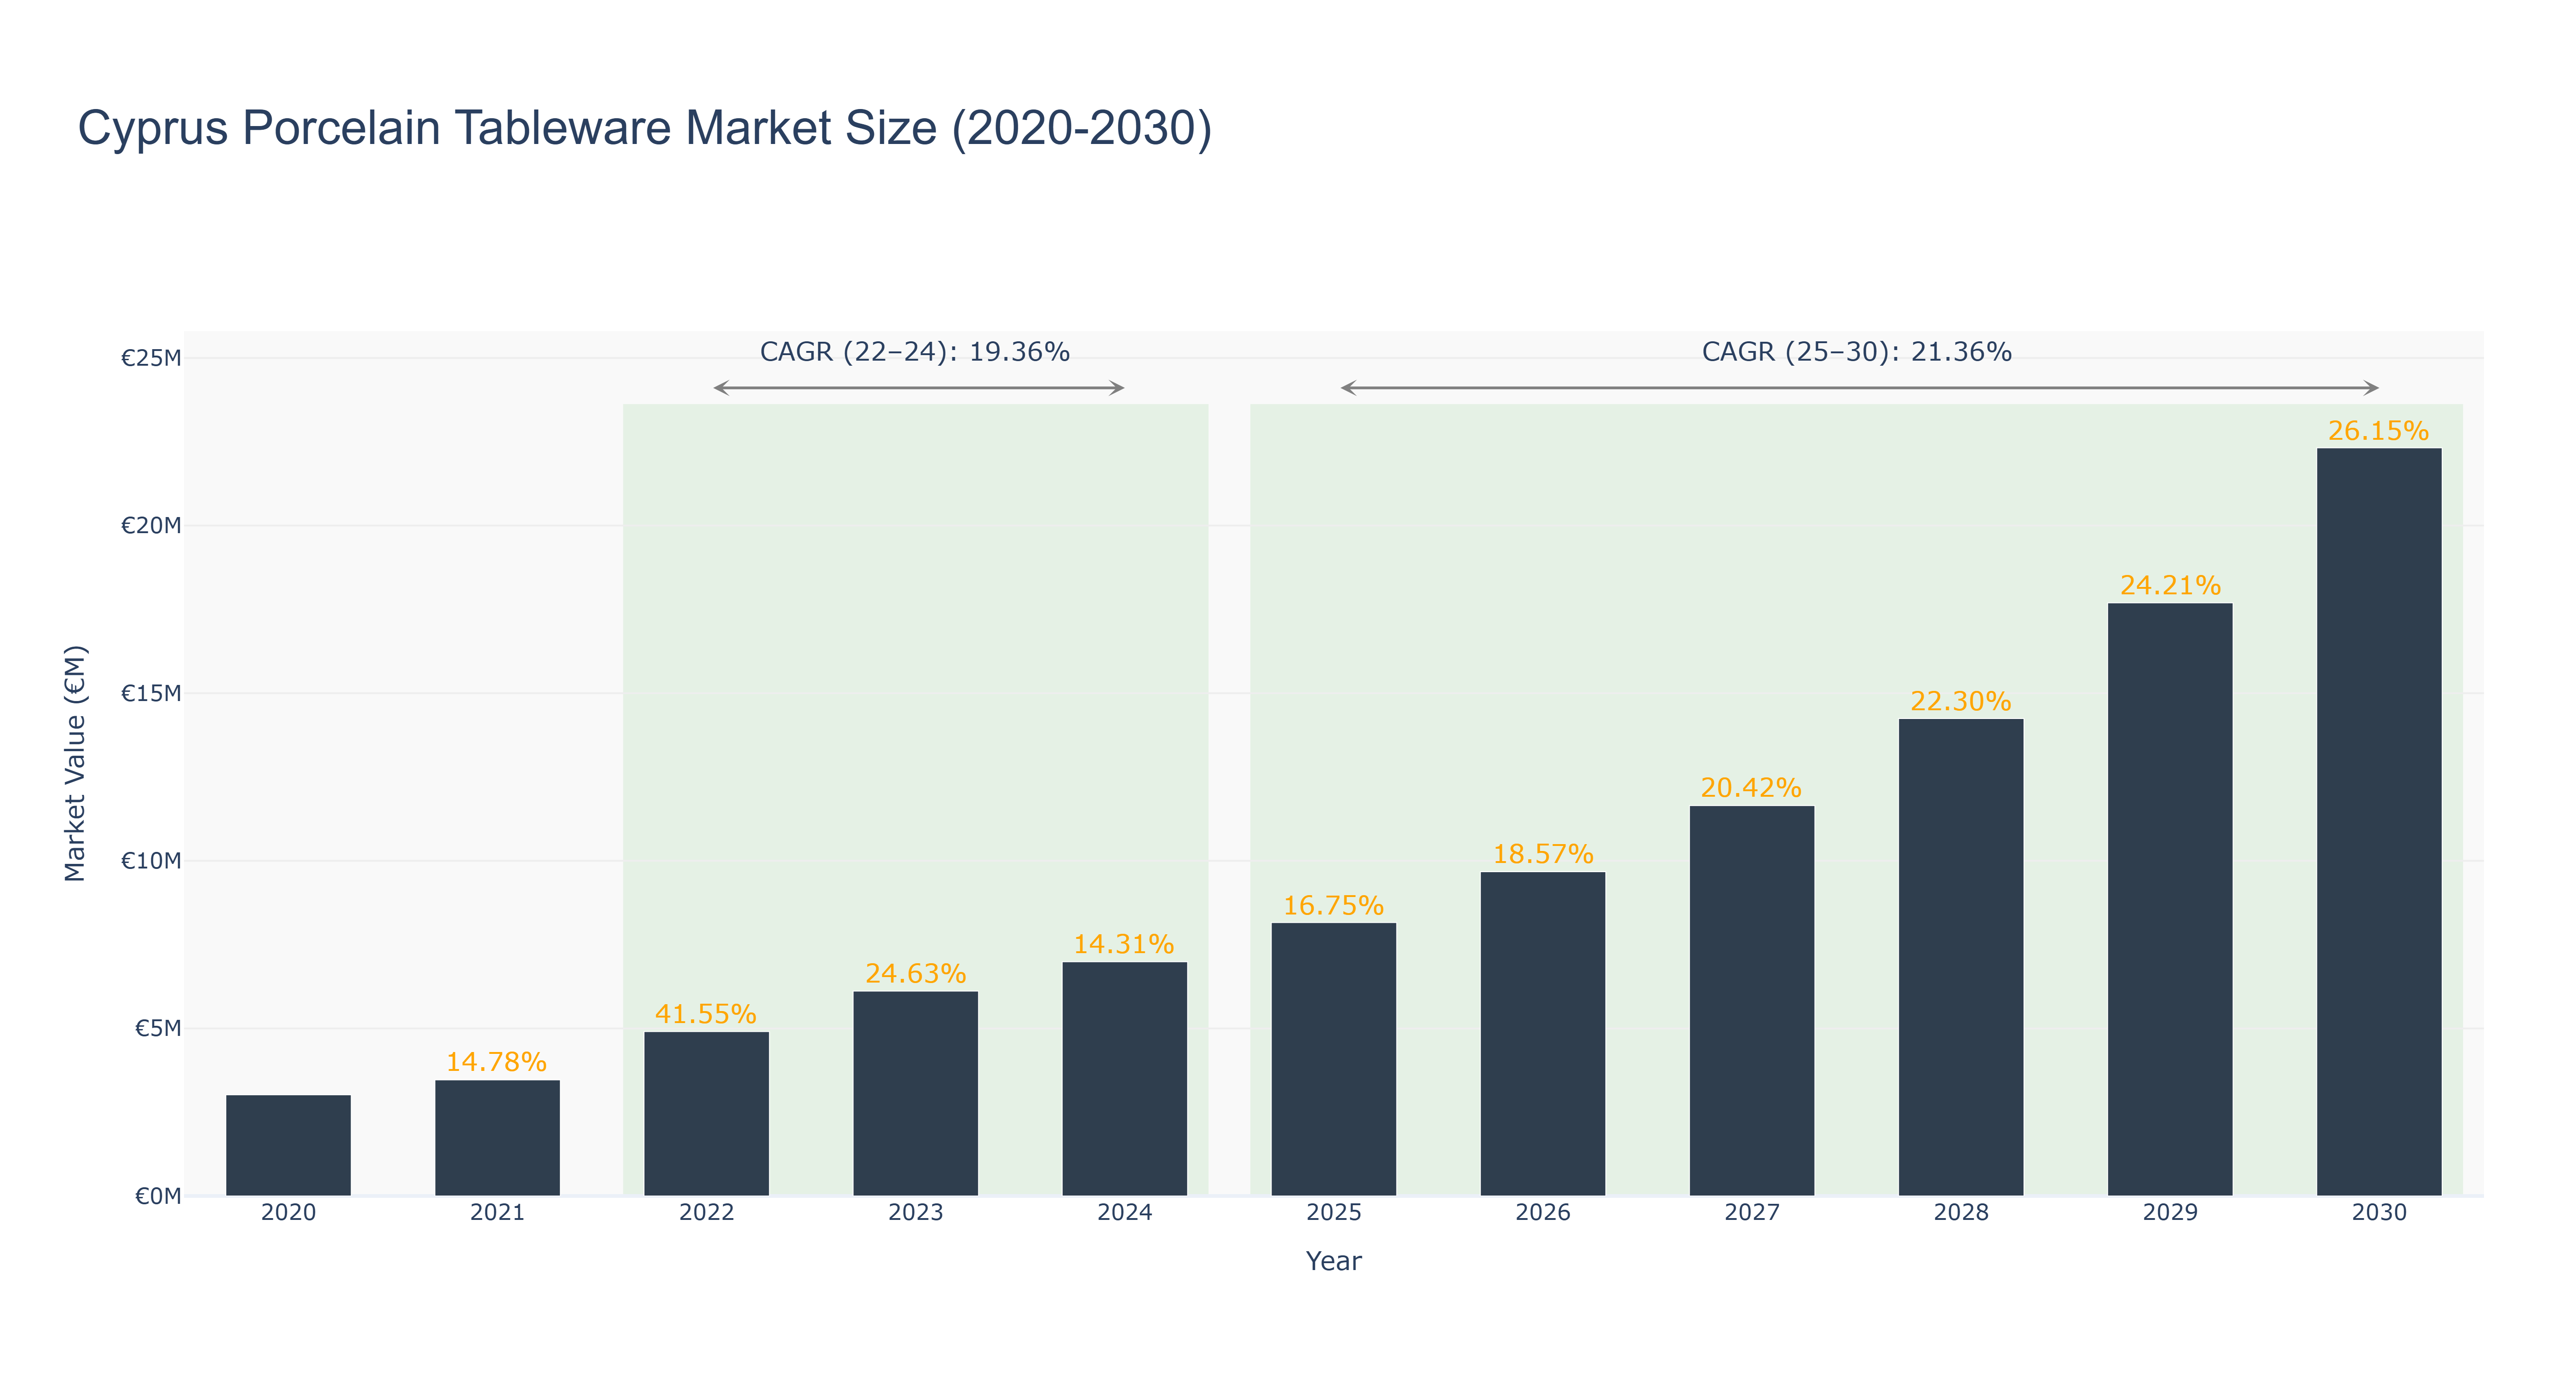
Cyprus Porcelain Tableware Market has shown a steady growth trajectory over the years. The market peaked at €22.32 million in 2030, with a notable CAGR of 21.36% from 2025 to 2030. The actual market size saw consistent increases from €3.02 million in 2020 to €6.99 million in 2024, driven by rising consumer demand and expanding product offerings. The forecasted growth is attributed to evolving consumer preferences and increased disposable income, indicating a promising future for the market. Recent developments in the market include collaborations with local artisans to create unique designs and sustainable practices, enhancing the market's appeal and competitiveness. Moving forward, investments in digital marketing strategies and product innovation are expected to further propel market growth. Industry drivers include a growing trend towards luxury dining experiences, increased focus on home aesthetics, and a rise in tourism boosting demand for high-quality tableware products.
Cyprus Porcelain Tableware Market: Production & Trade Performance (2019-2025)
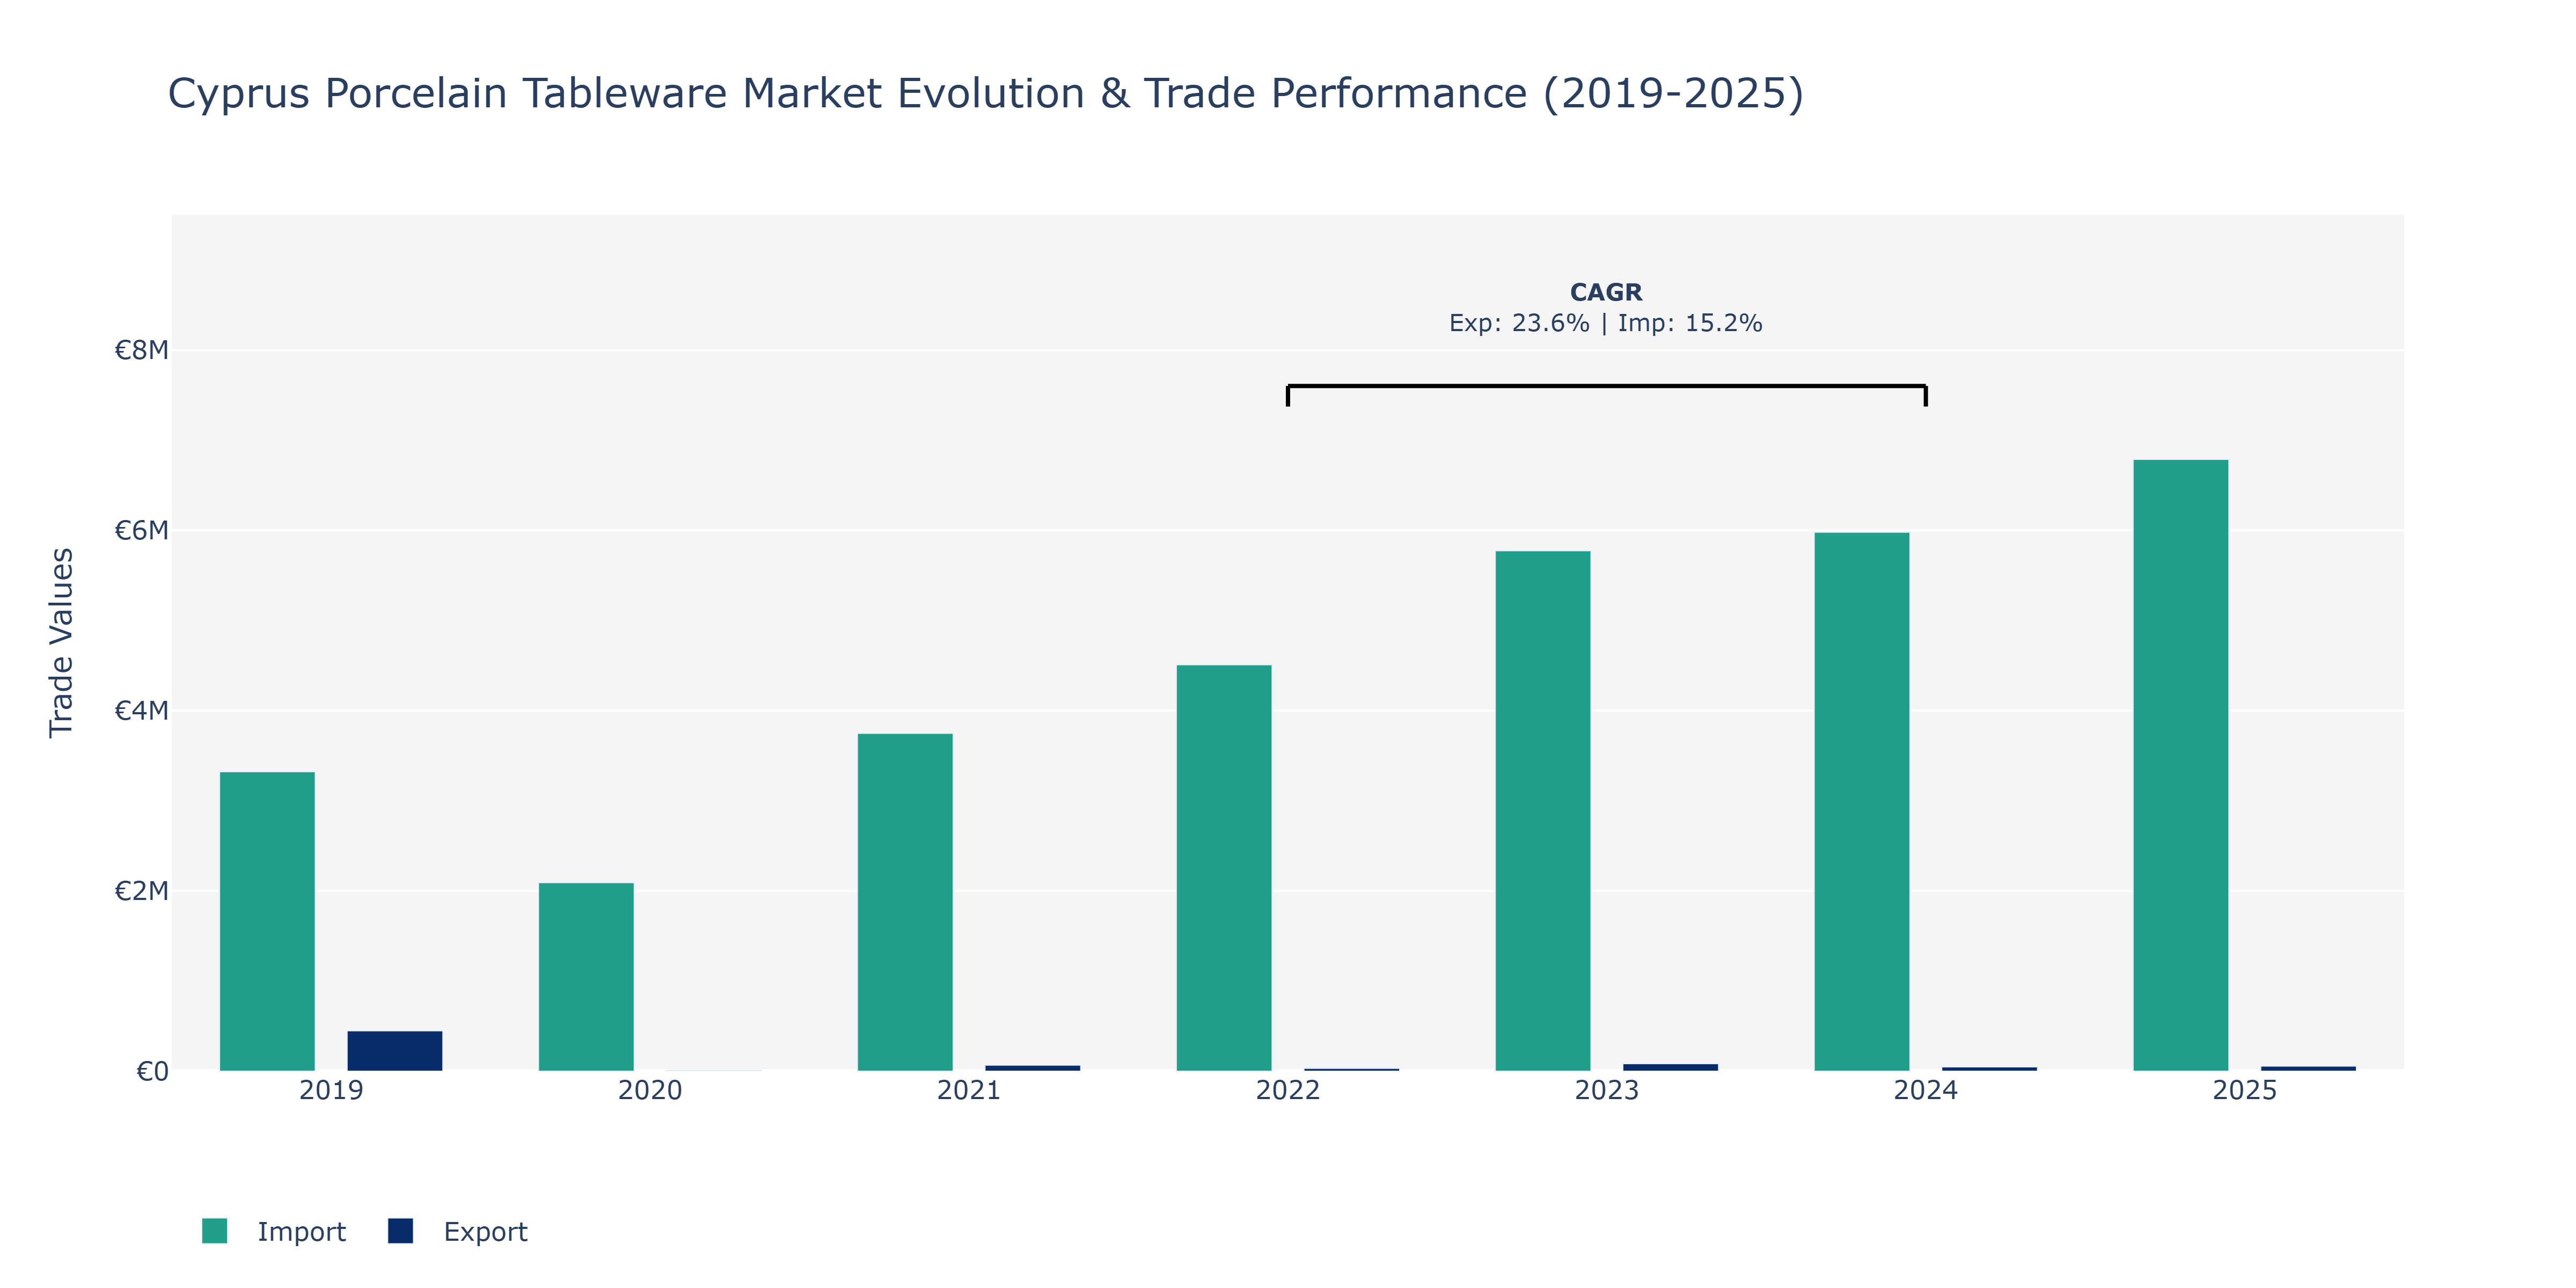
The Cyprus Porcelain Tableware Market witnessed notable fluctuations in Exports and Imports from 2019 to 2025. Exports started at €448.6 thousand in 2019, experienced a sharp decline to €9.93 thousand in 2020, and gradually increased thereafter, reaching €56.46 thousand in 2025. Conversely, Imports grew consistently from €3.32 million in 2019 to €6.79 million in 2025. One of the peak points for Exports was in 2023, with €82.64 thousand, while Imports peaked in 2025 at €6.79 million. The rise in Exports could be attributed to the increasing demand for Cyprus Porcelain Tableware in international markets, possibly driven by innovative product designs and effective marketing strategies. On the other hand, the upward trend in Imports may reflect a growing preference for high-quality raw materials or finished products from overseas manufacturers, indicating a shift towards more diverse product offerings and customization options in the local market. The CAGR values further validate the positive growth trajectory observed in both Exports and Imports, showcasing a promising outlook for the Cyprus Porcelain Tableware Market.
Key Highlights of the Report:
- Cyprus Porcelain Tableware Market Outlook
- Market Size of Cyprus Porcelain Tableware Market, 2024
- Forecast of Cyprus Porcelain Tableware Market, 2031
- Historical Data and Forecast of Cyprus Porcelain Tableware Revenues & Volume for the Period 2021- 2031
- Cyprus Porcelain Tableware Market Trend Evolution
- Cyprus Porcelain Tableware Market Drivers and Challenges
- Cyprus Porcelain Tableware Price Trends
- Cyprus Porcelain Tableware Porter's Five Forces
- Cyprus Porcelain Tableware Industry Life Cycle
- Historical Data and Forecast of Cyprus Porcelain Tableware Market Revenues & Volume By Product Type for the Period 2021- 2031
- Historical Data and Forecast of Cyprus Porcelain Tableware Market Revenues & Volume By Dinnerware for the Period 2021- 2031
- Historical Data and Forecast of Cyprus Porcelain Tableware Market Revenues & Volume By Drinkware for the Period 2021- 2031
- Historical Data and Forecast of Cyprus Porcelain Tableware Market Revenues & Volume By Others for the Period 2021- 2031
- Historical Data and Forecast of Cyprus Porcelain Tableware Market Revenues & Volume By Price for the Period 2021- 2031
- Historical Data and Forecast of Cyprus Porcelain Tableware Market Revenues & Volume By Low for the Period 2021- 2031
- Historical Data and Forecast of Cyprus Porcelain Tableware Market Revenues & Volume By Medium for the Period 2021- 2031
- Historical Data and Forecast of Cyprus Porcelain Tableware Market Revenues & Volume By High for the Period 2021- 2031
- Historical Data and Forecast of Cyprus Porcelain Tableware Market Revenues & Volume By End- use for the Period 2021- 2031
- Historical Data and Forecast of Cyprus Porcelain Tableware Market Revenues & Volume By Residential for the Period 2021- 2031
- Historical Data and Forecast of Cyprus Porcelain Tableware Market Revenues & Volume By Commercial for the Period 2021- 2031
- Historical Data and Forecast of Cyprus Porcelain Tableware Market Revenues & Volume By Others for the Period 2021- 2031
- Cyprus Porcelain Tableware Import Export Trade Statistics
- Market Opportunity Assessment By Product Type
- Market Opportunity Assessment By Price
- Market Opportunity Assessment By End- use
- Cyprus Porcelain Tableware Top Companies Market Share
- Cyprus Porcelain Tableware Competitive Benchmarking By Technical and Operational Parameters
- Cyprus Porcelain Tableware Company Profiles
- Cyprus Porcelain Tableware Key Strategic Recommendations
Frequently Asked Questions About the Market Study (FAQs):
6Wresearch actively monitors the Cyprus Porcelain Tableware Market and publishes its comprehensive annual report, highlighting emerging trends, growth drivers, revenue analysis, and forecast outlook. Our insights help businesses to make data-backed strategic decisions with ongoing market dynamics. Our analysts track relevent industries related to the Cyprus Porcelain Tableware Market, allowing our clients with actionable intelligence and reliable forecasts tailored to emerging regional needs.
Yes, we provide customisation as per your requirements. To learn more, feel free to contact us on sales@6wresearch.com
1 Executive Summary |
2 Introduction |
2.1 Key Highlights of the Report |
2.2 Report Description |
2.3 Market Scope & Segmentation |
2.4 Research Methodology |
2.5 Assumptions |
3 Cyprus Porcelain Tableware Market Overview |
3.1 Cyprus Country Macro Economic Indicators |
3.2 Cyprus Porcelain Tableware Market Revenues & Volume, 2021 & 2031F |
3.3 Cyprus Porcelain Tableware Market - Industry Life Cycle |
3.4 Cyprus Porcelain Tableware Market - Porter's Five Forces |
3.5 Cyprus Porcelain Tableware Market Revenues & Volume Share, By Product Type, 2021 & 2031F |
3.6 Cyprus Porcelain Tableware Market Revenues & Volume Share, By Price, 2021 & 2031F |
3.7 Cyprus Porcelain Tableware Market Revenues & Volume Share, By End- use, 2021 & 2031F |
4 Cyprus Porcelain Tableware Market Dynamics |
4.1 Impact Analysis |
4.2 Market Drivers |
4.3 Market Restraints |
5 Cyprus Porcelain Tableware Market Trends |
6 Cyprus Porcelain Tableware Market, By Types |
6.1 Cyprus Porcelain Tableware Market, By Product Type |
6.1.1 Overview and Analysis |
6.1.2 Cyprus Porcelain Tableware Market Revenues & Volume, By Product Type, 2021- 2031F |
6.1.3 Cyprus Porcelain Tableware Market Revenues & Volume, By Dinnerware, 2021- 2031F |
6.1.4 Cyprus Porcelain Tableware Market Revenues & Volume, By Drinkware, 2021- 2031F |
6.1.5 Cyprus Porcelain Tableware Market Revenues & Volume, By Others, 2021- 2031F |
6.2 Cyprus Porcelain Tableware Market, By Price |
6.2.1 Overview and Analysis |
6.2.2 Cyprus Porcelain Tableware Market Revenues & Volume, By Low, 2021- 2031F |
6.2.3 Cyprus Porcelain Tableware Market Revenues & Volume, By Medium, 2021- 2031F |
6.2.4 Cyprus Porcelain Tableware Market Revenues & Volume, By High, 2021- 2031F |
6.3 Cyprus Porcelain Tableware Market, By End- use |
6.3.1 Overview and Analysis |
6.3.2 Cyprus Porcelain Tableware Market Revenues & Volume, By Residential, 2021- 2031F |
6.3.3 Cyprus Porcelain Tableware Market Revenues & Volume, By Commercial, 2021- 2031F |
6.3.4 Cyprus Porcelain Tableware Market Revenues & Volume, By Others, 2021- 2031F |
7 Cyprus Porcelain Tableware Market Import-Export Trade Statistics |
7.1 Cyprus Porcelain Tableware Market Export to Major Countries |
7.2 Cyprus Porcelain Tableware Market Imports from Major Countries |
8 Cyprus Porcelain Tableware Market Key Performance Indicators |
9 Cyprus Porcelain Tableware Market - Opportunity Assessment |
9.1 Cyprus Porcelain Tableware Market Opportunity Assessment, By Product Type, 2021 & 2031F |
9.2 Cyprus Porcelain Tableware Market Opportunity Assessment, By Price, 2021 & 2031F |
9.3 Cyprus Porcelain Tableware Market Opportunity Assessment, By End- use, 2021 & 2031F |
10 Cyprus Porcelain Tableware Market - Competitive Landscape |
10.1 Cyprus Porcelain Tableware Market Revenue Share, By Companies, 2024 |
10.2 Cyprus Porcelain Tableware Market Competitive Benchmarking, By Operating and Technical Parameters |
11 Company Profiles |
12 Recommendations |
13 Disclaimer |
Global Go To Market Strategy - 2030
Export potential enables firms to identify high-growth global markets with greater confidence by combining advanced trade intelligence with a structured quantitative methodology. The framework analyzes emerging demand trends and country-level import patterns while integrating macroeconomic and trade datasets such as GDP and population forecasts, bilateral import–export flows, tariff structures, elasticity differentials between developed and developing economies, geographic distance, and import demand projections. Using weighted trade values from 2020–2024 as the base period to project country-to-country export potential for 2030, these inputs are operationalized through calculated drivers such as gravity model parameters, tariff impact factors, and projected GDP per-capita growth. Through an analysis of hidden potentials, demand hotspots, and market conditions that are most favorable to success, this method enables firms to focus on target countries, maximize returns, and global expansion with data, backed by accuracy.
By factoring in the projected importer demand gap that is currently unmet and could be potential opportunity, it identifies the potential for the Exporter (Country) among 190 countries, against the general trade analysis, which identifies the biggest importer or exporter.
To discover high-growth global markets and optimize your business strategy:
Click Here
Pricing
- Single User License$ 1,995
- Department License$ 2,400
- Site License$ 3,120
- Global License$ 3,795

Leadership Perspectives from Industry Events
Search
Thought Leadership and Analyst Meet


Our Clients
6WResearch In News
- Doha a strategic location for EV manufacturing hub: IPA Qatar
- Demand for luxury TVs surging in the GCC, says Samsung
- Empowering Growth: The Thriving Journey of Bangladesh’s Cable Industry
- Demand for luxury TVs surging in the GCC, says Samsung
- Video call with a traditional healer? Once unthinkable, it’s now common in South Africa
- Intelligent Buildings To Smooth GCC’s Path To Net Zero
Latest Reports
- Cape Verde Portable Hand-Thrown Extinguisher Market (2026-2032)
- Canada Portable Hand-Thrown Extinguisher Market (2026-2032)
- Cameroon Portable Hand-Thrown Extinguisher Market (2026-2032)
- Burundi Portable Hand-Thrown Extinguisher Market (2026-2032)
- Burkina Faso Portable Hand-Thrown Extinguisher Market (2026-2032)
- Bulgaria Portable Hand-Thrown Extinguisher Market (2026-2032)
- Brunei Portable Hand-Thrown Extinguisher Market (2026-2032)
- Botswana Portable Hand-Thrown Extinguisher Market (2026-2032)
- Bosnia and Herzegovina Portable Hand-Thrown Extinguisher Market (2026-2032)
- Bolivia Portable Hand-Thrown Extinguisher Market (2026-2032)
Industry Events and Analyst Meet

HIMTEX 2026

India Refining Summit 2026

India EV Show 2026

EV tech India Expo 2026

Auto Tech Asia 2026
Whitepaper
- Middle East & Africa Commercial Security Market Click here to view more.
- Middle East & Africa Fire Safety Systems & Equipment Market Click here to view more.
- GCC Drone Market Click here to view more.
- Middle East Lighting Fixture Market Click here to view more.
- GCC Physical & Perimeter Security Market Click here to view more.