Czech Republic Varnish Market (2026-2032) | Share, Value, Forecast, Trends, Segmentation, Size & Revenue, Companies, Industry, Competitive Landscape, Analysis, Growth, Outlook
Market Forecast By Type (UV Curable Overprint Varnishes, Water Based Overprint Varnish), By Application (Commercial prints, Food Industry, Pharmaceuticals, Others) And Competitive Landscape
| Product Code: ETC6928958 | Publication Date: Sep 2024 | Updated Date: Apr 2026 | Product Type: Market Research Report | |
| Publisher: 6Wresearch | Author: Sumit Sagar | No. of Pages: 75 | No. of Figures: 35 | No. of Tables: 20 |
Czech Republic Varnish Market Size (2020-2030)
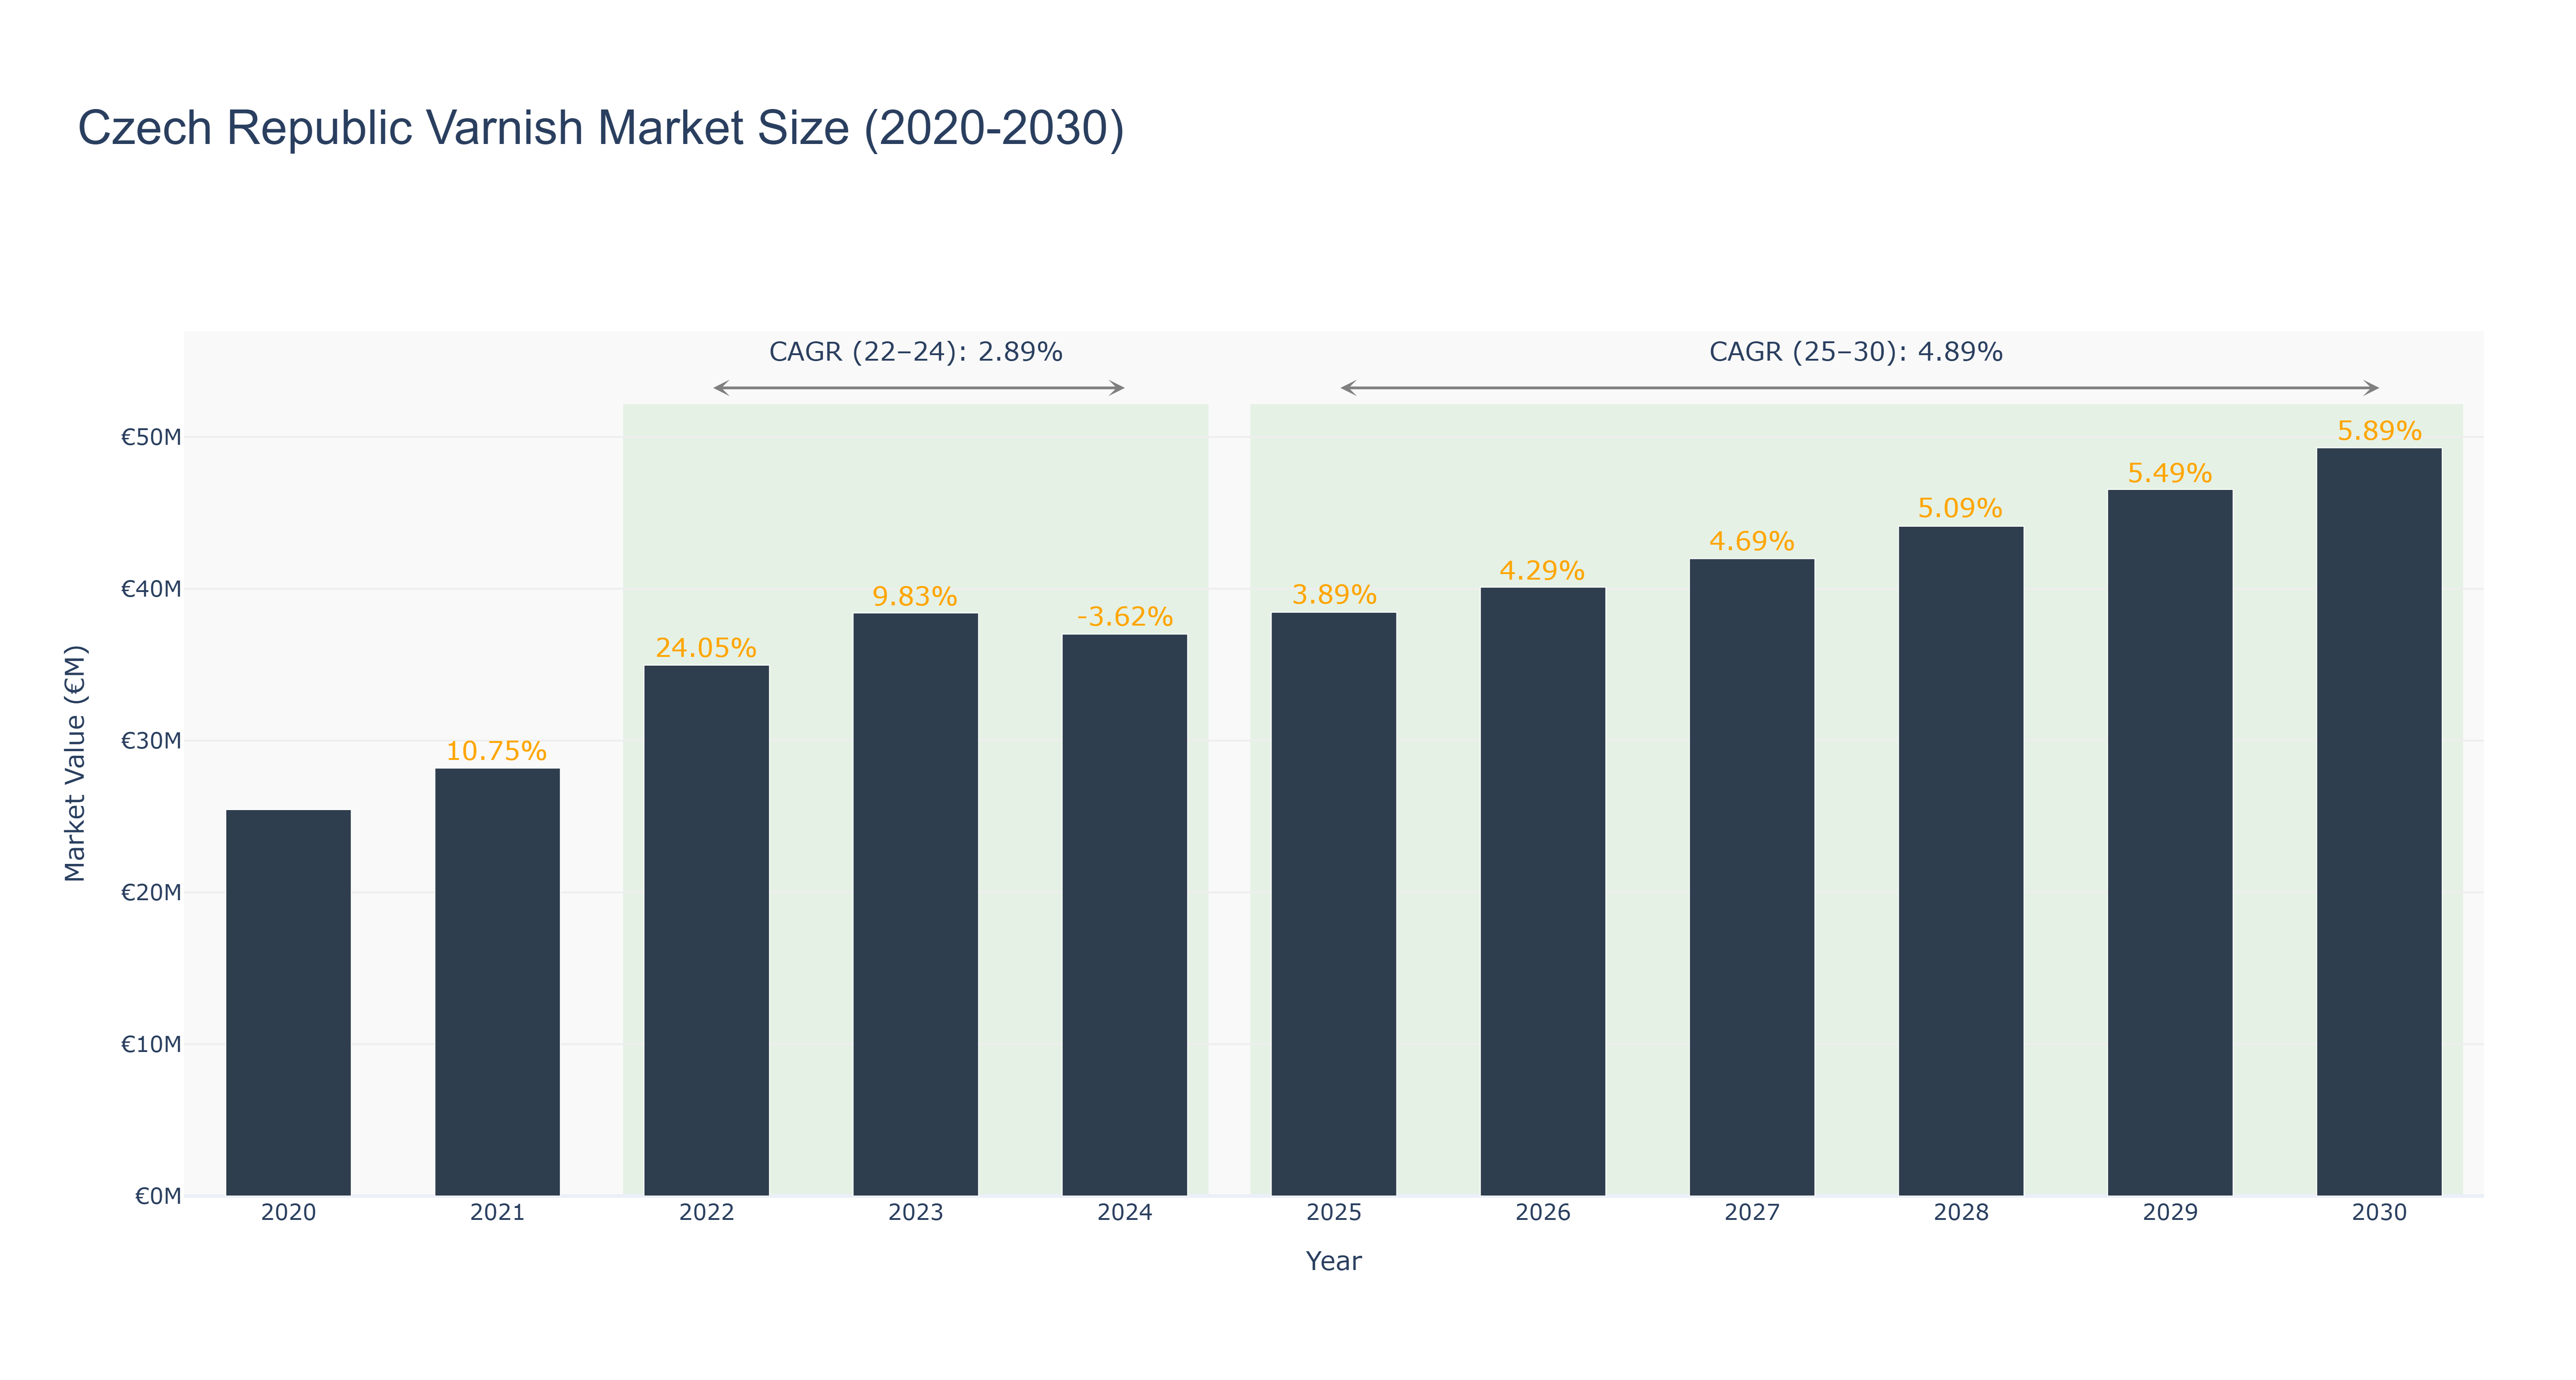
Czech Republic Varnish Market has shown a fluctuating trend over the years. The peak market size was €49.29 million in 2030, with steady growth since 2020 when the market size was €25.45 million. However, the market experienced a slight decline in 2024 to €37.01 million, attributed to economic uncertainties impacting consumer spending. The market rebounded post-2024, with a forecasted growth to €49.29 million by 2030, showcasing a CAGR of 4.888008743% from 2025 to 2030. The industry drivers include increasing demand for high-quality varnish products in construction and automotive sectors. Looking ahead, the Czech Republic Varnish Market is expected to witness new product launches focusing on eco-friendly and sustainable varnish solutions to align with evolving consumer preferences and environmental regulations.
Czech Republic Varnish Market: Production & Trade Performance (2019-2025)
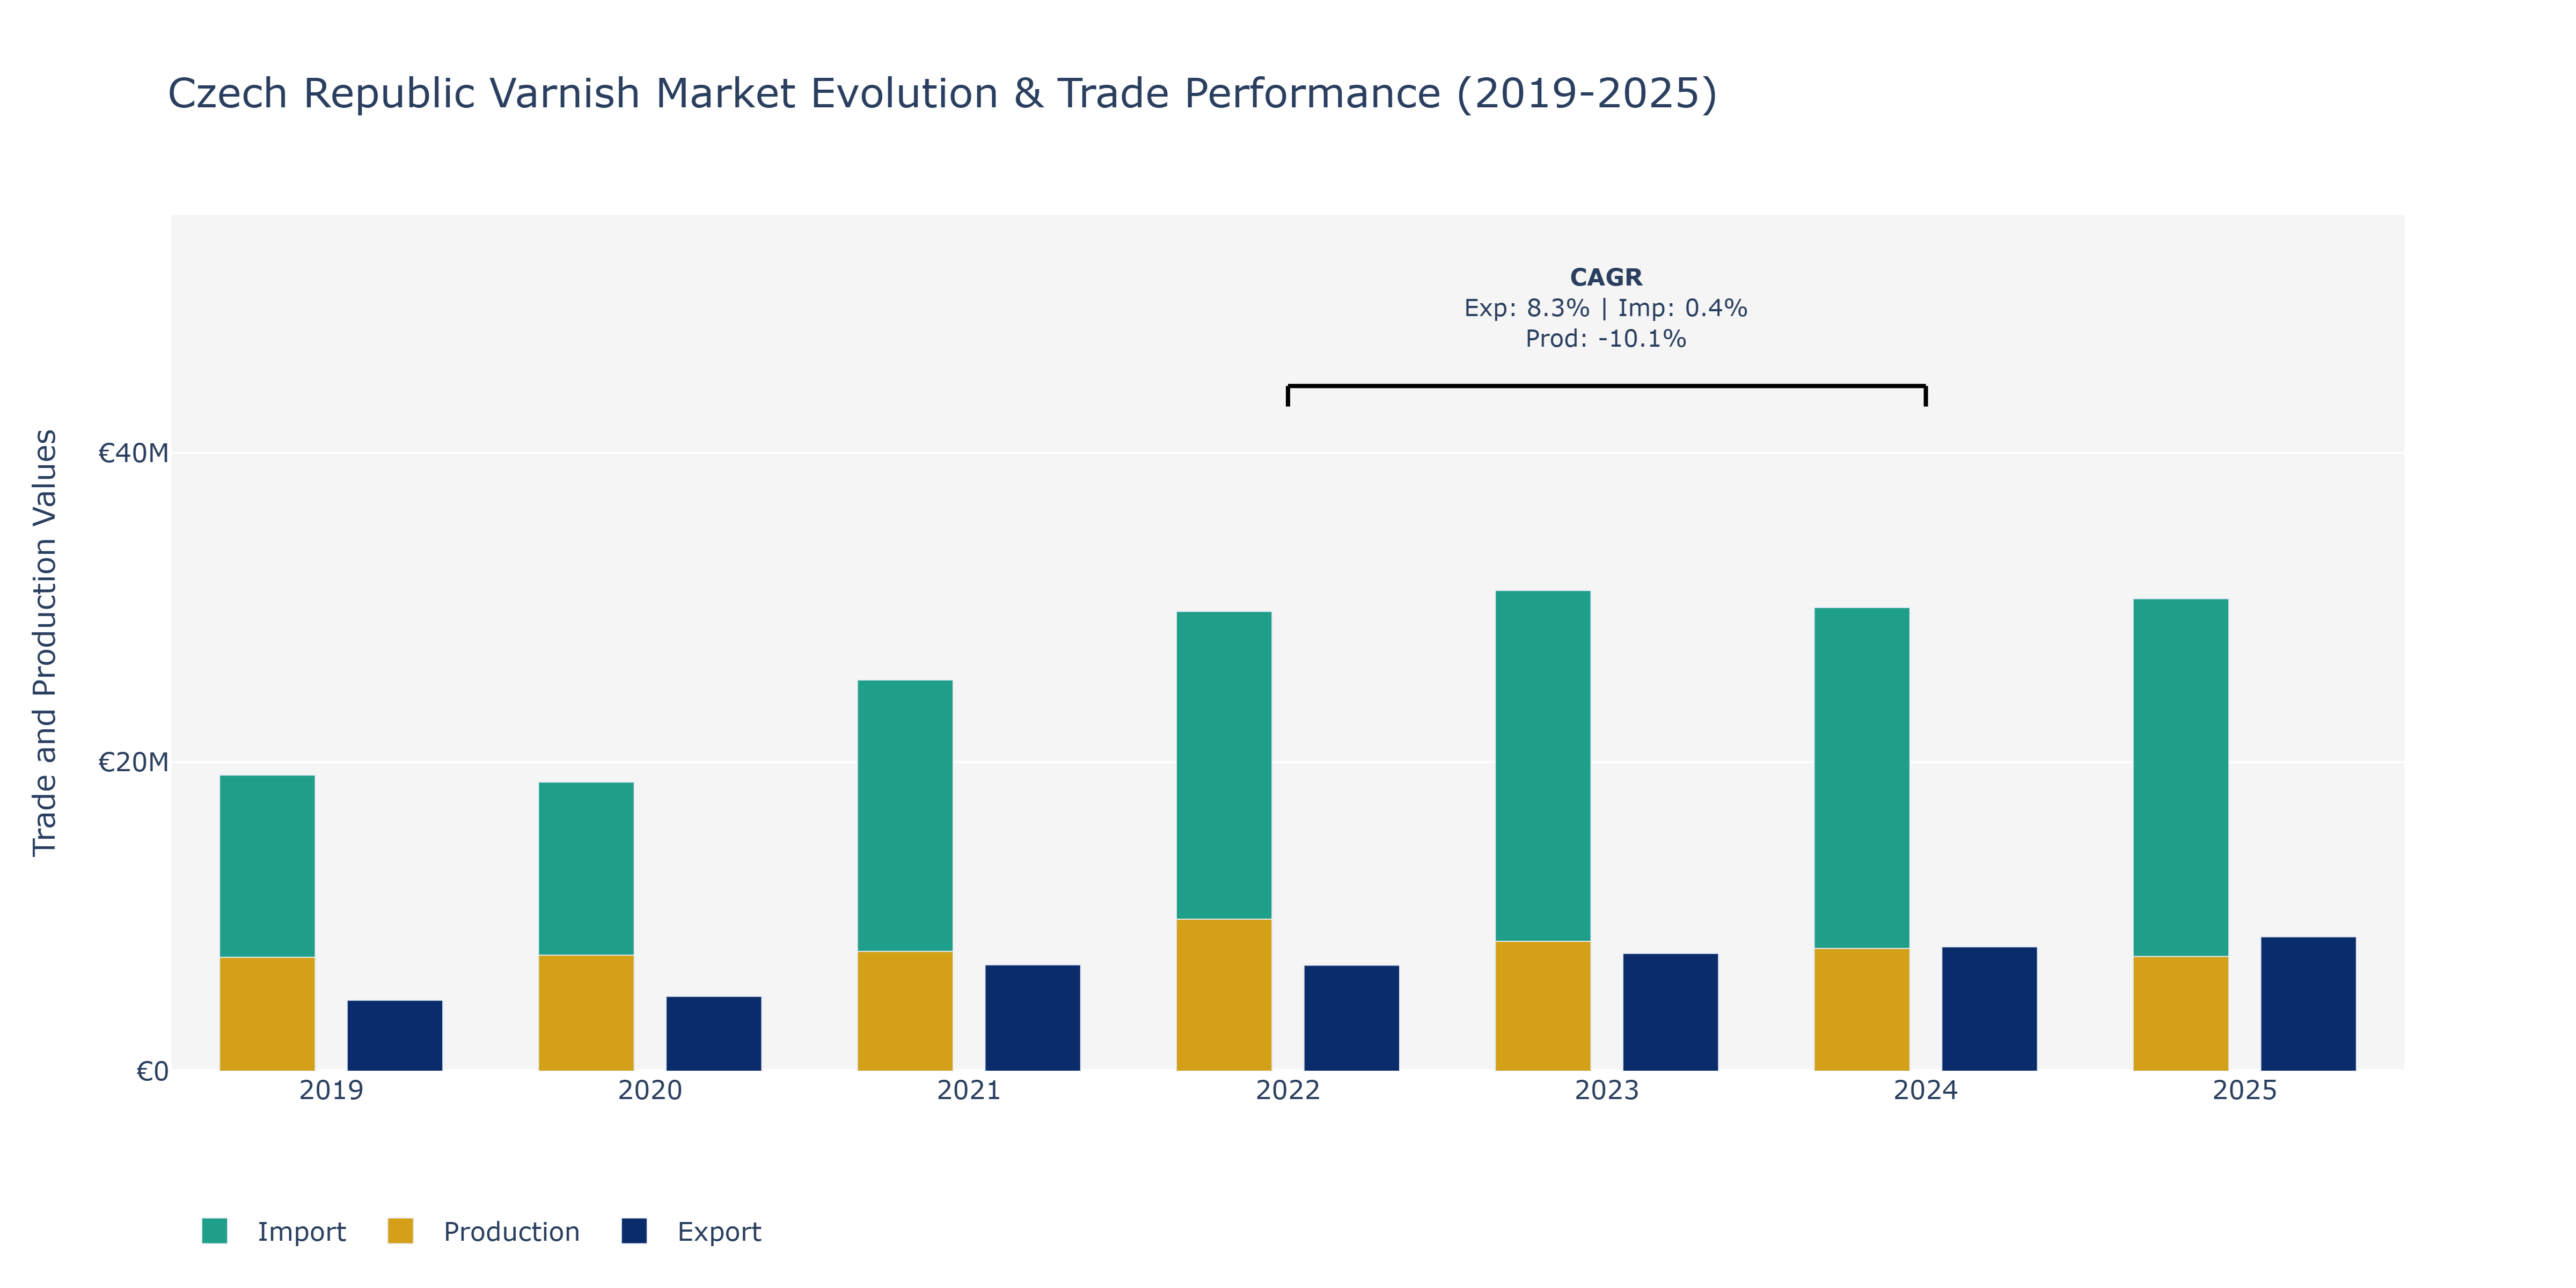
In the Czech Republic Varnish Market, between 2019 and 2025, exports saw a consistent upward trajectory, starting at €4.59 million, reaching €8.7 million by 2025. Imports, on the other hand, displayed fluctuations, peaking at €31.11 million in 2023 before slightly decreasing in 2025 to €30.59 million. Production value varied notably, with a significant decline from €9.83 million in 2022 to €7.95 million in 2024. These fluctuations can be attributed to several factors such as changes in consumer demand, raw material costs, and global economic conditions impacting trade dynamics. The rise in exports could be linked to the increasing demand for Czech varnish products in international markets, potentially driven by the superior quality and competitive pricing compared to other manufacturers. Conversely, the drop in production might reflect challenges faced by local producers, possibly due to supply chain disruptions or shifts in technology affecting production efficiency. To sustain growth, market players could focus on innovation, sustainable sourcing practices, and diversifying export markets to mitigate risks associated with overreliance on specific regions.
Key Highlights of the Report:
- Czech Republic Varnish Market Outlook
- Market Size of Czech Republic Varnish Market, 2025
- Forecast of Czech Republic Varnish Market, 2032
- Historical Data and Forecast of Czech Republic Varnish Revenues & Volume for the Period 2022-2032F
- Czech Republic Varnish Market Trend Evolution
- Czech Republic Varnish Market Drivers and Challenges
- Czech Republic Varnish Price Trends
- Czech Republic Varnish Porter's Five Forces
- Czech Republic Varnish Industry Life Cycle
- Historical Data and Forecast of Czech Republic Varnish Market Revenues & Volume By Type for the Period 2022-2032F
- Historical Data and Forecast of Czech Republic Varnish Market Revenues & Volume By UV Curable Overprint Varnishes for the Period 2022-2032F
- Historical Data and Forecast of Czech Republic Varnish Market Revenues & Volume By Water Based Overprint Varnish for the Period 2022-2032F
- Historical Data and Forecast of Czech Republic Varnish Market Revenues & Volume By Application for the Period 2022-2032F
- Historical Data and Forecast of Czech Republic Varnish Market Revenues & Volume By Commercial prints for the Period 2022-2032F
- Historical Data and Forecast of Czech Republic Varnish Market Revenues & Volume By Food Industry for the Period 2022-2032F
- Historical Data and Forecast of Czech Republic Varnish Market Revenues & Volume By Pharmaceuticals for the Period 2022-2032F
- Historical Data and Forecast of Czech Republic Varnish Market Revenues & Volume By Others for the Period 2022-2032F
- Czech Republic Varnish Import Export Trade Statistics
- Market Opportunity Assessment By Type
- Market Opportunity Assessment By Application
- Czech Republic Varnish Top Companies Market Share
- Czech Republic Varnish Competitive Benchmarking By Technical and Operational Parameters
- Czech Republic Varnish Company Profiles
- Czech Republic Varnish Key Strategic Recommendations
Frequently Asked Questions About the Market Study (FAQs):
6Wresearch actively monitors the Czech Republic Varnish Market and publishes its comprehensive annual report, highlighting emerging trends, growth drivers, revenue analysis, and forecast outlook. Our insights help businesses to make data-backed strategic decisions with ongoing market dynamics. Our analysts track relevent industries related to the Czech Republic Varnish Market, allowing our clients with actionable intelligence and reliable forecasts tailored to emerging regional needs.
Yes, we provide customisation as per your requirements. To learn more, feel free to contact us on sales@6wresearch.com
1 Executive Summary |
2 Introduction |
2.1 Key Highlights of the Report |
2.2 Report Description |
2.3 Market Scope & Segmentation |
2.4 Research Methodology |
2.5 Assumptions |
3 Czech Republic Varnish Market Overview |
3.1 Czech Republic Country Macro Economic Indicators |
3.2 Czech Republic Varnish Market Revenues & Volume, 2022 & 2032F |
3.3 Czech Republic Varnish Market - Industry Life Cycle |
3.4 Czech Republic Varnish Market - Porter's Five Forces |
3.5 Czech Republic Varnish Market Revenues & Volume Share, By Type, 2022 & 2032F |
3.6 Czech Republic Varnish Market Revenues & Volume Share, By Application, 2022 & 2032F |
4 Czech Republic Varnish Market Dynamics |
4.1 Impact Analysis |
4.2 Market Drivers |
4.2.1 Increasing demand for eco-friendly and sustainable varnish products |
4.2.2 Growing construction and renovation activities in the Czech Republic |
4.2.3 Rising disposable income leading to higher spending on home decor and furniture |
4.3 Market Restraints |
4.3.1 Fluctuating raw material prices impacting production costs |
4.3.2 Stringent environmental regulations affecting the formulation and distribution of varnish products |
4.3.3 Intense competition from imported varnish brands |
5 Czech Republic Varnish Market Trends |
6 Czech Republic Varnish Market, By Types |
6.1 Czech Republic Varnish Market, By Type |
6.1.1 Overview and Analysis |
6.1.2 Czech Republic Varnish Market Revenues & Volume, By Type, 2022-2032F |
6.1.3 Czech Republic Varnish Market Revenues & Volume, By UV Curable Overprint Varnishes, 2022-2032F |
6.1.4 Czech Republic Varnish Market Revenues & Volume, By Water Based Overprint Varnish, 2022-2032F |
6.2 Czech Republic Varnish Market, By Application |
6.2.1 Overview and Analysis |
6.2.2 Czech Republic Varnish Market Revenues & Volume, By Commercial prints, 2022-2032F |
6.2.3 Czech Republic Varnish Market Revenues & Volume, By Food Industry, 2022-2032F |
6.2.4 Czech Republic Varnish Market Revenues & Volume, By Pharmaceuticals, 2022-2032F |
6.2.5 Czech Republic Varnish Market Revenues & Volume, By Others, 2022-2032F |
7 Czech Republic Varnish Market Import-Export Trade Statistics |
7.1 Czech Republic Varnish Market Export to Major Countries |
7.2 Czech Republic Varnish Market Imports from Major Countries |
8 Czech Republic Varnish Market Key Performance Indicators |
8.1 Percentage of varnish products with eco-friendly certifications |
8.2 Number of construction permits issued in the Czech Republic |
8.3 Consumer sentiment index towards spending on home improvement |
8.4 Innovation rate in varnish formulations |
8.5 Percentage of market share held by domestic varnish brands |
9 Czech Republic Varnish Market - Opportunity Assessment |
9.1 Czech Republic Varnish Market Opportunity Assessment, By Type, 2022 & 2032F |
9.2 Czech Republic Varnish Market Opportunity Assessment, By Application, 2022 & 2032F |
10 Czech Republic Varnish Market - Competitive Landscape |
10.1 Czech Republic Varnish Market Revenue Share, By Companies, 2025 |
10.2 Czech Republic Varnish Market Competitive Benchmarking, By Operating and Technical Parameters |
11 Company Profiles |
12 Recommendations |
13 Disclaimer |
Export potential assessment - trade Analytics for 2030
Export potential enables firms to identify high-growth global markets with greater confidence by combining advanced trade intelligence with a structured quantitative methodology. The framework analyzes emerging demand trends and country-level import patterns while integrating macroeconomic and trade datasets such as GDP and population forecasts, bilateral import–export flows, tariff structures, elasticity differentials between developed and developing economies, geographic distance, and import demand projections. Using weighted trade values from 2020–2024 as the base period to project country-to-country export potential for 2030, these inputs are operationalized through calculated drivers such as gravity model parameters, tariff impact factors, and projected GDP per-capita growth. Through an analysis of hidden potentials, demand hotspots, and market conditions that are most favorable to success, this method enables firms to focus on target countries, maximize returns, and global expansion with data, backed by accuracy.
By factoring in the projected importer demand gap that is currently unmet and could be potential opportunity, it identifies the potential for the Exporter (Country) among 190 countries, against the general trade analysis, which identifies the biggest importer or exporter.
To discover high-growth global markets and optimize your business strategy:
Click Here
Pricing
- Single User License$ 1,995
- Department License$ 2,400
- Site License$ 3,120
- Global License$ 3,795

Search
Thought Leadership and Analyst Meet


Our Clients
Latest Reports
- Canada Cloud CFD Market (2026-2032) | Size & Revenue, Industry, Growth, Competitive Landscape, Forecast, Segmentation, Value, Outlook, Trends, Share, Analysis, Companies
- Taiwan Food Delivery Platform Market (2026-2032) | Companies, Outlook, Analysis, Trends, Value, Revenue, Segmentation, Share, Forecast, Competitive Landscape, Growth, Size & Forecast
- United Kingdom (UK) Long-term Care Insurance Market (2026-2032) | Growth, Share, Consumer Insights, Drivers, Opportunities, Competition, Pricing Analysis, Segments, Restraints, Companies, Competitive, Value, Outlook, Size, Demand, Analysis, Challenges, Strategic Insights, Investment Trends, Revenue, Trends, Supply, Forecast
- United Kingdom (UK) Long Term Care Market (2026-2032) | Companies, Outlook, Analysis, Trends, Value, Revenue, Segmentation, Share, Forecast, Competitive Landscape, Growth, Size & Forecast
- Iraq Insulation and Waterproofing Market (2026-2032) | Outlook, Drivers, Growth, Size, Share, Industry, Revenue, Trends, Demand, Competitive, Strategic Insights, Opportunities, Segments, Companies, Challenges, Strategy, Consumer Insights, Analysis, Investment Trends, Value, Segmentation, Forecast, Restraints
- India Switchgear Market Outlook (2026-2032) | Size, Share, Trends, Growth, Revenue, Forecast, Analysis, Value, Outlook
- Pakistan Contraceptive Implants Market (2025-2031) | Demand, Growth, Size, Share, Industry, Pricing Analysis, Competitive, Strategic Insights, Strategy, Consumer Insights, Analysis, Investment Trends, Opportunities, Revenue, Segments, Value, Segmentation, Supply, Forecast, Restraints, Outlook, Competition, Drivers, Trends, Companies, Challenges
- Sri Lanka Packaging Market (2026-2032) | Outlook, Competition, Drivers, Trends, Demand, Pricing Analysis, Competitive, Strategic Insights, Companies, Challenges, Strategy, Consumer Insights, Analysis, Investment Trends, Opportunities, Growth, Size, Share, Industry, Revenue, Segments, Value, Segmentation, Supply, Forecast, Restraints
- India Kids Watches Market (2026-2032) | Strategy, Consumer Insights, Analysis, Investment Trends, Opportunities, Growth, Size, Share, Industry, Revenue, Segments, Value, Segmentation, Supply, Forecast, Restraints, Outlook, Competition, Drivers, Trends, Demand, Pricing Analysis, Competitive, Strategic Insights, Companies, Challenges
- Saudi Arabia Core Assurance Service Market (2025-2031) | Strategy, Consumer Insights, Analysis, Investment Trends, Opportunities, Growth, Size, Share, Industry, Revenue, Segments, Value, Segmentation, Supply, Forecast, Restraints, Outlook, Competition, Drivers, Trends, Demand, Pricing Analysis, Competitive, Strategic Insights, Companies, Challenges
Industry Events and Analyst Meet

India EV Show 2026

EV tech India Expo 2026

Auto Tech Asia 2026

Battery Tech India 2026

Smart Production Solutions Guangzhou 2026
Whitepaper
- Middle East & Africa Commercial Security Market Click here to view more.
- Middle East & Africa Fire Safety Systems & Equipment Market Click here to view more.
- GCC Drone Market Click here to view more.
- Middle East Lighting Fixture Market Click here to view more.
- GCC Physical & Perimeter Security Market Click here to view more.
6WResearch In News
- Doha a strategic location for EV manufacturing hub: IPA Qatar
- Demand for luxury TVs surging in the GCC, says Samsung
- Empowering Growth: The Thriving Journey of Bangladesh’s Cable Industry
- Demand for luxury TVs surging in the GCC, says Samsung
- Video call with a traditional healer? Once unthinkable, it’s now common in South Africa
- Intelligent Buildings To Smooth GCC’s Path To Net Zero