Denmark Acrylonitrile Butadiene Rubber Market (2026-2032) | Companies, Share, Trends, Forecast, Outlook, Analysis, Size & Revenue, Industry, Value, Competitive Landscape, Segmentation, Growth
Market Forecast By Product Type (Extra High AN Content (Above 45%), High AN Content (36-45%), Medium-High AN Content (31-35%), Medium-Low AN Content (26-30%), Low AN Content (15-25%)), By Application (Aviation Industry, Automotive Industry, Machinery, Manufacturing), By Type (Block Type, Particles, Crumb Type, Powder Type) And Competitive Landscape
| Product Code: ETC6951935 | Publication Date: Sep 2024 | Updated Date: Apr 2026 | Product Type: Market Research Report | |
| Publisher: 6Wresearch | Author: Sumit Sagar | No. of Pages: 75 | No. of Figures: 35 | No. of Tables: 20 |
Denmark Acrylonitrile Butadiene Rubber Market Size (2020-2030)
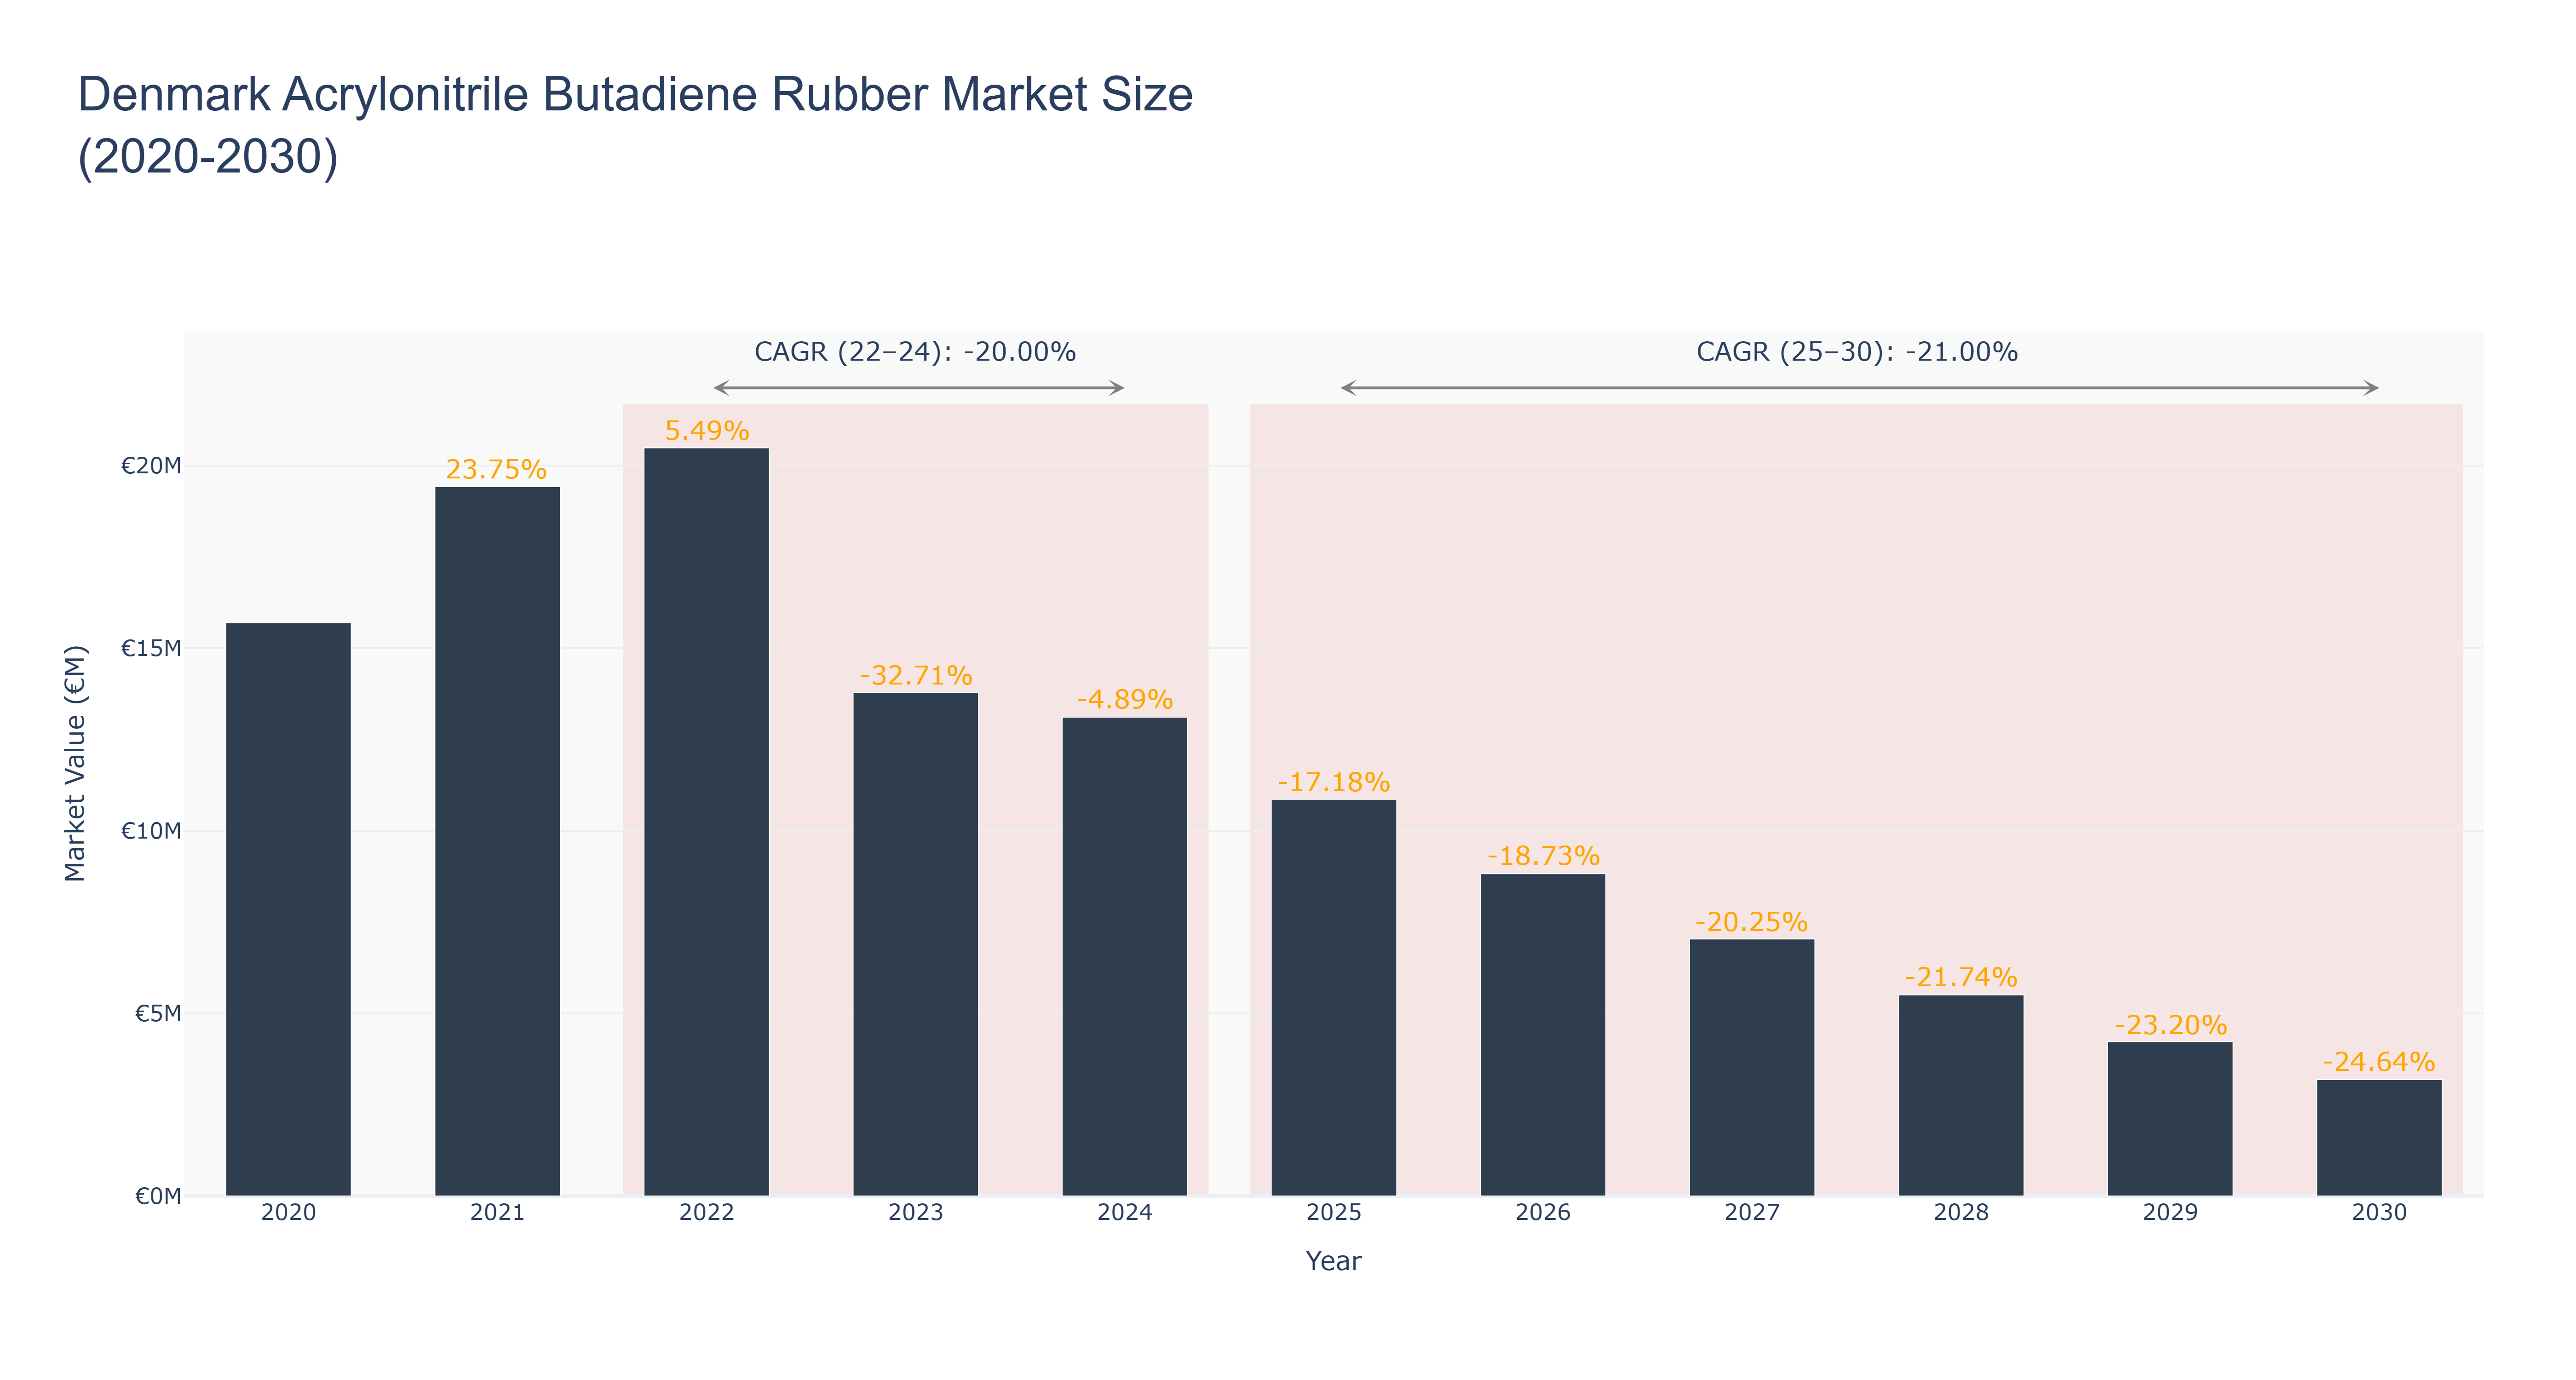
Denmark's Acrylonitrile Butadiene Rubber Market experienced a peak market size of €20.49 million in 2022, followed by a decline to €10.86 million in 2025. The market is forecasted to further decrease to €3.19 million by 2030, with a CAGR of -19.9977534% from 2022 to 2024 and -20.9977534% from 2025 to 2030. The downturn can be attributed to global economic challenges impacting demand, coupled with technological advancements leading to alternative solutions. Moving forward, industry drivers such as sustainability initiatives and increasing applications in automotive and construction sectors are expected to drive growth. Recent developments in Denmark's rubber market include collaborations with sustainable material suppliers for eco-friendly product lines, with future projects focusing on enhancing production efficiency and expanding market reach through strategic partnerships with key industries.
Denmark Acrylonitrile Butadiene Rubber Market: Production & Trade Performance (2019-2025)
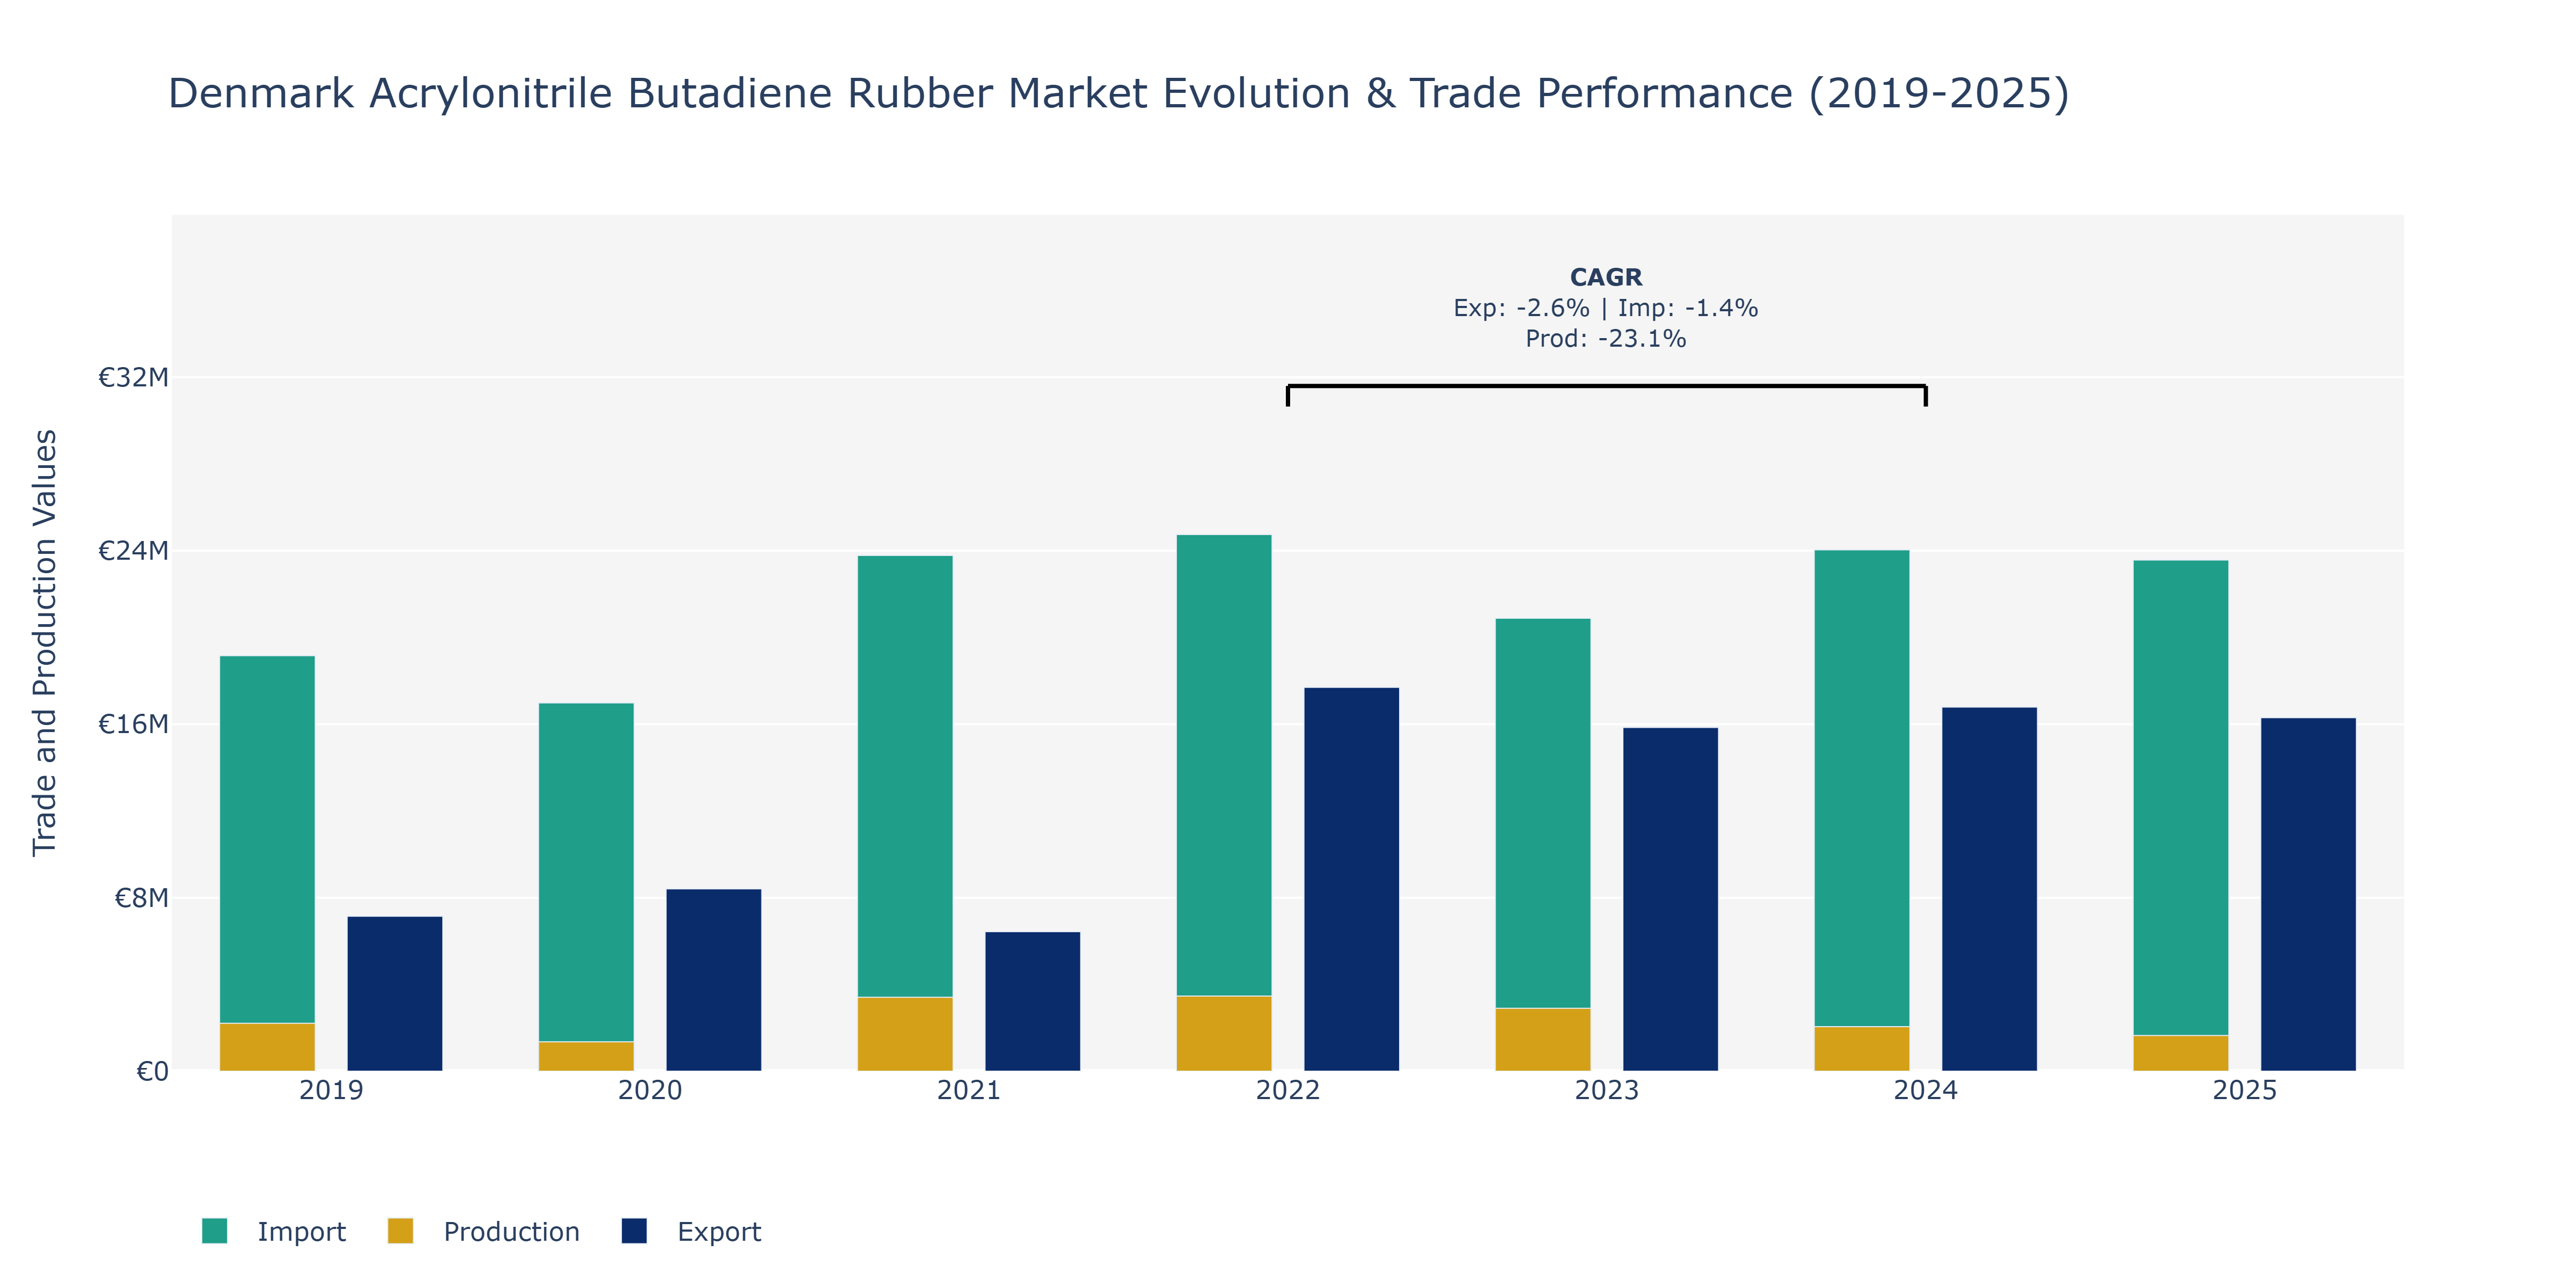
Between 2019 and 2025, the Denmark Acrylonitrile Butadiene Rubber market showcased notable fluctuations in Exports, Imports, and Production. Exports saw a rise from €7.14 million in 2019 to €16.3 million in 2025 before experiencing a slight decrease to €16.3 million in 2025. Imports peaked at €24.75 million in 2022, followed by a decline to €23.57 million in 2025. Production, on the other hand, displayed a declining trend from €2.21 million in 2019 to €1.65 million in 2025. These developments can be attributed to various factors, including global demand shifts, raw material availability, and market competition. The increase in Exports until 2024 may have been driven by growing international demand and strategic market positioning, while the subsequent decrease could be influenced by changing trade dynamics and economic conditions. The fluctuations in Imports may reflect changing sourcing strategies and cost considerations within the industry. The decline in Production could be linked to technological advancements impacting manufacturing processes or shifts in domestic consumption patterns, prompting manufacturers to adjust their output levels to align with demand. Through strategic market analysis, companies can capitalize on these trends to optimize their operations and remain competitive in the dynamic Acrylonitrile Butadiene Rubber market landscape.
Key Highlights of the Report:
- Denmark Acrylonitrile Butadiene Rubber Market Outlook
- Market Size of Denmark Acrylonitrile Butadiene Rubber Market, 2025
- Forecast of Denmark Acrylonitrile Butadiene Rubber Market, 2032
- Historical Data and Forecast of Denmark Acrylonitrile Butadiene Rubber Revenues & Volume for the Period 2022 - 2032
- Denmark Acrylonitrile Butadiene Rubber Market Trend Evolution
- Denmark Acrylonitrile Butadiene Rubber Market Drivers and Challenges
- Denmark Acrylonitrile Butadiene Rubber Price Trends
- Denmark Acrylonitrile Butadiene Rubber Porter's Five Forces
- Denmark Acrylonitrile Butadiene Rubber Industry Life Cycle
- Historical Data and Forecast of Denmark Acrylonitrile Butadiene Rubber Market Revenues & Volume By Product Type for the Period 2022 - 2032
- Historical Data and Forecast of Denmark Acrylonitrile Butadiene Rubber Market Revenues & Volume By Extra High AN Content (Above 45%) for the Period 2022 - 2032
- Historical Data and Forecast of Denmark Acrylonitrile Butadiene Rubber Market Revenues & Volume By High AN Content (36-45%) for the Period 2022 - 2032
- Historical Data and Forecast of Denmark Acrylonitrile Butadiene Rubber Market Revenues & Volume By Medium-High AN Content (31-35%) for the Period 2022 - 2032
- Historical Data and Forecast of Denmark Acrylonitrile Butadiene Rubber Market Revenues & Volume By Medium-Low AN Content (26-30%) for the Period 2022 - 2032
- Historical Data and Forecast of Denmark Acrylonitrile Butadiene Rubber Market Revenues & Volume By Low AN Content (15-25%) for the Period 2022 - 2032
- Historical Data and Forecast of Denmark Acrylonitrile Butadiene Rubber Market Revenues & Volume By Application for the Period 2022 - 2032
- Historical Data and Forecast of Denmark Acrylonitrile Butadiene Rubber Market Revenues & Volume By Aviation Industry for the Period 2022 - 2032
- Historical Data and Forecast of Denmark Acrylonitrile Butadiene Rubber Market Revenues & Volume By Automotive Industry for the Period 2022 - 2032
- Historical Data and Forecast of Denmark Acrylonitrile Butadiene Rubber Market Revenues & Volume By Machinery for the Period 2022 - 2032
- Historical Data and Forecast of Denmark Acrylonitrile Butadiene Rubber Market Revenues & Volume By Manufacturing for the Period 2022 - 2032
- Historical Data and Forecast of Denmark Acrylonitrile Butadiene Rubber Market Revenues & Volume By Type for the Period 2022 - 2032
- Historical Data and Forecast of Denmark Acrylonitrile Butadiene Rubber Market Revenues & Volume By Block Type for the Period 2022 - 2032
- Historical Data and Forecast of Denmark Acrylonitrile Butadiene Rubber Market Revenues & Volume By Particles for the Period 2022 - 2032
- Historical Data and Forecast of Denmark Acrylonitrile Butadiene Rubber Market Revenues & Volume By Crumb Type for the Period 2022 - 2032
- Historical Data and Forecast of Denmark Acrylonitrile Butadiene Rubber Market Revenues & Volume By Powder Type for the Period 2022 - 2032
- Denmark Acrylonitrile Butadiene Rubber Import Export Trade Statistics
- Market Opportunity Assessment By Product Type
- Market Opportunity Assessment By Application
- Market Opportunity Assessment By Type
- Denmark Acrylonitrile Butadiene Rubber Top Companies Market Share
- Denmark Acrylonitrile Butadiene Rubber Competitive Benchmarking By Technical and Operational Parameters
- Denmark Acrylonitrile Butadiene Rubber Company Profiles
- Denmark Acrylonitrile Butadiene Rubber Key Strategic Recommendations
Frequently Asked Questions About the Market Study (FAQs):
6Wresearch actively monitors the Denmark Acrylonitrile Butadiene Rubber Market and publishes its comprehensive annual report, highlighting emerging trends, growth drivers, revenue analysis, and forecast outlook. Our insights help businesses to make data-backed strategic decisions with ongoing market dynamics. Our analysts track relevent industries related to the Denmark Acrylonitrile Butadiene Rubber Market, allowing our clients with actionable intelligence and reliable forecasts tailored to emerging regional needs.
Yes, we provide customisation as per your requirements. To learn more, feel free to contact us on sales@6wresearch.com
1 Executive Summary |
2 Introduction |
2.1 Key Highlights of the Report |
2.2 Report Description |
2.3 Market Scope & Segmentation |
2.4 Research Methodology |
2.5 Assumptions |
3 Denmark Acrylonitrile Butadiene Rubber Market Overview |
3.1 Denmark Country Macro Economic Indicators |
3.2 Denmark Acrylonitrile Butadiene Rubber Market Revenues & Volume, 2022 & 2032F |
3.3 Denmark Acrylonitrile Butadiene Rubber Market - Industry Life Cycle |
3.4 Denmark Acrylonitrile Butadiene Rubber Market - Porter's Five Forces |
3.5 Denmark Acrylonitrile Butadiene Rubber Market Revenues & Volume Share, By Product Type, 2022 & 2032F |
3.6 Denmark Acrylonitrile Butadiene Rubber Market Revenues & Volume Share, By Application, 2022 & 2032F |
3.7 Denmark Acrylonitrile Butadiene Rubber Market Revenues & Volume Share, By Type, 2022 & 2032F |
4 Denmark Acrylonitrile Butadiene Rubber Market Dynamics |
4.1 Impact Analysis |
4.2 Market Drivers |
4.2.1 Increasing demand for acrylonitrile butadiene rubber in automotive industry due to its high durability and resistance to abrasion. |
4.2.2 Growing construction sector in Denmark using acrylonitrile butadiene rubber for applications such as roofing and sealants. |
4.2.3 Emphasis on sustainability and eco-friendly materials driving the demand for acrylonitrile butadiene rubber as it is recyclable. |
4.3 Market Restraints |
4.3.1 Fluctuating raw material prices impacting the production cost of acrylonitrile butadiene rubber. |
4.3.2 Competition from substitutes such as natural rubber and synthetic rubber variants. |
4.3.3 Stringent regulations regarding chemical usage and emissions affecting the manufacturing processes of acrylonitrile butadiene rubber. |
5 Denmark Acrylonitrile Butadiene Rubber Market Trends |
6 Denmark Acrylonitrile Butadiene Rubber Market, By Types |
6.1 Denmark Acrylonitrile Butadiene Rubber Market, By Product Type |
6.1.1 Overview and Analysis |
6.1.2 Denmark Acrylonitrile Butadiene Rubber Market Revenues & Volume, By Product Type, 2022 - 2032F |
6.1.3 Denmark Acrylonitrile Butadiene Rubber Market Revenues & Volume, By Extra High AN Content (Above 45%), 2022 - 2032F |
6.1.4 Denmark Acrylonitrile Butadiene Rubber Market Revenues & Volume, By High AN Content (36-45%), 2022 - 2032F |
6.1.5 Denmark Acrylonitrile Butadiene Rubber Market Revenues & Volume, By Medium-High AN Content (31-35%), 2022 - 2032F |
6.1.6 Denmark Acrylonitrile Butadiene Rubber Market Revenues & Volume, By Medium-Low AN Content (26-30%), 2022 - 2032F |
6.1.7 Denmark Acrylonitrile Butadiene Rubber Market Revenues & Volume, By Low AN Content (15-25%), 2022 - 2032F |
6.2 Denmark Acrylonitrile Butadiene Rubber Market, By Application |
6.2.1 Overview and Analysis |
6.2.2 Denmark Acrylonitrile Butadiene Rubber Market Revenues & Volume, By Aviation Industry, 2022 - 2032F |
6.2.3 Denmark Acrylonitrile Butadiene Rubber Market Revenues & Volume, By Automotive Industry, 2022 - 2032F |
6.2.4 Denmark Acrylonitrile Butadiene Rubber Market Revenues & Volume, By Machinery, 2022 - 2032F |
6.2.5 Denmark Acrylonitrile Butadiene Rubber Market Revenues & Volume, By Manufacturing, 2022 - 2032F |
6.3 Denmark Acrylonitrile Butadiene Rubber Market, By Type |
6.3.1 Overview and Analysis |
6.3.2 Denmark Acrylonitrile Butadiene Rubber Market Revenues & Volume, By Block Type, 2022 - 2032F |
6.3.3 Denmark Acrylonitrile Butadiene Rubber Market Revenues & Volume, By Particles, 2022 - 2032F |
6.3.4 Denmark Acrylonitrile Butadiene Rubber Market Revenues & Volume, By Crumb Type, 2022 - 2032F |
6.3.5 Denmark Acrylonitrile Butadiene Rubber Market Revenues & Volume, By Powder Type, 2022 - 2032F |
7 Denmark Acrylonitrile Butadiene Rubber Market Import-Export Trade Statistics |
7.1 Denmark Acrylonitrile Butadiene Rubber Market Export to Major Countries |
7.2 Denmark Acrylonitrile Butadiene Rubber Market Imports from Major Countries |
8 Denmark Acrylonitrile Butadiene Rubber Market Key Performance Indicators |
8.1 Percentage increase in adoption of acrylonitrile butadiene rubber in new automotive models in Denmark. |
8.2 Number of new construction projects utilizing acrylonitrile butadiene rubber products. |
8.3 Environmental impact metrics such as the percentage of recycled acrylonitrile butadiene rubber used in manufacturing processes. |
9 Denmark Acrylonitrile Butadiene Rubber Market - Opportunity Assessment |
9.1 Denmark Acrylonitrile Butadiene Rubber Market Opportunity Assessment, By Product Type, 2022 & 2032F |
9.2 Denmark Acrylonitrile Butadiene Rubber Market Opportunity Assessment, By Application, 2022 & 2032F |
9.3 Denmark Acrylonitrile Butadiene Rubber Market Opportunity Assessment, By Type, 2022 & 2032F |
10 Denmark Acrylonitrile Butadiene Rubber Market - Competitive Landscape |
10.1 Denmark Acrylonitrile Butadiene Rubber Market Revenue Share, By Companies, 2025 |
10.2 Denmark Acrylonitrile Butadiene Rubber Market Competitive Benchmarking, By Operating and Technical Parameters |
11 Company Profiles |
12 Recommendations |
13 Disclaimer |
Export potential assessment - trade Analytics for 2030
Export potential enables firms to identify high-growth global markets with greater confidence by combining advanced trade intelligence with a structured quantitative methodology. The framework analyzes emerging demand trends and country-level import patterns while integrating macroeconomic and trade datasets such as GDP and population forecasts, bilateral import–export flows, tariff structures, elasticity differentials between developed and developing economies, geographic distance, and import demand projections. Using weighted trade values from 2020–2024 as the base period to project country-to-country export potential for 2030, these inputs are operationalized through calculated drivers such as gravity model parameters, tariff impact factors, and projected GDP per-capita growth. Through an analysis of hidden potentials, demand hotspots, and market conditions that are most favorable to success, this method enables firms to focus on target countries, maximize returns, and global expansion with data, backed by accuracy.
By factoring in the projected importer demand gap that is currently unmet and could be potential opportunity, it identifies the potential for the Exporter (Country) among 190 countries, against the general trade analysis, which identifies the biggest importer or exporter.
To discover high-growth global markets and optimize your business strategy:
Click Here
Pricing
- Single User License$ 1,995
- Department License$ 2,400
- Site License$ 3,120
- Global License$ 3,795

Search
Thought Leadership and Analyst Meet


Our Clients
Latest Reports
- Philippines Polyhydroxybutyrate-co-Hydroxyvalerate Market (2026-2032) | Trends, Insights, Challenges, Restraints, Competition, Size, Value, Forecast, Pricing, Share, Outlook, Revenue, Investment Opportunities, Strategy, Drivers, Demand, Growth, segmentation, Analysis, Companies
- Peru Polyhydroxybutyrate-co-Hydroxyvalerate Market (2026-2032) | Growth, Demand, Challenges, Share, Trends, Analysis, Pricing, Investment Opportunities, Drivers, Value, Forecast, Competition, Size, Companies, Insights, Outlook, Restraints, segmentation, Revenue, Strategy
- Pakistan Polyhydroxybutyrate-co-Hydroxyvalerate Market (2026-2032) | Restraints, segmentation, Pricing, Forecast, Share, Strategy, Competition, Trends, Insights, Drivers, Challenges, Growth, Revenue, Outlook, Value, Investment Opportunities, Companies, Size, Analysis, Demand
- Oman Polyhydroxybutyrate-co-Hydroxyvalerate Market (2026-2032) | Drivers, segmentation, Insights, Competition, Pricing, Outlook, Size, Revenue, Challenges, Forecast, Analysis, Growth, Value, Share, Trends, Investment Opportunities, Strategy, Restraints, Companies, Demand
- Nigeria Polyhydroxybutyrate-co-Hydroxyvalerate Market (2026-2032) | Value, Investment Opportunities, Analysis, Revenue, Restraints, Pricing, Outlook, Competition, Demand, Growth, Forecast, Companies, Trends, Challenges, segmentation, Drivers, Insights, Share, Size, Strategy
- Nepal Polyhydroxybutyrate-co-Hydroxyvalerate Market (2026-2032) | Insights, Analysis, Drivers, Share, Revenue, Demand, segmentation, Investment Opportunities, Competition, Forecast, Growth, Pricing, Companies, Strategy, Trends, Restraints, Challenges, Outlook, Size, Value
- Myanmar Polyhydroxybutyrate-co-Hydroxyvalerate Market (2026-2032) | Outlook, Revenue, Strategy, Restraints, Drivers, segmentation, Share, Forecast, Competition, Insights, Growth, Pricing, Size, Demand, Value, Companies, Trends, Challenges, Investment Opportunities, Analysis
- Morocco Polyhydroxybutyrate-co-Hydroxyvalerate Market (2026-2032) | Outlook, Investment Opportunities, Restraints, Strategy, Forecast, Challenges, Drivers, Growth, Companies, segmentation, Trends, Size, Competition, Revenue, Demand, Insights, Share, Analysis, Value, Pricing
- Mexico Polyhydroxybutyrate-co-Hydroxyvalerate Market (2026-2032) | Size, Drivers, Outlook, Share, Strategy, Growth, Pricing, Challenges, Companies, Demand, Value, Investment Opportunities, Restraints, Trends, Forecast, segmentation, Analysis, Insights, Competition, Revenue
- Malaysia Polyhydroxybutyrate-co-Hydroxyvalerate Market (2026-2032) | Share, segmentation, Size, Companies, Analysis, Insights, Forecast, Value, Revenue, Drivers, Restraints, Challenges, Investment Opportunities, Trends, Competition, Strategy, Demand, Growth, Outlook, Pricing
Industry Events and Analyst Meet

HIMTEX 2026

India Refining Summit 2026

India EV Show 2026

EV tech India Expo 2026

Auto Tech Asia 2026
Whitepaper
- Middle East & Africa Commercial Security Market Click here to view more.
- Middle East & Africa Fire Safety Systems & Equipment Market Click here to view more.
- GCC Drone Market Click here to view more.
- Middle East Lighting Fixture Market Click here to view more.
- GCC Physical & Perimeter Security Market Click here to view more.
6WResearch In News
- Doha a strategic location for EV manufacturing hub: IPA Qatar
- Demand for luxury TVs surging in the GCC, says Samsung
- Empowering Growth: The Thriving Journey of Bangladesh’s Cable Industry
- Demand for luxury TVs surging in the GCC, says Samsung
- Video call with a traditional healer? Once unthinkable, it’s now common in South Africa
- Intelligent Buildings To Smooth GCC’s Path To Net Zero