Denmark Anti Static Brush Market (2026-2032) | Segmentation, Forecast, Growth, Revenue, Outlook, Industry, Value, Analysis, Size, Trends, Share & Companies
Market Forecast By Product (Toothbrush Type, Paint Brush Type, U Type, Special Type), By Application (Electronic Components, Static Charge Sensitive Products) And Competitive Landscape
| Product Code: ETC5092063 | Publication Date: Nov 2023 | Updated Date: Apr 2026 | Product Type: Market Research Report | |
| Publisher: 6Wresearch | Author: Shubham Padhi | No. of Pages: 60 | No. of Figures: 30 | No. of Tables: 5 |
Denmark Anti Static Brush Market Size (2020-2030)
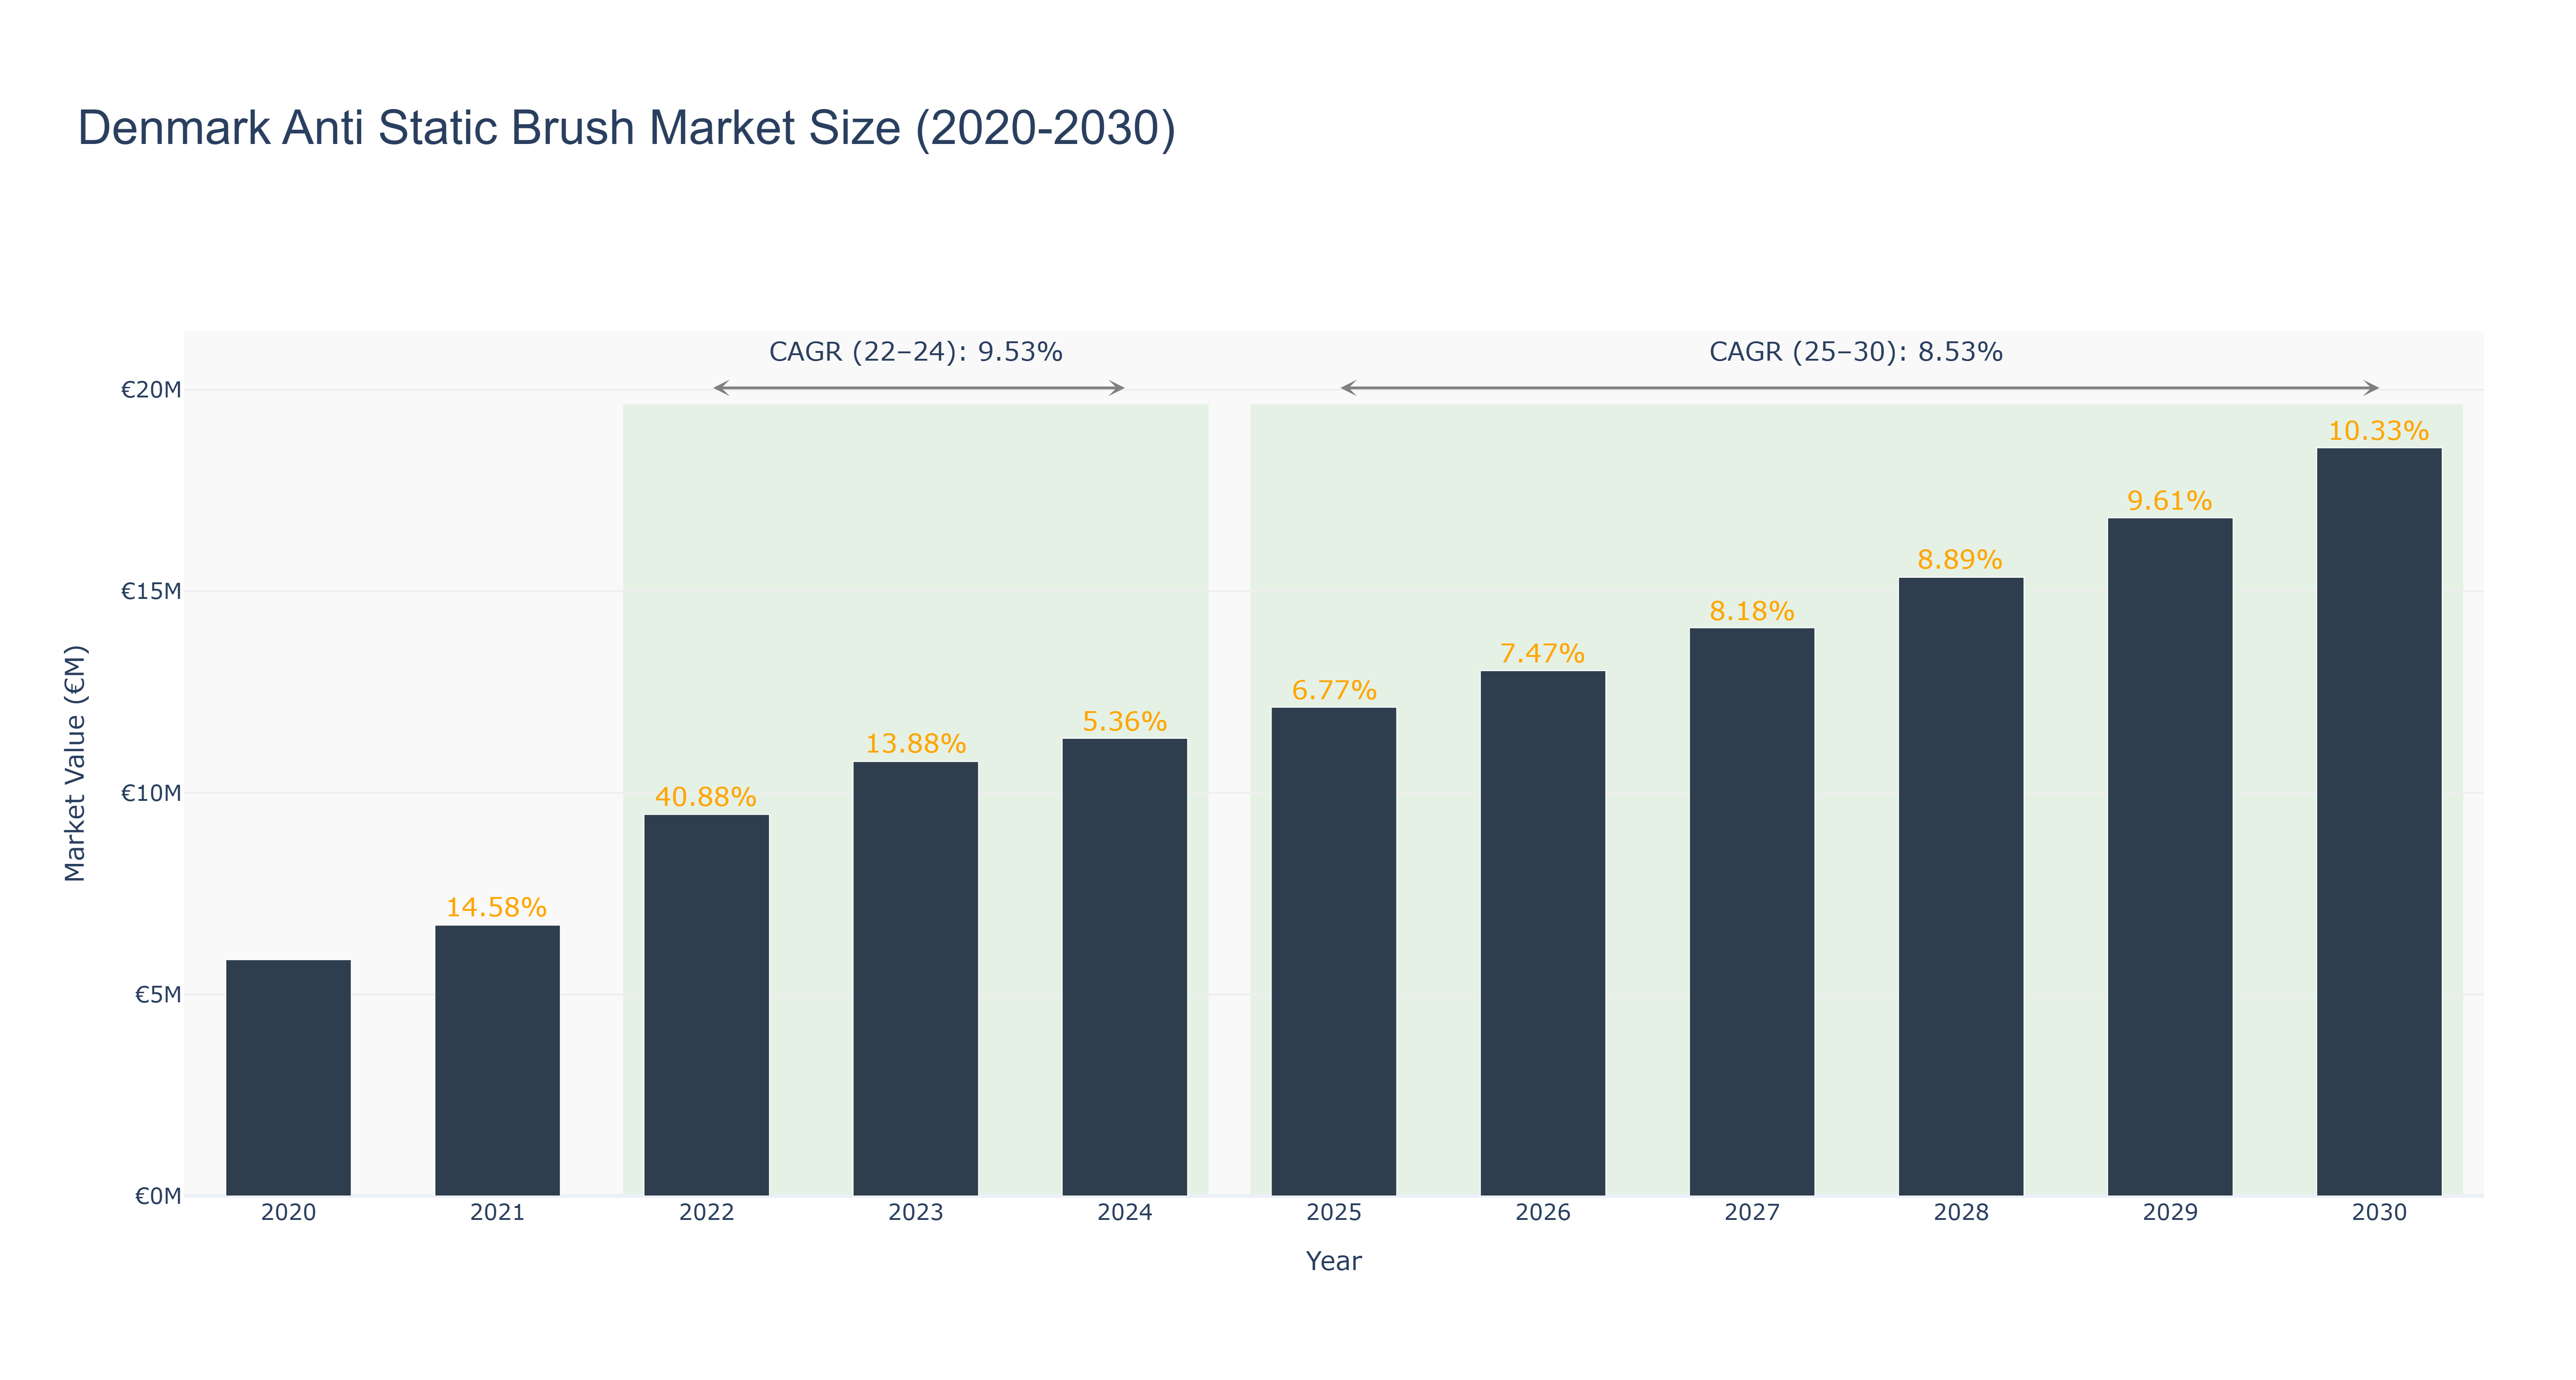
The Denmark Anti Static Brush Market has shown a steady growth trajectory over the years. The peak market size of €18.56 million is forecasted for 2030, with an impressive CAGR of 10.33%. From 2020 to 2024, the market size increased from €5.86 million to €11.36 million, showcasing a positive growth trend. The market experienced a significant growth spike from 2024 to 2025, attributed to increased demand for anti-static solutions in various industries. Looking ahead, the market is expected to maintain a healthy growth rate, driven by advancements in technology and the increasing focus on industrial safety. Recent developments in sustainable anti-static brush materials and innovative product designs are set to further propel market expansion in the coming years.
Denmark Anti Static Brush Market: Production & Trade Performance (2019-2025)
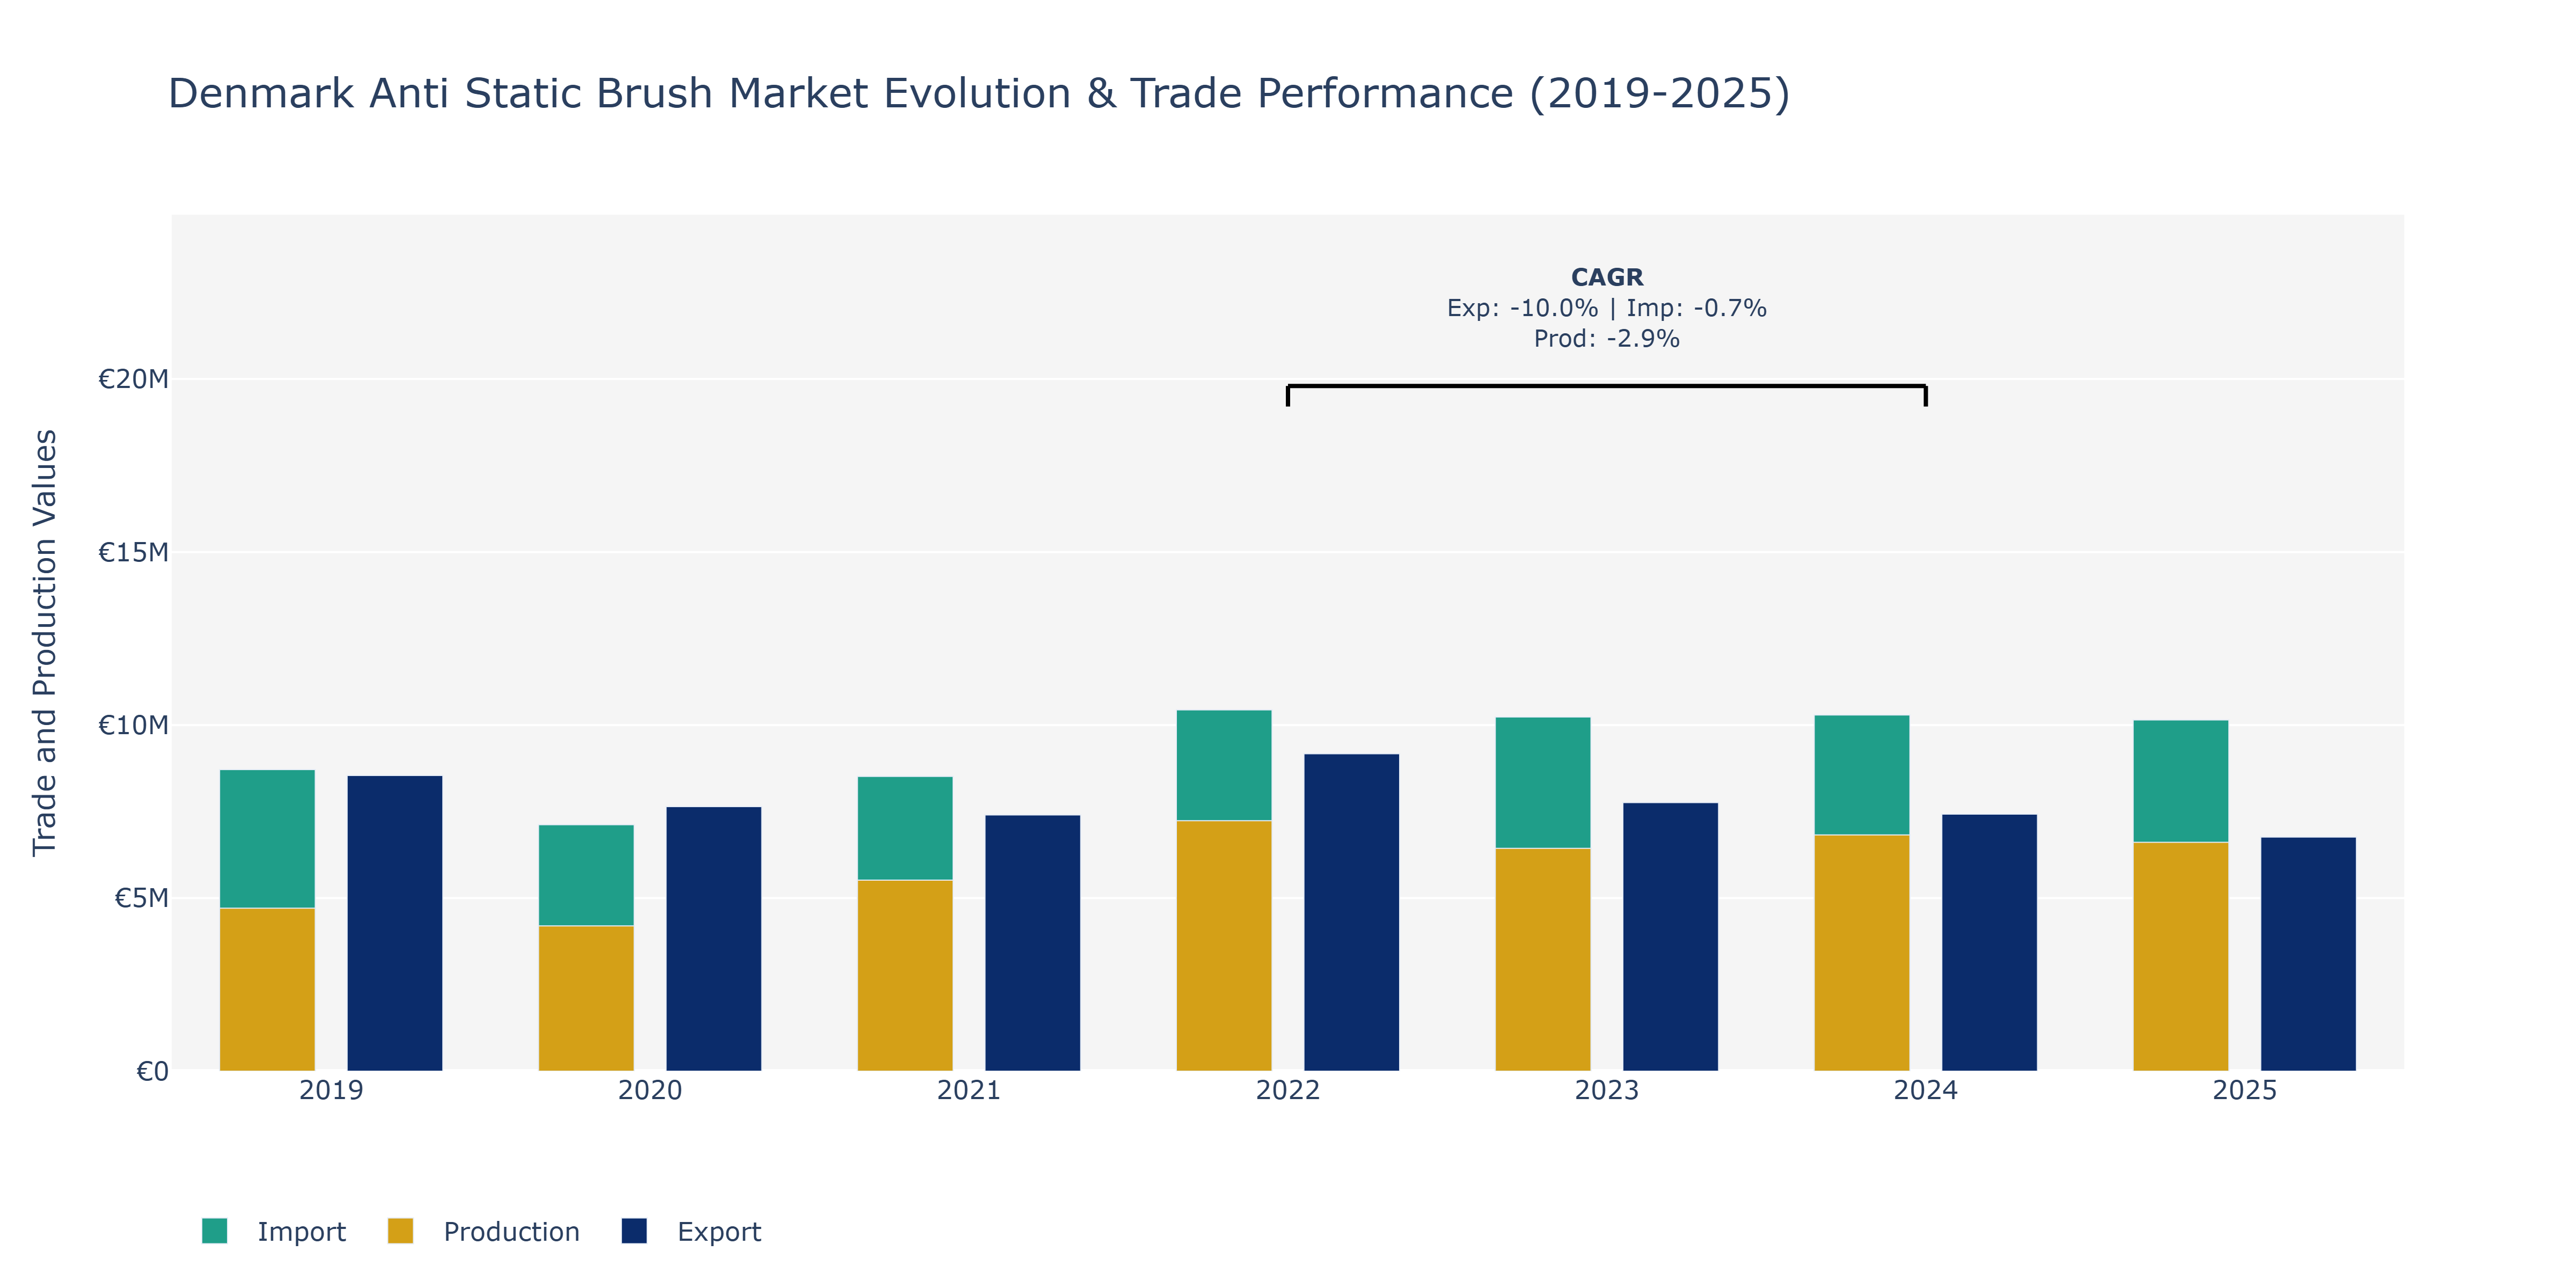
In the Denmark Anti Static Brush Market, from 2019 to 2025, a mixed pattern emerges for Exports, Imports, and Production. Exports started at €8.54 million in 2019, decreased to €6.76 million in 2025, with a notable peak in 2022 at €9.17 million. Imports rose from €8.71 million in 2019 to €10.15 million in 2025, hitting a peak in 2024 at €10.29 million. Production increased from €4.71 million in 2019 to €6.61 million in 2025, with the highest value recorded in 2022 at €7.24 million. The decline in Exports from 2022 to 2025 could be attributed to evolving global trade dynamics, impacting the demand for anti-static brushes. Conversely, the steady rise in Imports suggests a growing reliance on foreign suppliers, possibly due to cost advantages or specialized product offerings. The fluctuation in Production reflects market adjustments to changing consumer preferences and technological advancements, indicating the industry's adaptability to stay competitive.
Key Highlights of the Report:
- Denmark Anti Static Brush Market Outlook
- Market Size of Denmark Anti Static Brush Market, 2025
- Forecast of Denmark Anti Static Brush Market, 2032
- Historical Data and Forecast of Denmark Anti Static Brush Revenues & Volume for the Period 2022 - 2032F
- Denmark Anti Static Brush Market Trend Evolution
- Denmark Anti Static Brush Market Drivers and Challenges
- Denmark Anti Static Brush Price Trends
- Denmark Anti Static Brush Porter`s Five Forces
- Denmark Anti Static Brush Industry Life Cycle
- Historical Data and Forecast of Denmark Anti Static Brush Market Revenues & Volume By Product for the Period 2022 - 2032F
- Historical Data and Forecast of Denmark Anti Static Brush Market Revenues & Volume By Toothbrush Type for the Period 2022 - 2032F
- Historical Data and Forecast of Denmark Anti Static Brush Market Revenues & Volume By Paint Brush Type for the Period 2022 - 2032F
- Historical Data and Forecast of Denmark Anti Static Brush Market Revenues & Volume By U Type for the Period 2022 - 2032F
- Historical Data and Forecast of Denmark Anti Static Brush Market Revenues & Volume By Special Type for the Period 2022 - 2032F
- Historical Data and Forecast of Denmark Anti Static Brush Market Revenues & Volume By Application for the Period 2022 - 2032F
- Historical Data and Forecast of Denmark Anti Static Brush Market Revenues & Volume By Electronic Components for the Period 2022 - 2032F
- Historical Data and Forecast of Denmark Anti Static Brush Market Revenues & Volume By Static Charge Sensitive Products for the Period 2022 - 2032F
- Denmark Anti Static Brush Import Export Trade Statistics
- Market Opportunity Assessment By Product
- Market Opportunity Assessment By Application
- Denmark Anti Static Brush Top Companies Market Share
- Denmark Anti Static Brush Competitive Benchmarking By Technical and Operational Parameters
- Denmark Anti Static Brush Company Profiles
- Denmark Anti Static Brush Key Strategic Recommendations
Frequently Asked Questions About the Market Study (FAQs):
6Wresearch actively monitors the Denmark Anti Static Brush Market and publishes its comprehensive annual report, highlighting emerging trends, growth drivers, revenue analysis, and forecast outlook. Our insights help businesses to make data-backed strategic decisions with ongoing market dynamics. Our analysts track relevent industries related to the Denmark Anti Static Brush Market, allowing our clients with actionable intelligence and reliable forecasts tailored to emerging regional needs.
Yes, we provide customisation as per your requirements. To learn more, feel free to contact us on sales@6wresearch.com
1 Executive Summary |
2 Introduction |
2.1 Key Highlights of the Report |
2.2 Report Description |
2.3 Market Scope & Segmentation |
2.4 Research Methodology |
2.5 Assumptions |
3 Denmark Anti Static Brush Market Overview |
3.1 Denmark Country Macro Economic Indicators |
3.2 Denmark Anti Static Brush Market Revenues & Volume, 2022 & 2032F |
3.3 Denmark Anti Static Brush Market - Industry Life Cycle |
3.4 Denmark Anti Static Brush Market - Porter's Five Forces |
3.5 Denmark Anti Static Brush Market Revenues & Volume Share, By Product, 2022 & 2032F |
3.6 Denmark Anti Static Brush Market Revenues & Volume Share, By Application, 2022 & 2032F |
4 Denmark Anti Static Brush Market Dynamics |
4.1 Impact Analysis |
4.2 Market Drivers |
4.2.1 Increasing demand for electronic devices and components in Denmark |
4.2.2 Growing awareness about the importance of electrostatic discharge (ESD) protection |
4.2.3 Stringent regulations and standards for ESD protection in various industries |
4.3 Market Restraints |
4.3.1 Limited availability of skilled professionals for ESD protection solutions |
4.3.2 High initial investment required for implementing ESD protection measures |
4.3.3 Rapidly changing technology impacting the effectiveness of existing anti-static solutions |
5 Denmark Anti Static Brush Market Trends |
6 Denmark Anti Static Brush Market Segmentations |
6.1 Denmark Anti Static Brush Market, By Product |
6.1.1 Overview and Analysis |
6.1.2 Denmark Anti Static Brush Market Revenues & Volume, By Toothbrush Type, 2022 - 2032F |
6.1.3 Denmark Anti Static Brush Market Revenues & Volume, By Paint Brush Type, 2022 - 2032F |
6.1.4 Denmark Anti Static Brush Market Revenues & Volume, By U Type, 2022 - 2032F |
6.1.5 Denmark Anti Static Brush Market Revenues & Volume, By Special Type, 2022 - 2032F |
6.2 Denmark Anti Static Brush Market, By Application |
6.2.1 Overview and Analysis |
6.2.2 Denmark Anti Static Brush Market Revenues & Volume, By Electronic Components, 2022 - 2032F |
6.2.3 Denmark Anti Static Brush Market Revenues & Volume, By Static Charge Sensitive Products, 2022 - 2032F |
7 Denmark Anti Static Brush Market Import-Export Trade Statistics |
7.1 Denmark Anti Static Brush Market Export to Major Countries |
7.2 Denmark Anti Static Brush Market Imports from Major Countries |
8 Denmark Anti Static Brush Market Key Performance Indicators |
8.1 Number of ESD-related incidents reported in Denmark |
8.2 Adoption rate of ESD protection measures in key industries |
8.3 Percentage of companies in Denmark compliant with ESD regulations and standards |
8.4 Research and development investment in innovative anti-static brush technologies in Denmark |
8.5 Number of partnerships and collaborations between ESD protection solution providers and industries in Denmark |
9 Denmark Anti Static Brush Market - Opportunity Assessment |
9.1 Denmark Anti Static Brush Market Opportunity Assessment, By Product, 2022 & 2032F |
9.2 Denmark Anti Static Brush Market Opportunity Assessment, By Application, 2022 & 2032F |
10 Denmark Anti Static Brush Market - Competitive Landscape |
10.1 Denmark Anti Static Brush Market Revenue Share, By Companies, 2025 |
10.2 Denmark Anti Static Brush Market Competitive Benchmarking, By Operating and Technical Parameters |
11 Company Profiles |
12 Recommendations | 13 Disclaimer |
Global Go To Market Strategy - 2030
Export potential enables firms to identify high-growth global markets with greater confidence by combining advanced trade intelligence with a structured quantitative methodology. The framework analyzes emerging demand trends and country-level import patterns while integrating macroeconomic and trade datasets such as GDP and population forecasts, bilateral import–export flows, tariff structures, elasticity differentials between developed and developing economies, geographic distance, and import demand projections. Using weighted trade values from 2020–2024 as the base period to project country-to-country export potential for 2030, these inputs are operationalized through calculated drivers such as gravity model parameters, tariff impact factors, and projected GDP per-capita growth. Through an analysis of hidden potentials, demand hotspots, and market conditions that are most favorable to success, this method enables firms to focus on target countries, maximize returns, and global expansion with data, backed by accuracy.
By factoring in the projected importer demand gap that is currently unmet and could be potential opportunity, it identifies the potential for the Exporter (Country) among 190 countries, against the general trade analysis, which identifies the biggest importer or exporter.
To discover high-growth global markets and optimize your business strategy:
Click Here
Pricing
- Single User License$ 1,995
- Department License$ 2,400
- Site License$ 3,120
- Global License$ 3,795

Leadership Perspectives from Industry Events
Search
Thought Leadership and Analyst Meet


Our Clients
6WResearch In News
- India Export Attractiveness Tracker 2026
- India Air Conditioner Market Set for Strong Rebound in 2026 After Weather-Led Correction and GST-Driven Recovery: 6Wresearch
- ADAS in India: How Automatic Emergency Braking, Blind Spot Detection & Driver Monitoring are Transforming Road Safety
- Doha a strategic location for EV manufacturing hub: IPA Qatar
- Demand for luxury TVs surging in the GCC, says Samsung
- Empowering Growth: The Thriving Journey of Bangladesh’s Cable Industry
Latest Reports
- Nicaragua RPG Gaming Market (2026-2032)
- New Zealand RPG Gaming Market (2026-2032)
- Netherlands RPG Gaming Market (2026-2032)
- Nauru RPG Gaming Market (2026-2032)
- Namibia RPG Gaming Market (2026-2032)
- Mozambique RPG Gaming Market (2026-2032)
- Montenegro RPG Gaming Market (2026-2032)
- Mongolia RPG Gaming Market (2026-2032)
- Monaco RPG Gaming Market (2026-2032)
- Micronesia RPG Gaming Market (2026-2032)
Industry Events and Analyst Meet

EV India Expo 2026

HIMTEX 2026

India Refining Summit 2026

India EV Show 2026

EV tech India Expo 2026
Whitepaper
- Middle East & Africa Commercial Security Market Click here to view more.
- Middle East & Africa Fire Safety Systems & Equipment Market Click here to view more.
- GCC Drone Market Click here to view more.
- Middle East Lighting Fixture Market Click here to view more.
- GCC Physical & Perimeter Security Market Click here to view more.