Denmark Artificial Flowers Market (2025-2031) | Share, Revenue, Size, Outlook, Industry, Forecast, Companies, Trends, Analysis, Growth, Segmentation & Value
Market Forecast By Material Type (Clay & Porcelain, Cotton & Silk, Leather & Nylon, Paper & Wax, Plastic & Polyester), By Application (Commercial, Residential) And Competitive Landscape
| Product Code: ETC4982604 | Publication Date: Nov 2023 | Updated Date: Apr 2026 | Product Type: Market Research Report | |
| Publisher: 6Wresearch | Author: Shubham Padhi | No. of Pages: 60 | No. of Figures: 30 | No. of Tables: 5 |
Denmark Artificial Flowers Market Size (2020-2030)
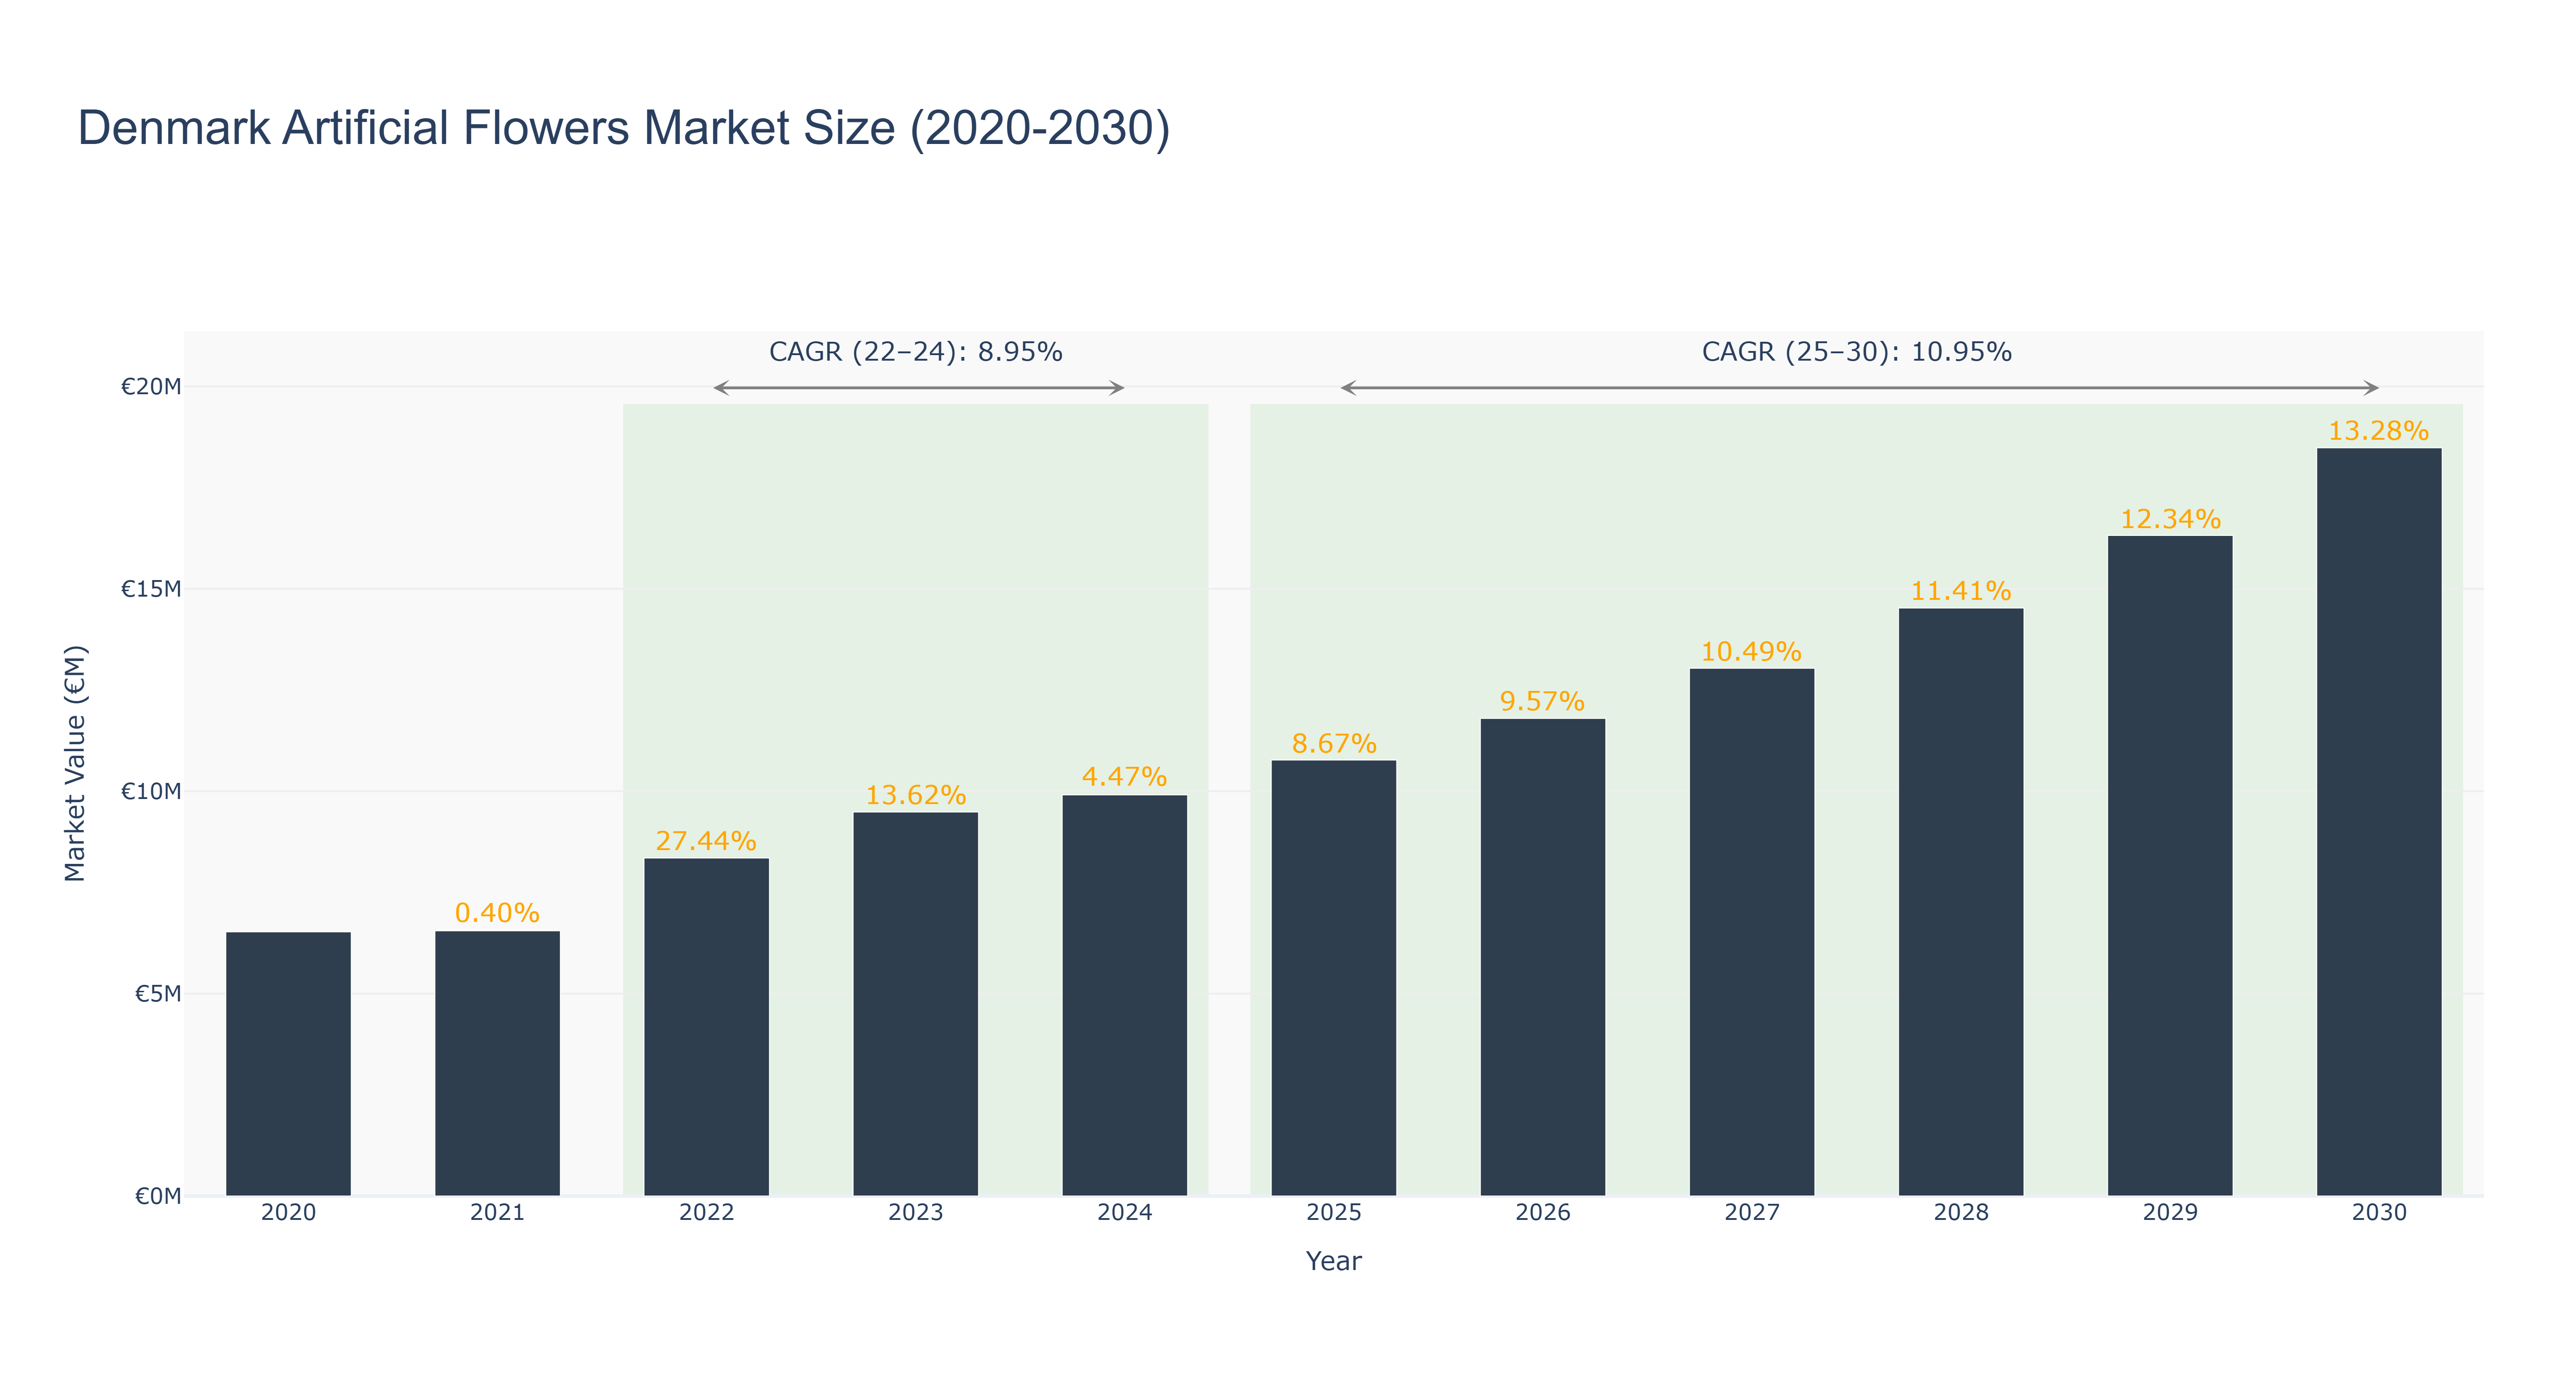
Denmark Artificial Flowers Market has shown a steady growth trajectory over the years. The peak market size of €18.48 million is forecasted for 2030, with a notable increase from €6.52 million in 2020 to €9.91 million in 2024. The market is expected to continue its upward trend, with a projected size of €13.04 million in 2027. The CAGR for the period 2022-24 stands at 8.95%, reflecting a moderate growth phase, while the CAGR for 2025-30 is estimated at 10.95%, indicating an accelerated expansion. Industry drivers such as increasing consumer preference for sustainable decor options and rising demand for artificial flowers in events and home decor contribute to this growth. Looking ahead, Denmark is focusing on innovative eco-friendly artificial flower designs to meet the evolving consumer demands, ensuring a promising future for the market.
Denmark Artificial Flowers Market: Production & Trade Performance (2019-2025)
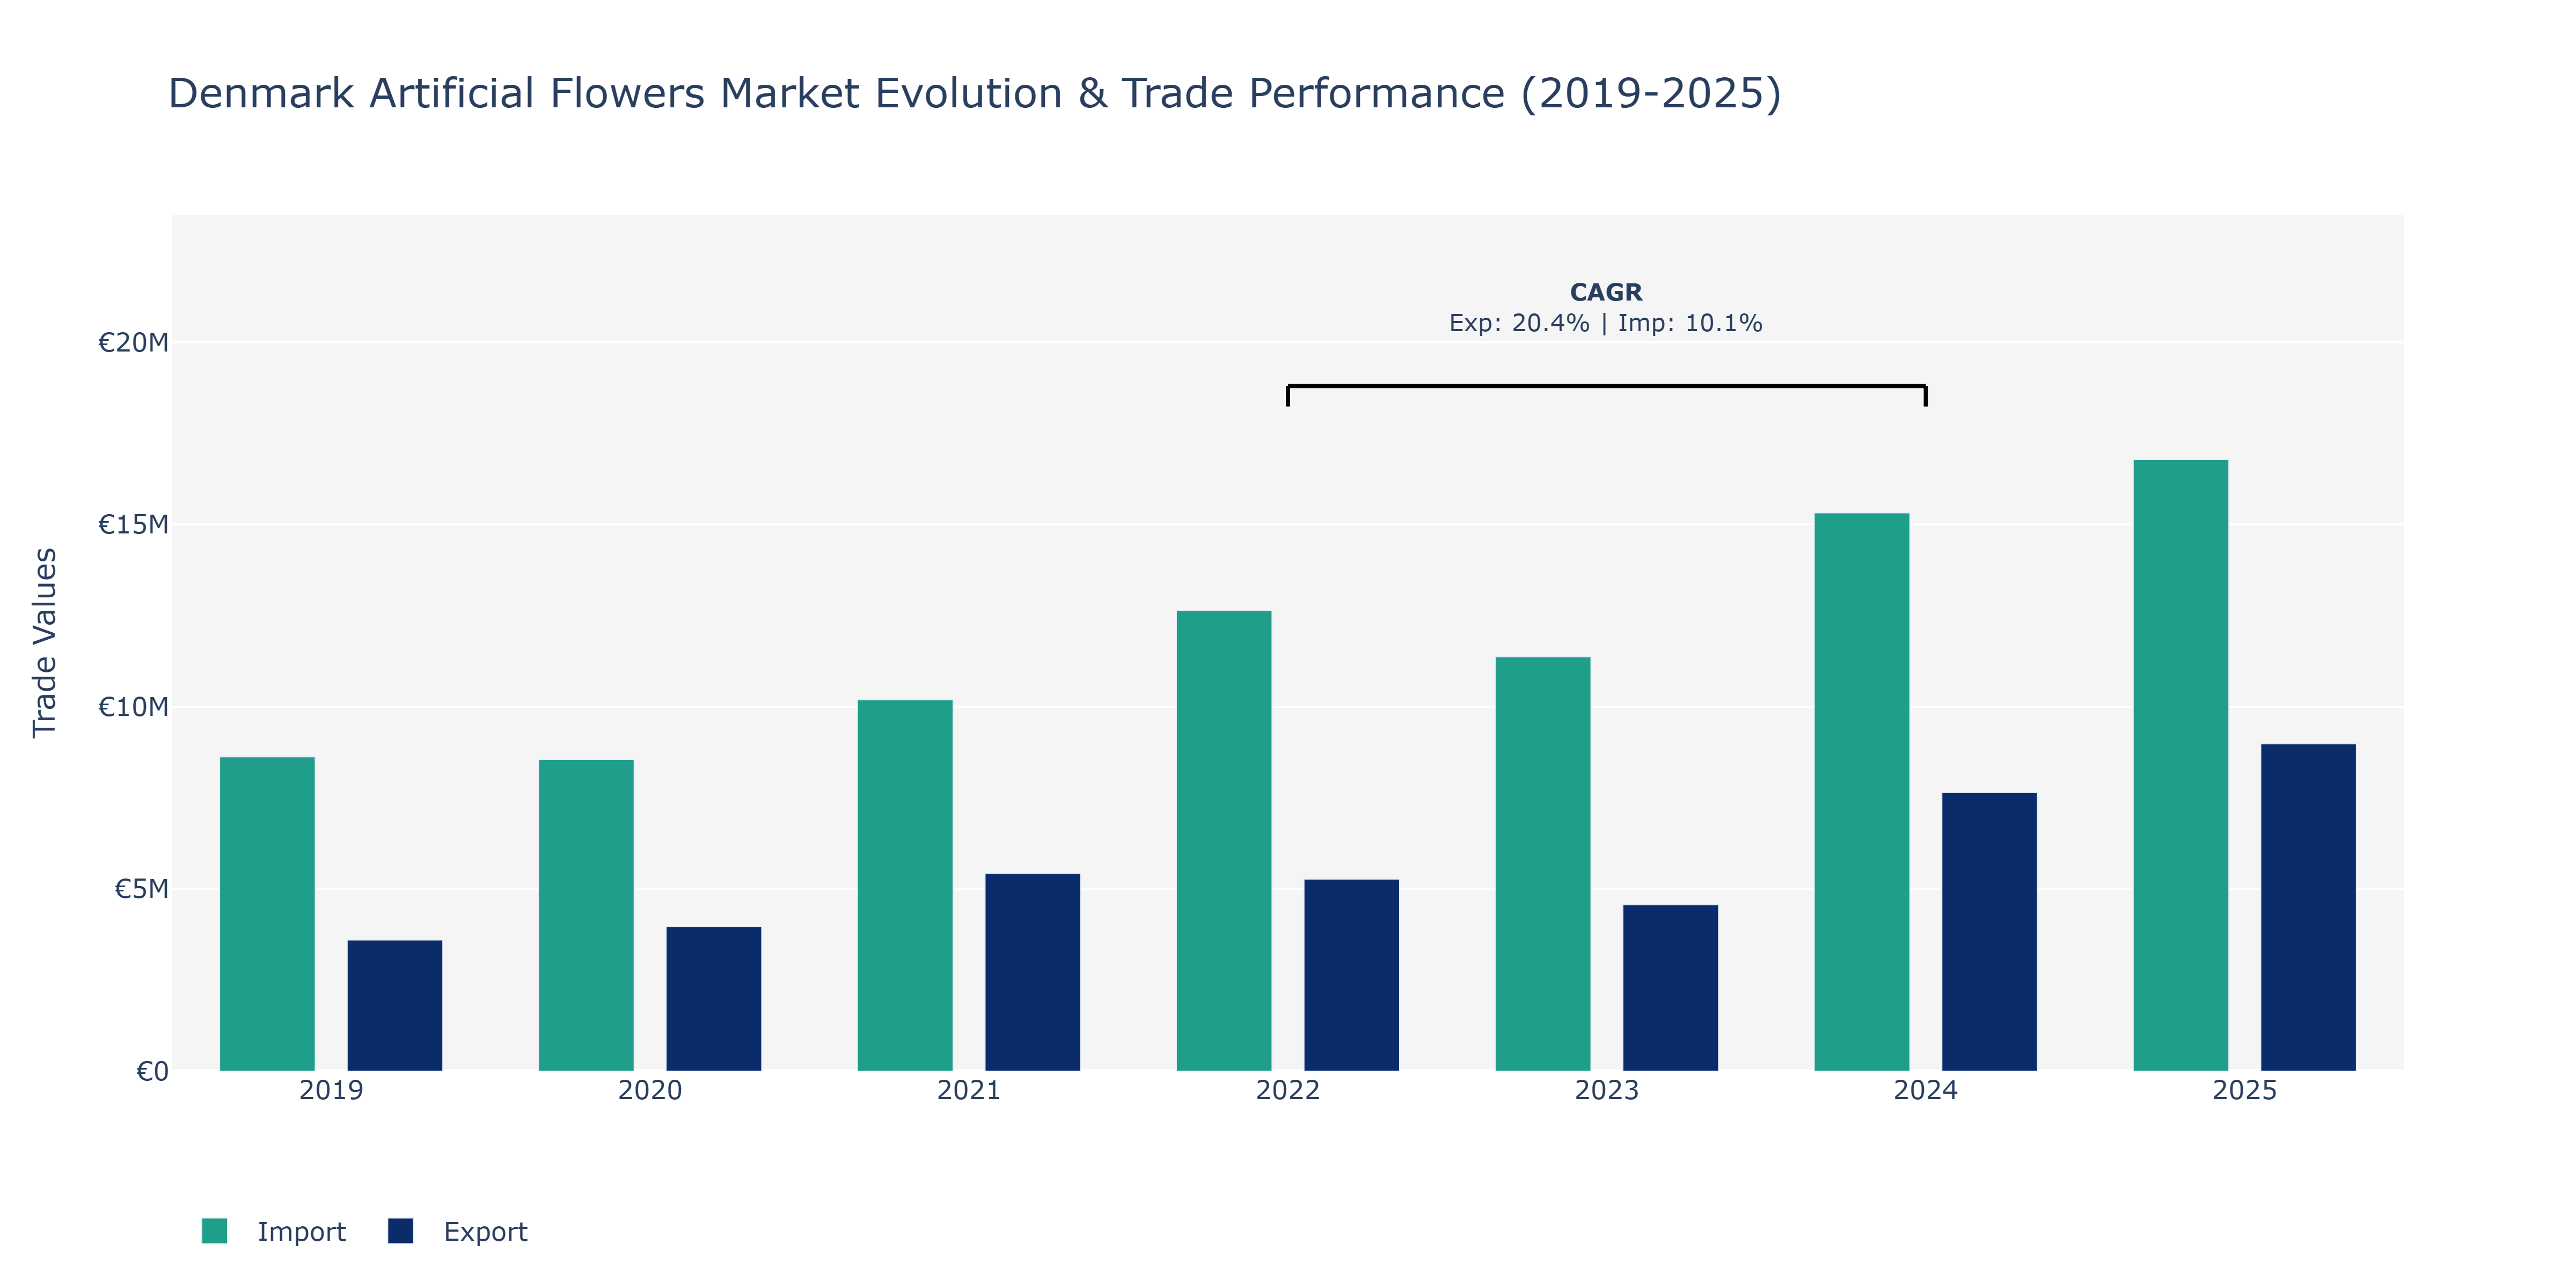
Between 2019 and 2025, Denmark's Artificial Flowers Market saw notable shifts in both exports and imports. Exports grew steadily from €3.6 million in 2019 to approximately €9 billion in 2025, indicating a consistent upward trajectory with a peak in 2025. In contrast, imports followed a similar trend but at a higher value, increasing from €8.62 million in 2019 to around €16.79 million in 2025. The peak points for both exports and imports align in 2025, showcasing a significant expansion in market activity. Factors contributing to this growth could include increased demand for artificial flowers in home decor, events, and gifting, potentially driven by lifestyle trends favoring sustainable and long-lasting floral alternatives. The expanding e-commerce landscape may have also played a role, facilitating international trade and providing consumers with a wider selection of artificial flower products.
Key Highlights of the Report:
- Denmark Artificial Flowers Market Outlook
- Market Size of Denmark Artificial Flowers Market, 2024
- Forecast of Denmark Artificial Flowers Market, 2031
- Historical Data and Forecast of Denmark Artificial Flowers Revenues & Volume for the Period 2021-2031
- Denmark Artificial Flowers Market Trend Evolution
- Denmark Artificial Flowers Market Drivers and Challenges
- Denmark Artificial Flowers Price Trends
- Denmark Artificial Flowers Porter`s Five Forces
- Denmark Artificial Flowers Industry Life Cycle
- Historical Data and Forecast of Denmark Artificial Flowers Market Revenues & Volume By Material Type for the Period 2021-2031
- Historical Data and Forecast of Denmark Artificial Flowers Market Revenues & Volume By Clay & Porcelain for the Period 2021-2031
- Historical Data and Forecast of Denmark Artificial Flowers Market Revenues & Volume By Cotton & Silk for the Period 2021-2031
- Historical Data and Forecast of Denmark Artificial Flowers Market Revenues & Volume By Leather & Nylon for the Period 2021-2031
- Historical Data and Forecast of Denmark Artificial Flowers Market Revenues & Volume By Paper & Wax for the Period 2021-2031
- Historical Data and Forecast of Denmark Artificial Flowers Market Revenues & Volume By Plastic & Polyester for the Period 2021-2031
- Historical Data and Forecast of Denmark Artificial Flowers Market Revenues & Volume By Application for the Period 2021-2031
- Historical Data and Forecast of Denmark Artificial Flowers Market Revenues & Volume By Commercial for the Period 2021-2031
- Historical Data and Forecast of Denmark Artificial Flowers Market Revenues & Volume By Residential for the Period 2021-2031
- Denmark Artificial Flowers Import Export Trade Statistics
- Market Opportunity Assessment By Material Type
- Market Opportunity Assessment By Application
- Denmark Artificial Flowers Top Companies Market Share
- Denmark Artificial Flowers Competitive Benchmarking By Technical and Operational Parameters
- Denmark Artificial Flowers Company Profiles
- Denmark Artificial Flowers Key Strategic Recommendations
Frequently Asked Questions About the Market Study (FAQs):
6Wresearch actively monitors the Denmark Artificial Flowers Market and publishes its comprehensive annual report, highlighting emerging trends, growth drivers, revenue analysis, and forecast outlook. Our insights help businesses to make data-backed strategic decisions with ongoing market dynamics. Our analysts track relevent industries related to the Denmark Artificial Flowers Market, allowing our clients with actionable intelligence and reliable forecasts tailored to emerging regional needs.
Yes, we provide customisation as per your requirements. To learn more, feel free to contact us on sales@6wresearch.com
1 Executive Summary |
2 Introduction |
2.1 Key Highlights of the Report |
2.2 Report Description |
2.3 Market Scope & Segmentation |
2.4 Research Methodology |
2.5 Assumptions |
3 Denmark Artificial Flowers Market Overview |
3.1 Denmark Country Macro Economic Indicators |
3.2 Denmark Artificial Flowers Market Revenues & Volume, 2021 & 2031F |
3.3 Denmark Artificial Flowers Market - Industry Life Cycle |
3.4 Denmark Artificial Flowers Market - Porter's Five Forces |
3.5 Denmark Artificial Flowers Market Revenues & Volume Share, By Material Type, 2021 & 2031F |
3.6 Denmark Artificial Flowers Market Revenues & Volume Share, By Application, 2021 & 2031F |
4 Denmark Artificial Flowers Market Dynamics |
4.1 Impact Analysis |
4.2 Market Drivers |
4.2.1 Increasing trend towards sustainable and eco-friendly products in Denmark |
4.2.2 Growing demand for low-maintenance home decor solutions |
4.2.3 Rise in the use of artificial flowers for event decorations and weddings |
4.3 Market Restraints |
4.3.1 Competition from fresh flower market and growing trend towards natural decor |
4.3.2 Perception of artificial flowers being less aesthetically pleasing compared to fresh flowers |
4.3.3 Price sensitivity of consumers towards artificial flowers |
5 Denmark Artificial Flowers Market Trends |
6 Denmark Artificial Flowers Market Segmentations |
6.1 Denmark Artificial Flowers Market, By Material Type |
6.1.1 Overview and Analysis |
6.1.2 Denmark Artificial Flowers Market Revenues & Volume, By Clay & Porcelain, 2021-2031F |
6.1.3 Denmark Artificial Flowers Market Revenues & Volume, By Cotton & Silk, 2021-2031F |
6.1.4 Denmark Artificial Flowers Market Revenues & Volume, By Leather & Nylon, 2021-2031F |
6.1.5 Denmark Artificial Flowers Market Revenues & Volume, By Paper & Wax, 2021-2031F |
6.1.6 Denmark Artificial Flowers Market Revenues & Volume, By Plastic & Polyester, 2021-2031F |
6.2 Denmark Artificial Flowers Market, By Application |
6.2.1 Overview and Analysis |
6.2.2 Denmark Artificial Flowers Market Revenues & Volume, By Commercial, 2021-2031F |
6.2.3 Denmark Artificial Flowers Market Revenues & Volume, By Residential, 2021-2031F |
7 Denmark Artificial Flowers Market Import-Export Trade Statistics |
7.1 Denmark Artificial Flowers Market Export to Major Countries |
7.2 Denmark Artificial Flowers Market Imports from Major Countries |
8 Denmark Artificial Flowers Market Key Performance Indicators |
8.1 Percentage increase in online searches for artificial flowers in Denmark |
8.2 Number of partnerships with event planning companies for artificial flower decorations |
8.3 Growth in the variety of artificial flowers offered by suppliers |
9 Denmark Artificial Flowers Market - Opportunity Assessment |
9.1 Denmark Artificial Flowers Market Opportunity Assessment, By Material Type, 2021 & 2031F |
9.2 Denmark Artificial Flowers Market Opportunity Assessment, By Application, 2021 & 2031F |
10 Denmark Artificial Flowers Market - Competitive Landscape |
10.1 Denmark Artificial Flowers Market Revenue Share, By Companies, 2024 |
10.2 Denmark Artificial Flowers Market Competitive Benchmarking, By Operating and Technical Parameters |
11 Company Profiles |
12 Recommendations | 13 Disclaimer |
Global Go To Market Strategy - 2030
Export potential enables firms to identify high-growth global markets with greater confidence by combining advanced trade intelligence with a structured quantitative methodology. The framework analyzes emerging demand trends and country-level import patterns while integrating macroeconomic and trade datasets such as GDP and population forecasts, bilateral import–export flows, tariff structures, elasticity differentials between developed and developing economies, geographic distance, and import demand projections. Using weighted trade values from 2020–2024 as the base period to project country-to-country export potential for 2030, these inputs are operationalized through calculated drivers such as gravity model parameters, tariff impact factors, and projected GDP per-capita growth. Through an analysis of hidden potentials, demand hotspots, and market conditions that are most favorable to success, this method enables firms to focus on target countries, maximize returns, and global expansion with data, backed by accuracy.
By factoring in the projected importer demand gap that is currently unmet and could be potential opportunity, it identifies the potential for the Exporter (Country) among 190 countries, against the general trade analysis, which identifies the biggest importer or exporter.
To discover high-growth global markets and optimize your business strategy:
Click Here
Pricing
- Single User License$ 1,995
- Department License$ 2,400
- Site License$ 3,120
- Global License$ 3,795

Leadership Perspectives from Industry Events
Search
Thought Leadership and Analyst Meet


Our Clients
6WResearch In News
- India Export Attractiveness Tracker 2026
- India Air Conditioner Market Set for Strong Rebound in 2026 After Weather-Led Correction and GST-Driven Recovery: 6Wresearch
- ADAS in India: How Automatic Emergency Braking, Blind Spot Detection & Driver Monitoring are Transforming Road Safety
- Doha a strategic location for EV manufacturing hub: IPA Qatar
- Demand for luxury TVs surging in the GCC, says Samsung
- Empowering Growth: The Thriving Journey of Bangladesh’s Cable Industry
Latest Reports
- Nicaragua RPG Gaming Market (2026-2032)
- New Zealand RPG Gaming Market (2026-2032)
- Netherlands RPG Gaming Market (2026-2032)
- Nauru RPG Gaming Market (2026-2032)
- Namibia RPG Gaming Market (2026-2032)
- Mozambique RPG Gaming Market (2026-2032)
- Montenegro RPG Gaming Market (2026-2032)
- Mongolia RPG Gaming Market (2026-2032)
- Monaco RPG Gaming Market (2026-2032)
- Micronesia RPG Gaming Market (2026-2032)
Industry Events and Analyst Meet

EV India Expo 2026

HIMTEX 2026

India Refining Summit 2026

India EV Show 2026

EV tech India Expo 2026
Whitepaper
- Middle East & Africa Commercial Security Market Click here to view more.
- Middle East & Africa Fire Safety Systems & Equipment Market Click here to view more.
- GCC Drone Market Click here to view more.
- Middle East Lighting Fixture Market Click here to view more.
- GCC Physical & Perimeter Security Market Click here to view more.