Denmark Automated Curtains Market (2026-2032) | Segmentation, Analysis, Outlook, Share, Growth, Companies, Trends, Forecast, Competitive Landscape, Size & Revenue, Value, Industry
Market Forecast By Product (Ripplefold, Pinch Pleat), By Application (Residential, Commercial) And Competitive Landscape
| Product Code: ETC6953232 | Publication Date: Sep 2024 | Updated Date: Apr 2026 | Product Type: Market Research Report | |
| Publisher: 6Wresearch | Author: Sumit Sagar | No. of Pages: 75 | No. of Figures: 35 | No. of Tables: 20 |
Denmark Automated Curtains Market Size (2020-2030)
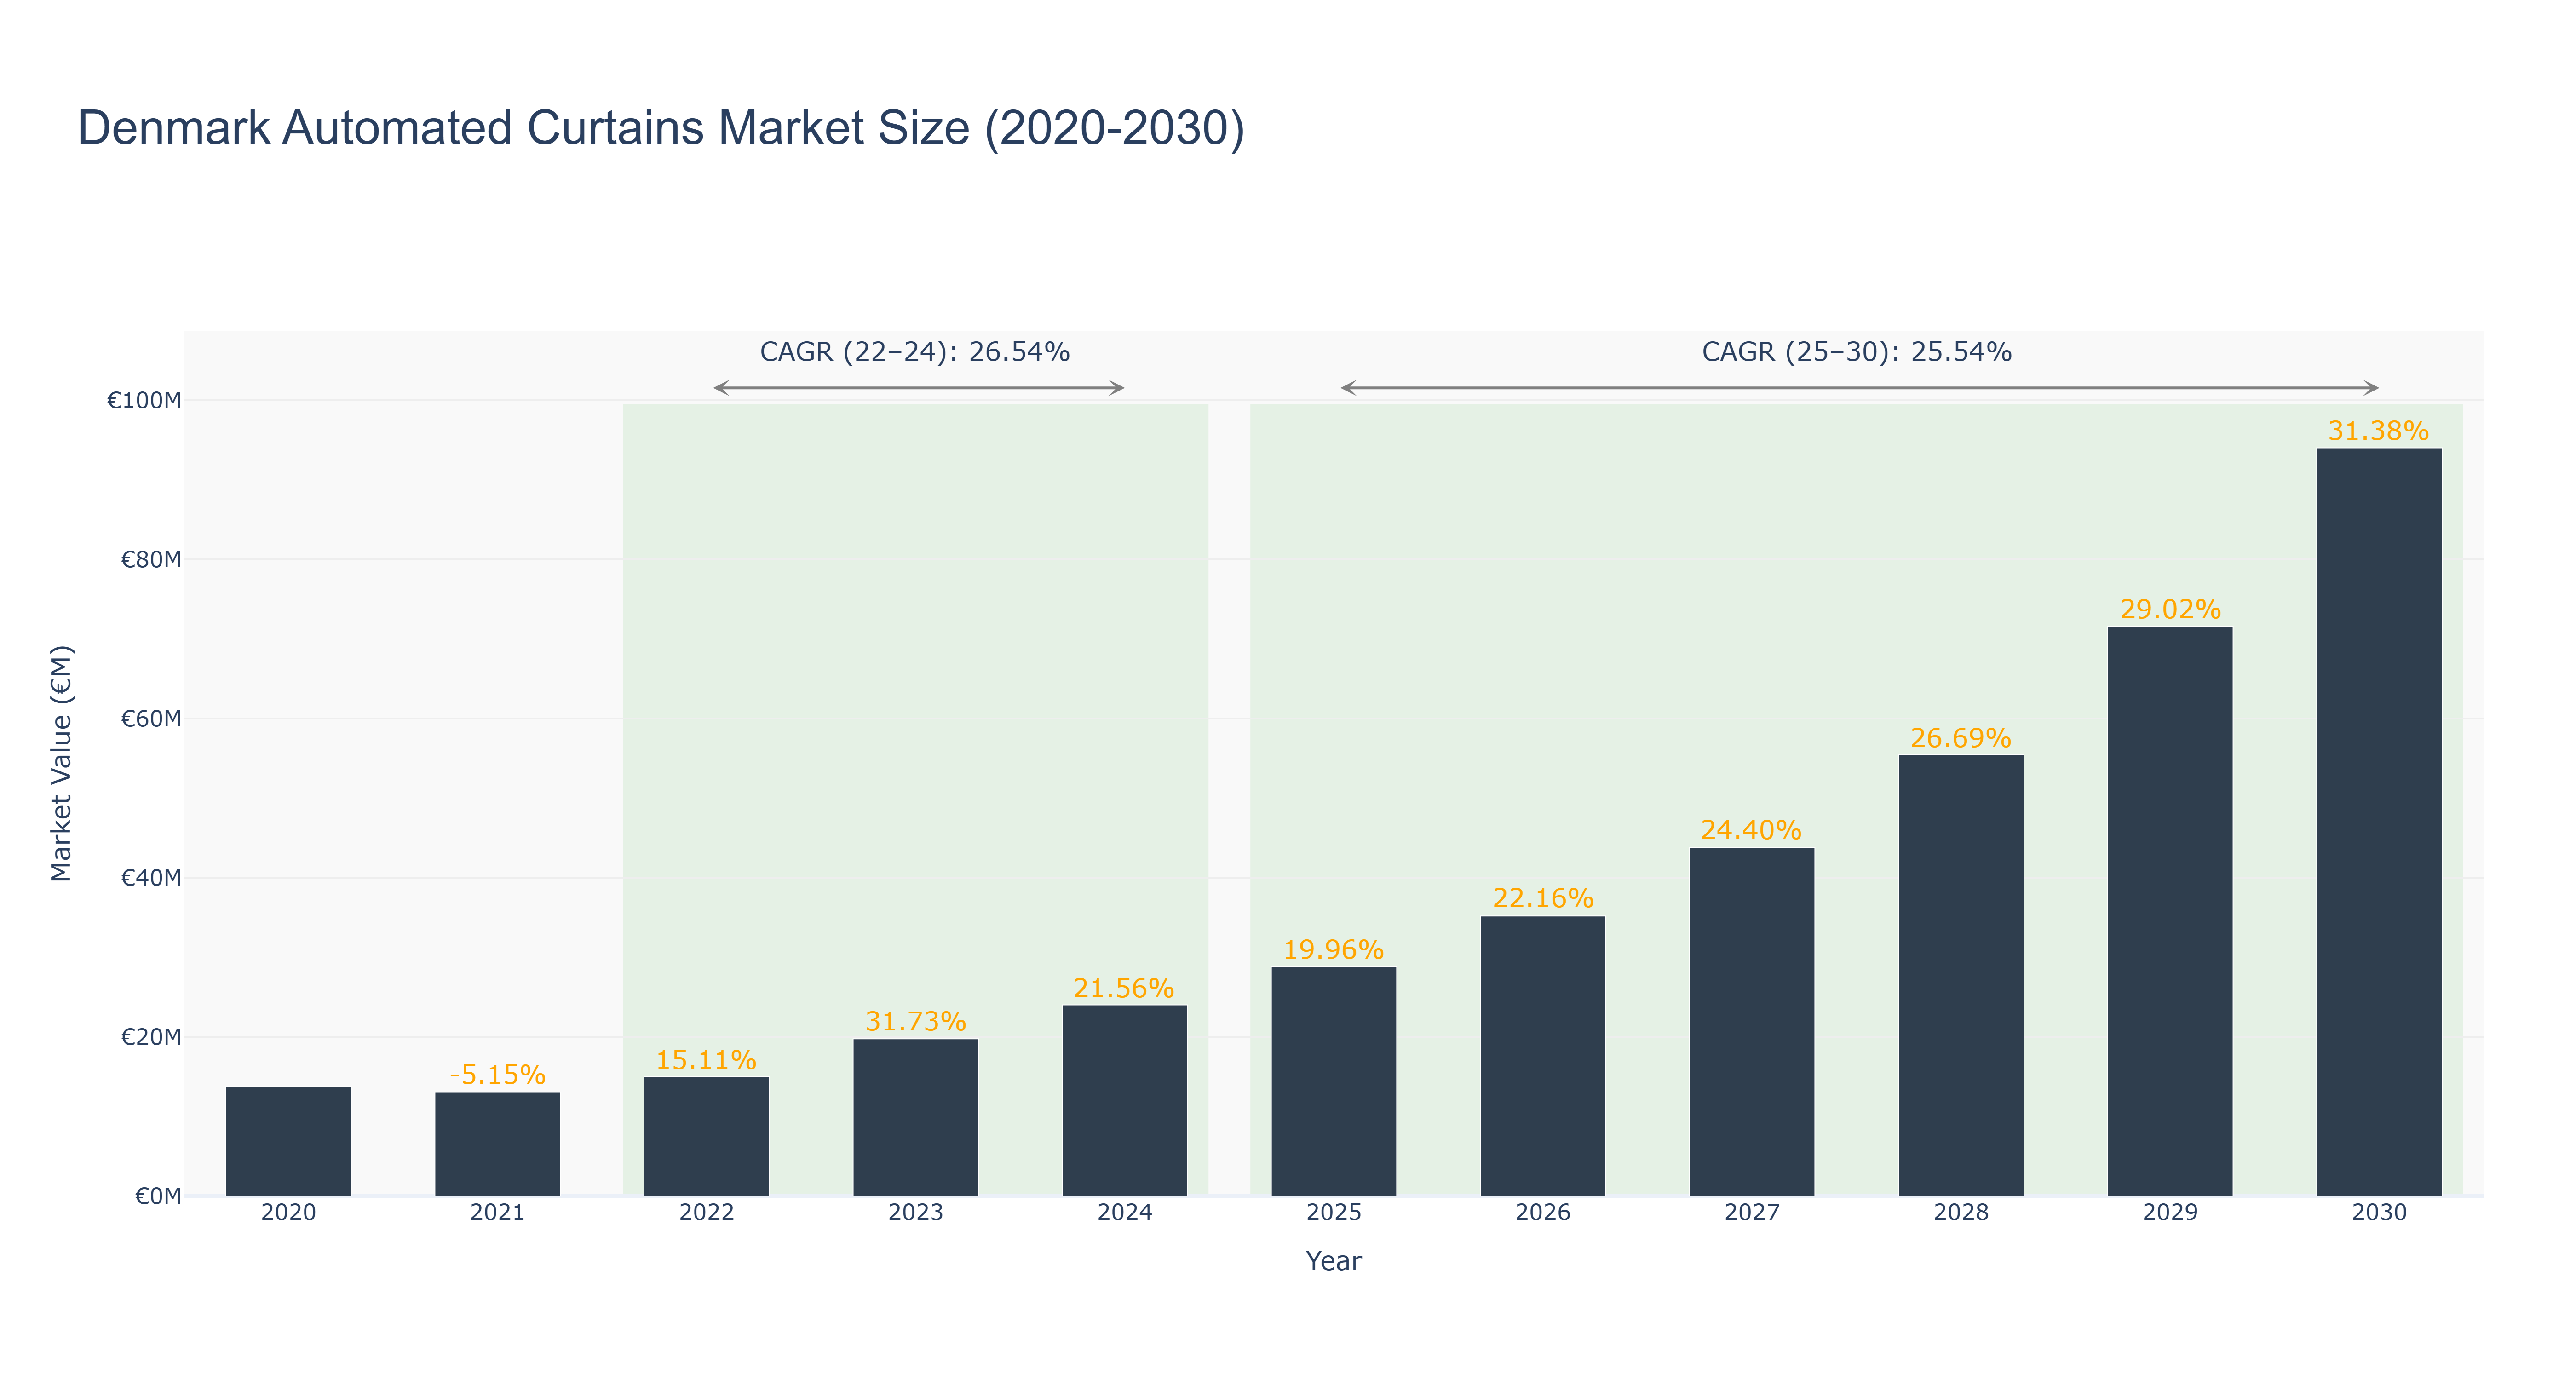
The Denmark Automated Curtains Market has shown a steady growth trajectory over the years. The peak market size of €94.03 million is forecasted for 2030, with notable growth rates in the upcoming years. From 2020 to 2024, the market size increased from €13.74 million to €24.02 million, driven by increasing consumer demand for smart home solutions. The market is expected to continue its growth momentum, with a CAGR of 26.54% from 2022 to 2024 and 25.54% from 2025 to 2030. The significant rise in market size can be attributed to technological advancements, energy efficiency benefits, and the growing trend towards home automation. Looking ahead, Denmark is set to witness the launch of a government-backed initiative promoting sustainable living, further boosting the demand for automated curtains in the market.
Denmark Automated Curtains Market: Production & Trade Performance (2019-2025)
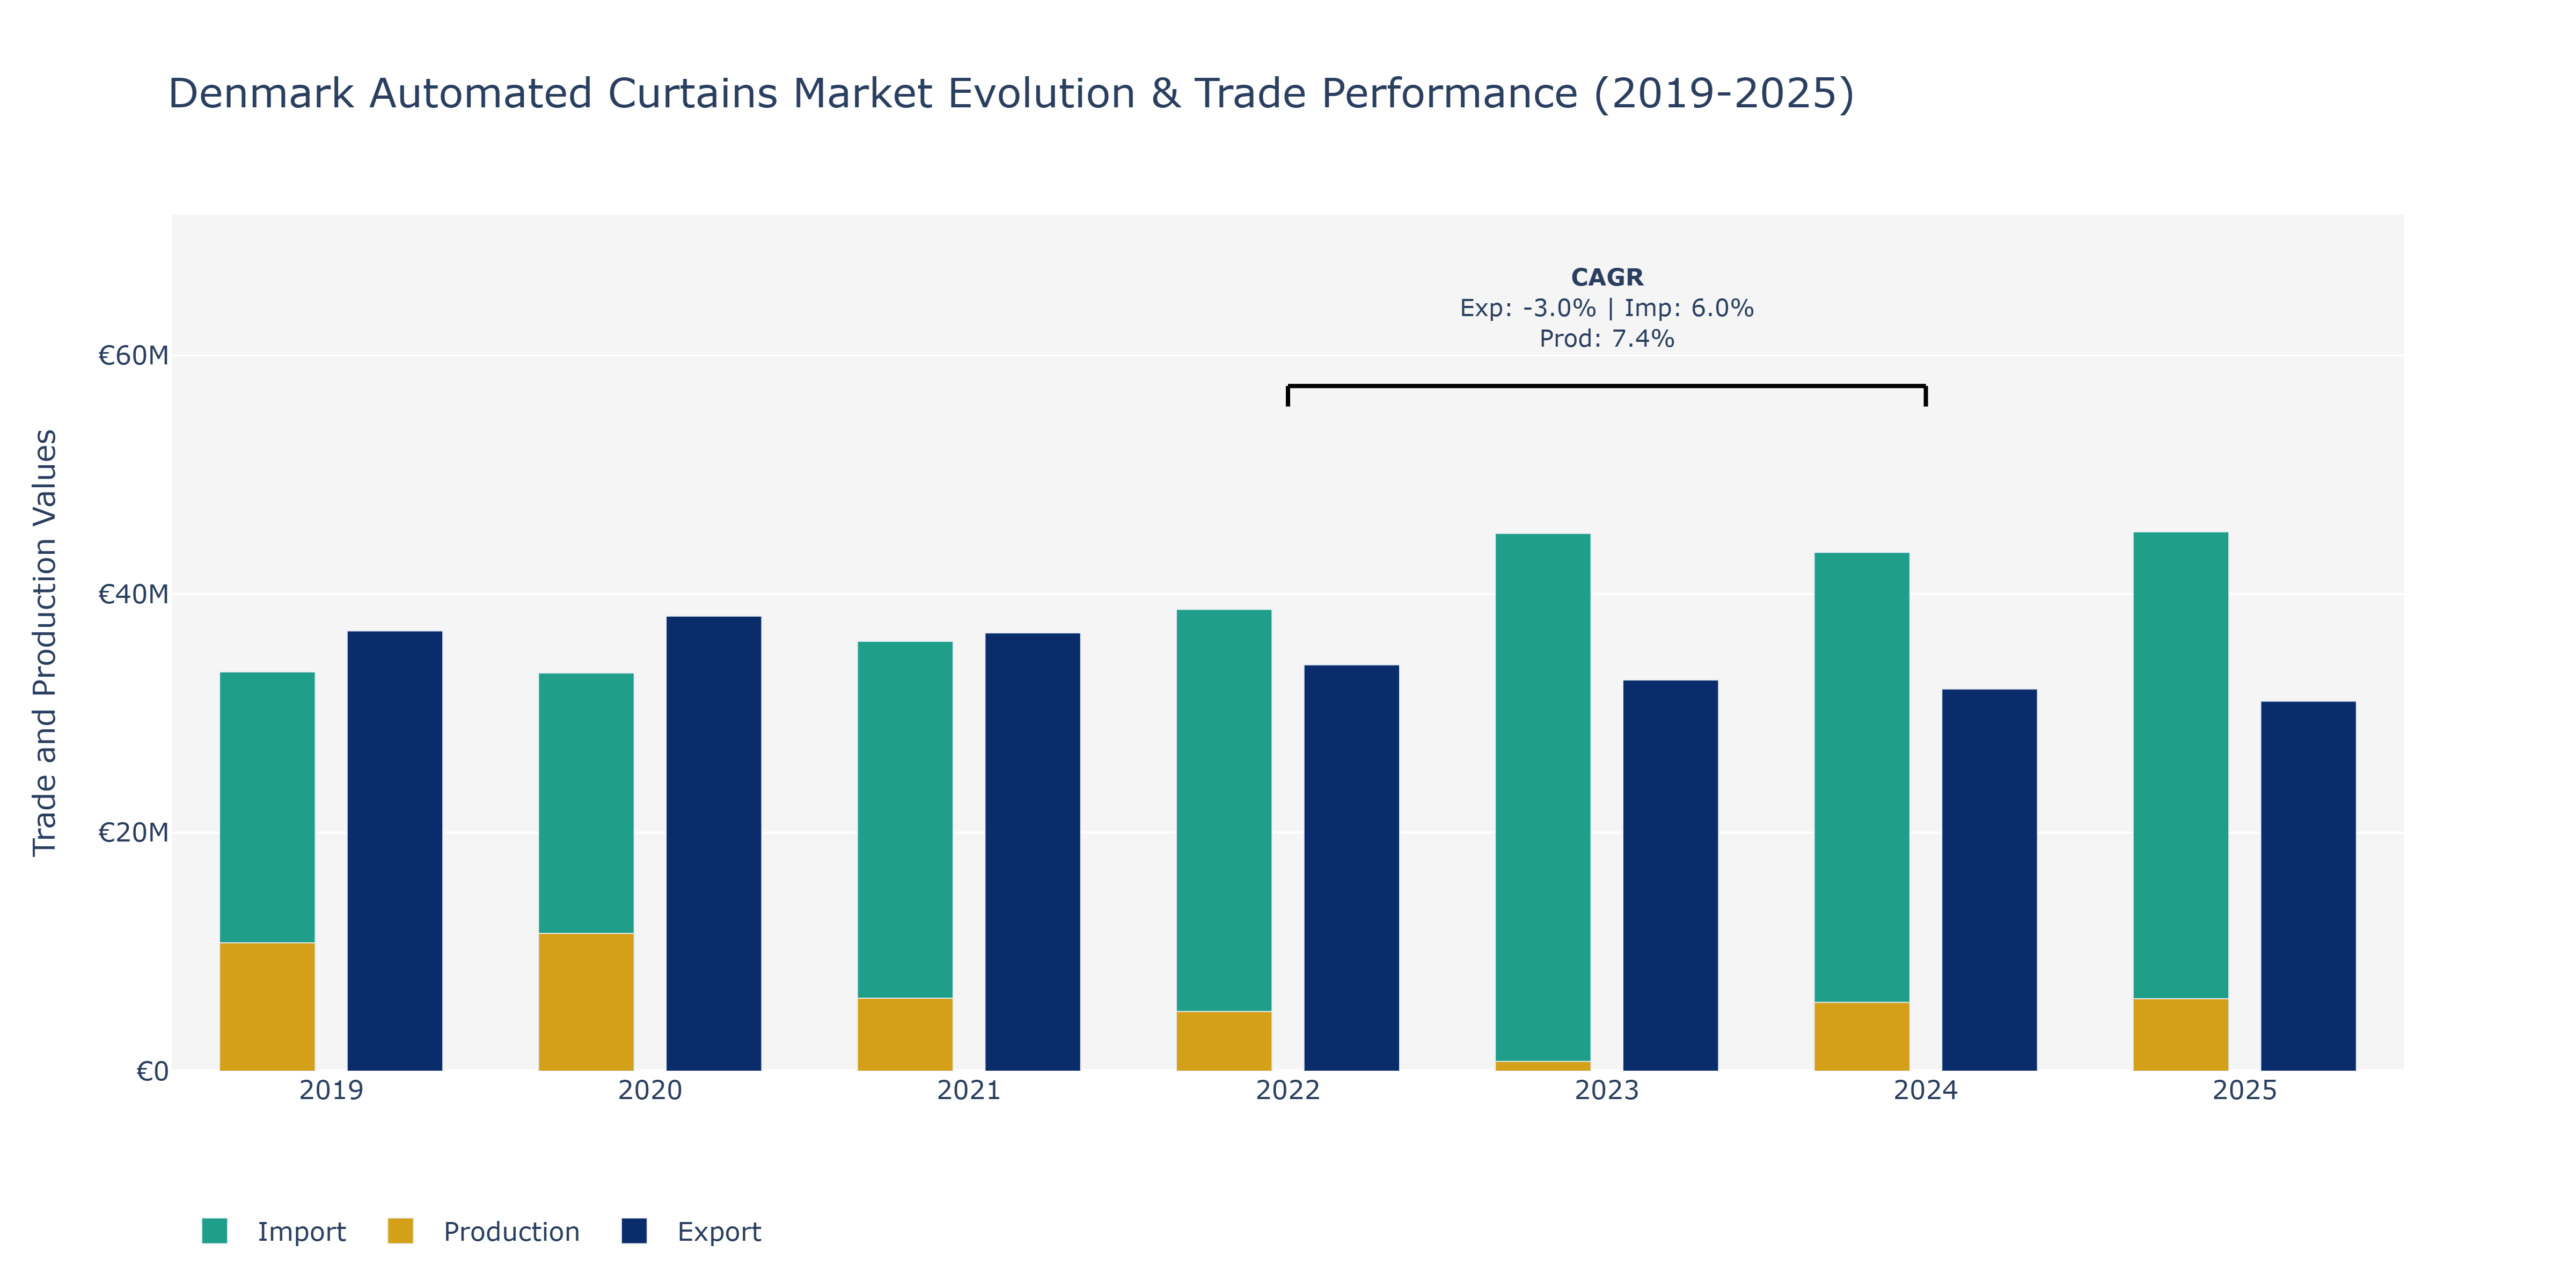
In the Denmark Automated Curtains Market, exports experienced a downward trend from €36.91 million in 2019 to €31.01 million in 2025. This decline can be attributed to global economic uncertainties affecting demand for automated curtains. Imports, however, showed a fluctuating pattern, peaking at €45.21 million in 2025 after starting at €33.47 million in 2019. This increase may be linked to the growing popularity of automated curtains in Denmark, leading to higher imports to meet consumer needs. Production value fluctuated over the years, reaching €11.54 million in 2020 before dropping to €6.07 million in 2025, showing a significant decrease. This decline could be due to increased competition from international manufacturers and changing consumer preferences towards other home automation products. To sustain market growth, local manufacturers may need to focus on product innovation and cost-effective production methods to remain competitive in the evolving market landscape.
Key Highlights of the Report:
- Denmark Automated Curtains Market Outlook
- Market Size of Denmark Automated Curtains Market, 2025
- Forecast of Denmark Automated Curtains Market, 2032
- Historical Data and Forecast of Denmark Automated Curtains Revenues & Volume for the Period 2022 - 2032
- Denmark Automated Curtains Market Trend Evolution
- Denmark Automated Curtains Market Drivers and Challenges
- Denmark Automated Curtains Price Trends
- Denmark Automated Curtains Porter's Five Forces
- Denmark Automated Curtains Industry Life Cycle
- Historical Data and Forecast of Denmark Automated Curtains Market Revenues & Volume By Product for the Period 2022 - 2032
- Historical Data and Forecast of Denmark Automated Curtains Market Revenues & Volume By Ripplefold for the Period 2022 - 2032
- Historical Data and Forecast of Denmark Automated Curtains Market Revenues & Volume By Pinch Pleat for the Period 2022 - 2032
- Historical Data and Forecast of Denmark Automated Curtains Market Revenues & Volume By Application for the Period 2022 - 2032
- Historical Data and Forecast of Denmark Automated Curtains Market Revenues & Volume By Residential for the Period 2022 - 2032
- Historical Data and Forecast of Denmark Automated Curtains Market Revenues & Volume By Commercial for the Period 2022 - 2032
- Denmark Automated Curtains Import Export Trade Statistics
- Market Opportunity Assessment By Product
- Market Opportunity Assessment By Application
- Denmark Automated Curtains Top Companies Market Share
- Denmark Automated Curtains Competitive Benchmarking By Technical and Operational Parameters
- Denmark Automated Curtains Company Profiles
- Denmark Automated Curtains Key Strategic Recommendations
Frequently Asked Questions About the Market Study (FAQs):
6Wresearch actively monitors the Denmark Automated Curtains Market and publishes its comprehensive annual report, highlighting emerging trends, growth drivers, revenue analysis, and forecast outlook. Our insights help businesses to make data-backed strategic decisions with ongoing market dynamics. Our analysts track relevent industries related to the Denmark Automated Curtains Market, allowing our clients with actionable intelligence and reliable forecasts tailored to emerging regional needs.
Yes, we provide customisation as per your requirements. To learn more, feel free to contact us on sales@6wresearch.com
1 Executive Summary |
2 Introduction |
2.1 Key Highlights of the Report |
2.2 Report Description |
2.3 Market Scope & Segmentation |
2.4 Research Methodology |
2.5 Assumptions |
3 Denmark Automated Curtains Market Overview |
3.1 Denmark Country Macro Economic Indicators |
3.2 Denmark Automated Curtains Market Revenues & Volume, 2022 & 2032F |
3.3 Denmark Automated Curtains Market - Industry Life Cycle |
3.4 Denmark Automated Curtains Market - Porter's Five Forces |
3.5 Denmark Automated Curtains Market Revenues & Volume Share, By Product, 2022 & 2032F |
3.6 Denmark Automated Curtains Market Revenues & Volume Share, By Application, 2022 & 2032F |
4 Denmark Automated Curtains Market Dynamics |
4.1 Impact Analysis |
4.2 Market Drivers |
4.2.1 Increasing adoption of smart home technologies in Denmark |
4.2.2 Growing awareness about energy efficiency and sustainability benefits of automated curtains |
4.2.3 Technological advancements in automation technologies for curtains |
4.3 Market Restraints |
4.3.1 High initial investment costs associated with automated curtain systems |
4.3.2 Limited availability of skilled professionals for installation and maintenance of automated curtains |
5 Denmark Automated Curtains Market Trends |
6 Denmark Automated Curtains Market, By Types |
6.1 Denmark Automated Curtains Market, By Product |
6.1.1 Overview and Analysis |
6.1.2 Denmark Automated Curtains Market Revenues & Volume, By Product, 2022 - 2032F |
6.1.3 Denmark Automated Curtains Market Revenues & Volume, By Ripplefold, 2022 - 2032F |
6.1.4 Denmark Automated Curtains Market Revenues & Volume, By Pinch Pleat, 2022 - 2032F |
6.2 Denmark Automated Curtains Market, By Application |
6.2.1 Overview and Analysis |
6.2.2 Denmark Automated Curtains Market Revenues & Volume, By Residential, 2022 - 2032F |
6.2.3 Denmark Automated Curtains Market Revenues & Volume, By Commercial, 2022 - 2032F |
7 Denmark Automated Curtains Market Import-Export Trade Statistics |
7.1 Denmark Automated Curtains Market Export to Major Countries |
7.2 Denmark Automated Curtains Market Imports from Major Countries |
8 Denmark Automated Curtains Market Key Performance Indicators |
8.1 Percentage increase in the number of smart homes in Denmark |
8.2 Growth in the number of residential and commercial buildings opting for automated curtain solutions |
8.3 Adoption rate of energy-efficient home solutions in the country |
9 Denmark Automated Curtains Market - Opportunity Assessment |
9.1 Denmark Automated Curtains Market Opportunity Assessment, By Product, 2022 & 2032F |
9.2 Denmark Automated Curtains Market Opportunity Assessment, By Application, 2022 & 2032F |
10 Denmark Automated Curtains Market - Competitive Landscape |
10.1 Denmark Automated Curtains Market Revenue Share, By Companies, 2025 |
10.2 Denmark Automated Curtains Market Competitive Benchmarking, By Operating and Technical Parameters |
11 Company Profiles |
12 Recommendations |
13 Disclaimer |
Global Go To Market Strategy - 2030
Export potential enables firms to identify high-growth global markets with greater confidence by combining advanced trade intelligence with a structured quantitative methodology. The framework analyzes emerging demand trends and country-level import patterns while integrating macroeconomic and trade datasets such as GDP and population forecasts, bilateral import–export flows, tariff structures, elasticity differentials between developed and developing economies, geographic distance, and import demand projections. Using weighted trade values from 2020–2024 as the base period to project country-to-country export potential for 2030, these inputs are operationalized through calculated drivers such as gravity model parameters, tariff impact factors, and projected GDP per-capita growth. Through an analysis of hidden potentials, demand hotspots, and market conditions that are most favorable to success, this method enables firms to focus on target countries, maximize returns, and global expansion with data, backed by accuracy.
By factoring in the projected importer demand gap that is currently unmet and could be potential opportunity, it identifies the potential for the Exporter (Country) among 190 countries, against the general trade analysis, which identifies the biggest importer or exporter.
To discover high-growth global markets and optimize your business strategy:
Click Here
Pricing
- Single User License$ 1,995
- Department License$ 2,400
- Site License$ 3,120
- Global License$ 3,795

Leadership Perspectives from Industry Events
Search
Thought Leadership and Analyst Meet


Our Clients
6WResearch In News
- Doha a strategic location for EV manufacturing hub: IPA Qatar
- Demand for luxury TVs surging in the GCC, says Samsung
- Empowering Growth: The Thriving Journey of Bangladesh’s Cable Industry
- Demand for luxury TVs surging in the GCC, says Samsung
- Video call with a traditional healer? Once unthinkable, it’s now common in South Africa
- Intelligent Buildings To Smooth GCC’s Path To Net Zero
Latest Reports
- New Zealand Aseptic Manufacturing Market (2026-2032)
- Netherlands Aseptic Manufacturing Market (2026-2032)
- Nauru Aseptic Manufacturing Market (2026-2032)
- Namibia Aseptic Manufacturing Market (2026-2032)
- Mozambique Aseptic Manufacturing Market (2026-2032)
- Montenegro Aseptic Manufacturing Market (2026-2032)
- Mongolia Aseptic Manufacturing Market (2026-2032)
- Monaco Aseptic Manufacturing Market (2026-2032)
- Micronesia Aseptic Manufacturing Market (2026-2032)
- Mauritius Aseptic Manufacturing Market (2026-2032)
Industry Events and Analyst Meet

HIMTEX 2026

India Refining Summit 2026

India EV Show 2026

EV tech India Expo 2026

Auto Tech Asia 2026
Whitepaper
- Middle East & Africa Commercial Security Market Click here to view more.
- Middle East & Africa Fire Safety Systems & Equipment Market Click here to view more.
- GCC Drone Market Click here to view more.
- Middle East Lighting Fixture Market Click here to view more.
- GCC Physical & Perimeter Security Market Click here to view more.