Denmark Canned Beans Market (2025-2031) | Size, Revenue, Analysis, Share, Value, Forecast, Industry, Companies, Growth, Outlook, Segmentation & Trends
Market Forecast By Type (Navy Beans, Kidney Beans, Garbanzo Beans, Pinto Beans, Others), By Category (Conventional, Organic) And Competitive Landscape
| Product Code: ETC5010800 | Publication Date: Nov 2023 | Updated Date: Dec 2025 | Product Type: Market Research Report | |
| Publisher: 6Wresearch | Author: Sachin Kumar Rai | No. of Pages: 60 | No. of Figures: 30 | No. of Tables: 5 |
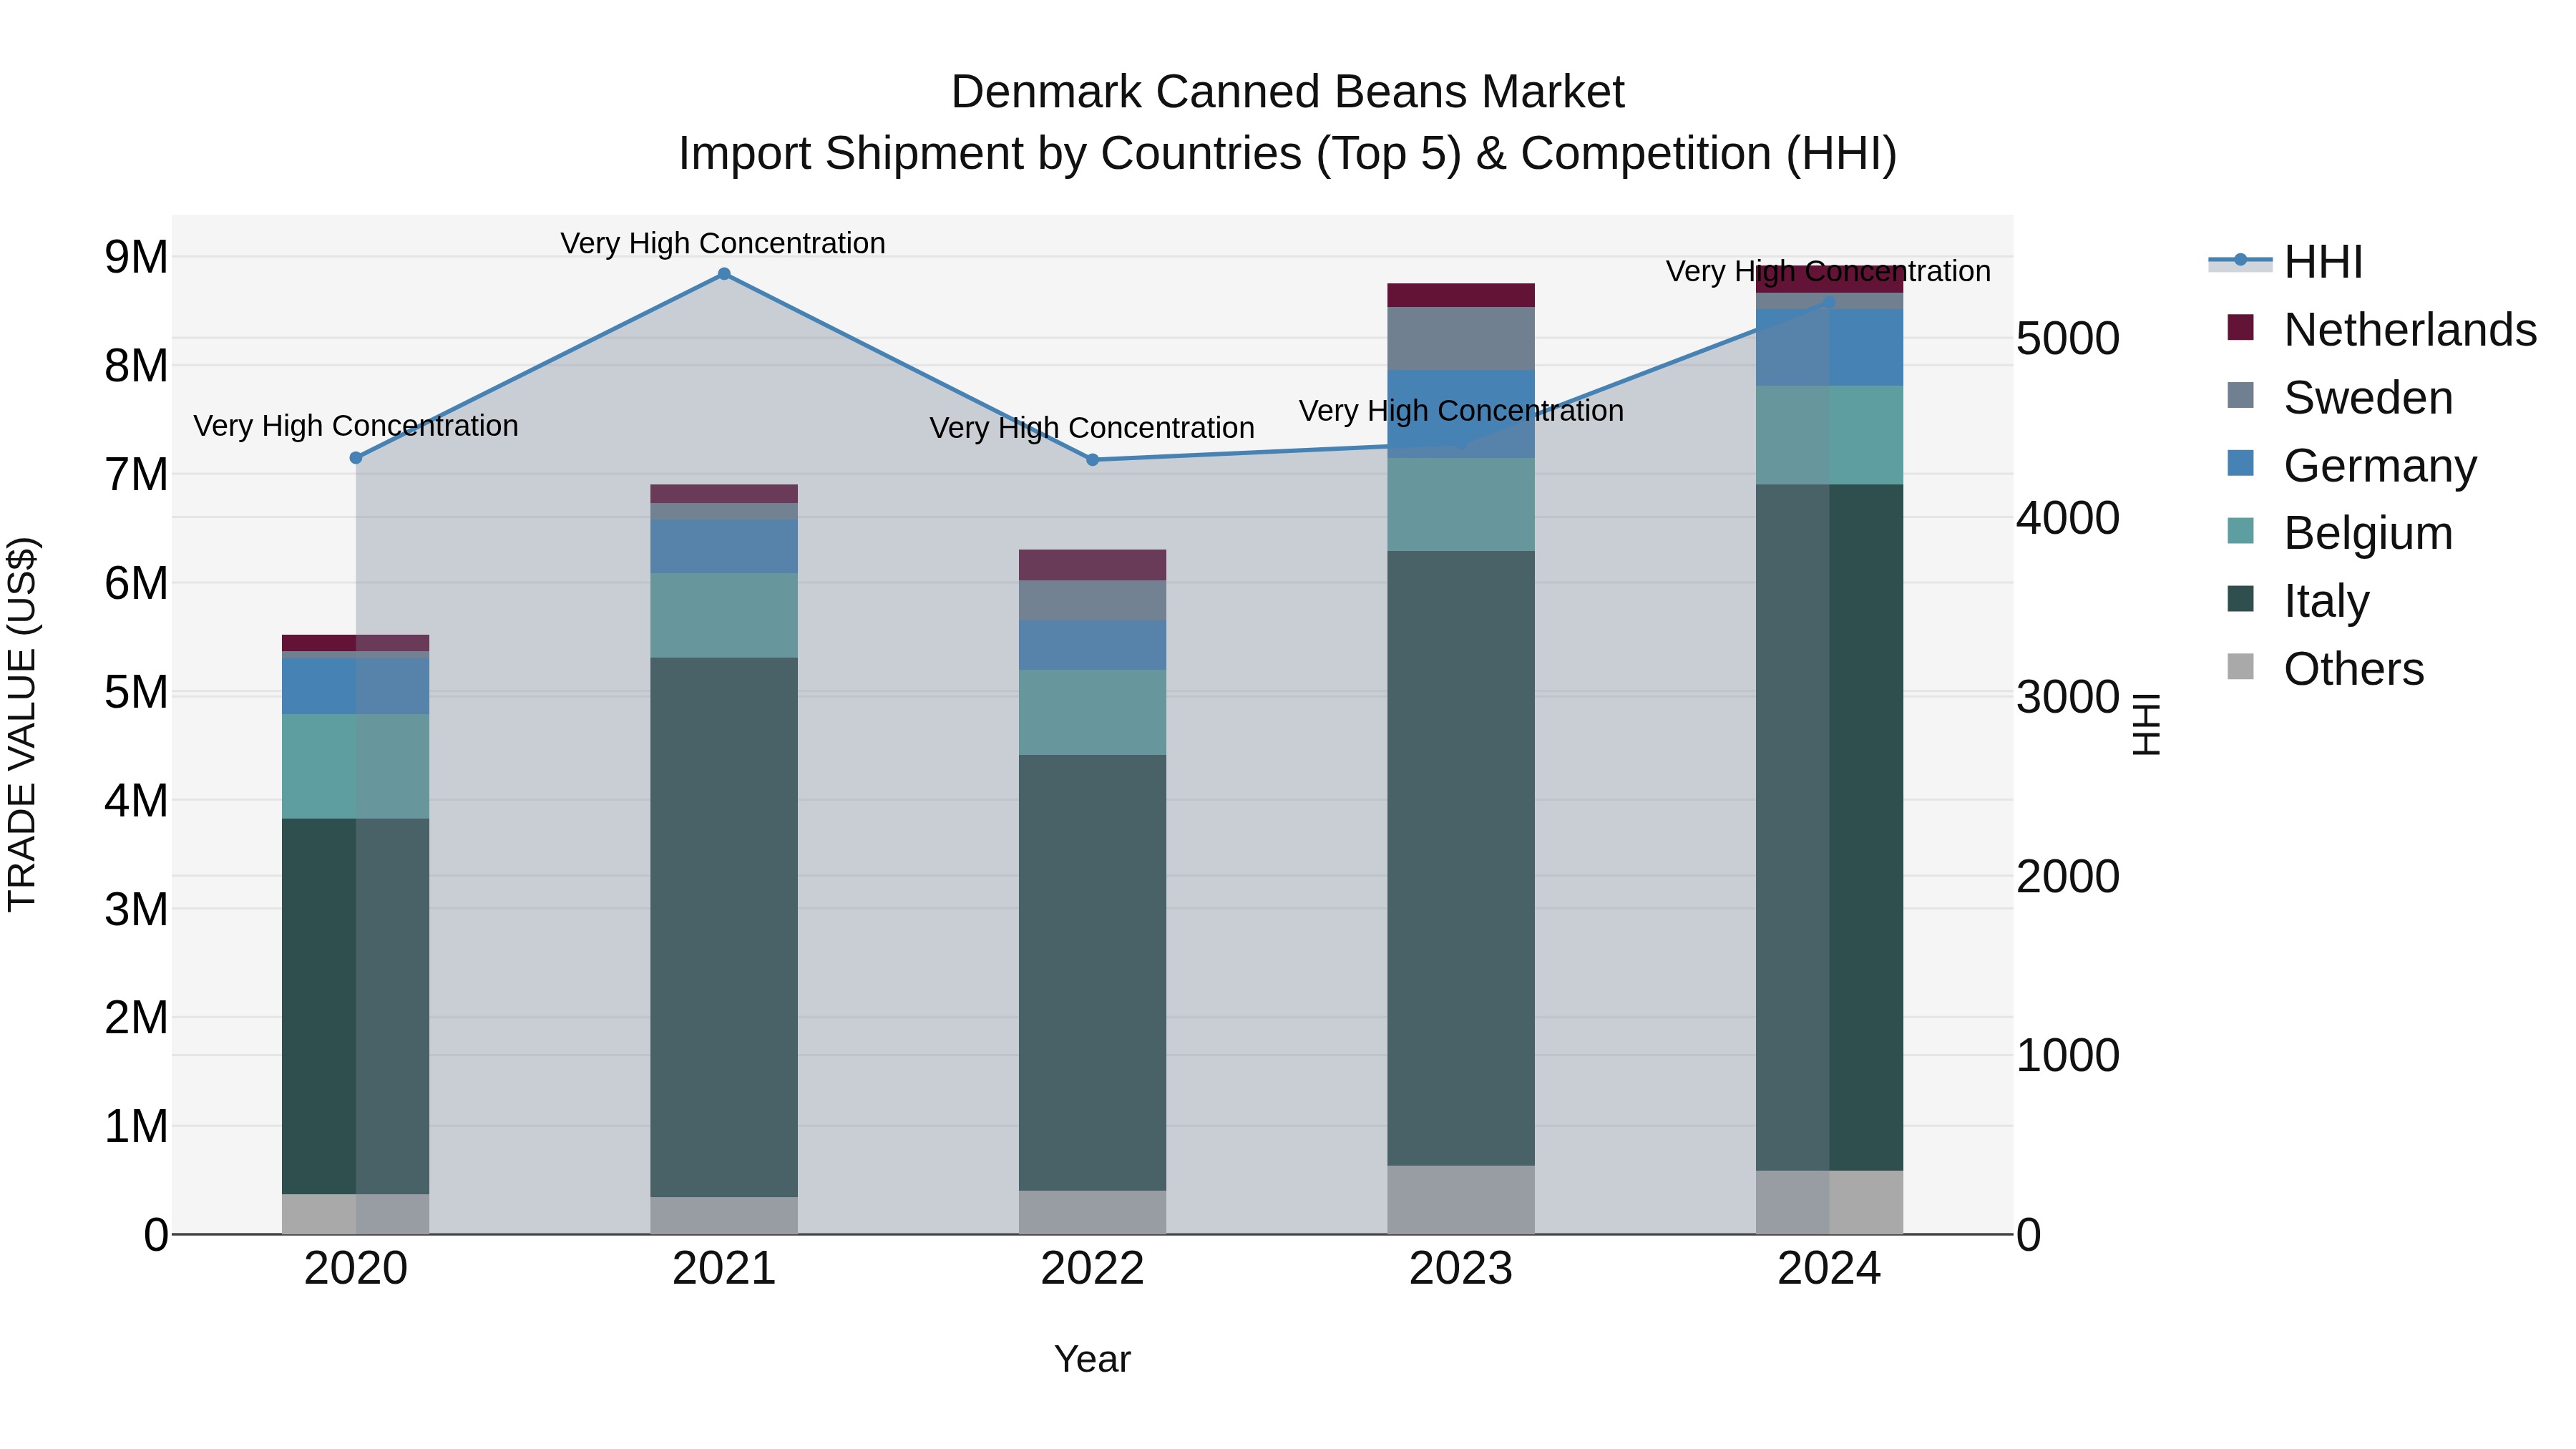
Denmark Canned Beans Market Top 5 Importing Countries and Market Competition (HHI) Analysis
In 2024, Denmark saw a significant increase in canned beans import shipments, with top exporting countries being Italy, Belgium, Germany, Netherlands, and Sweden. The market remained highly concentrated with a high Herfindahl-Hirschman Index (HHI). The compound annual growth rate (CAGR) from 2020 to 2024 was an impressive 12.74%, indicating a thriving market. Despite a slightly lower growth rate of 1.83% in 2024 compared to the previous year, the steady influx of canned beans from key exporting nations highlights the popularity and demand for this product in Denmark.
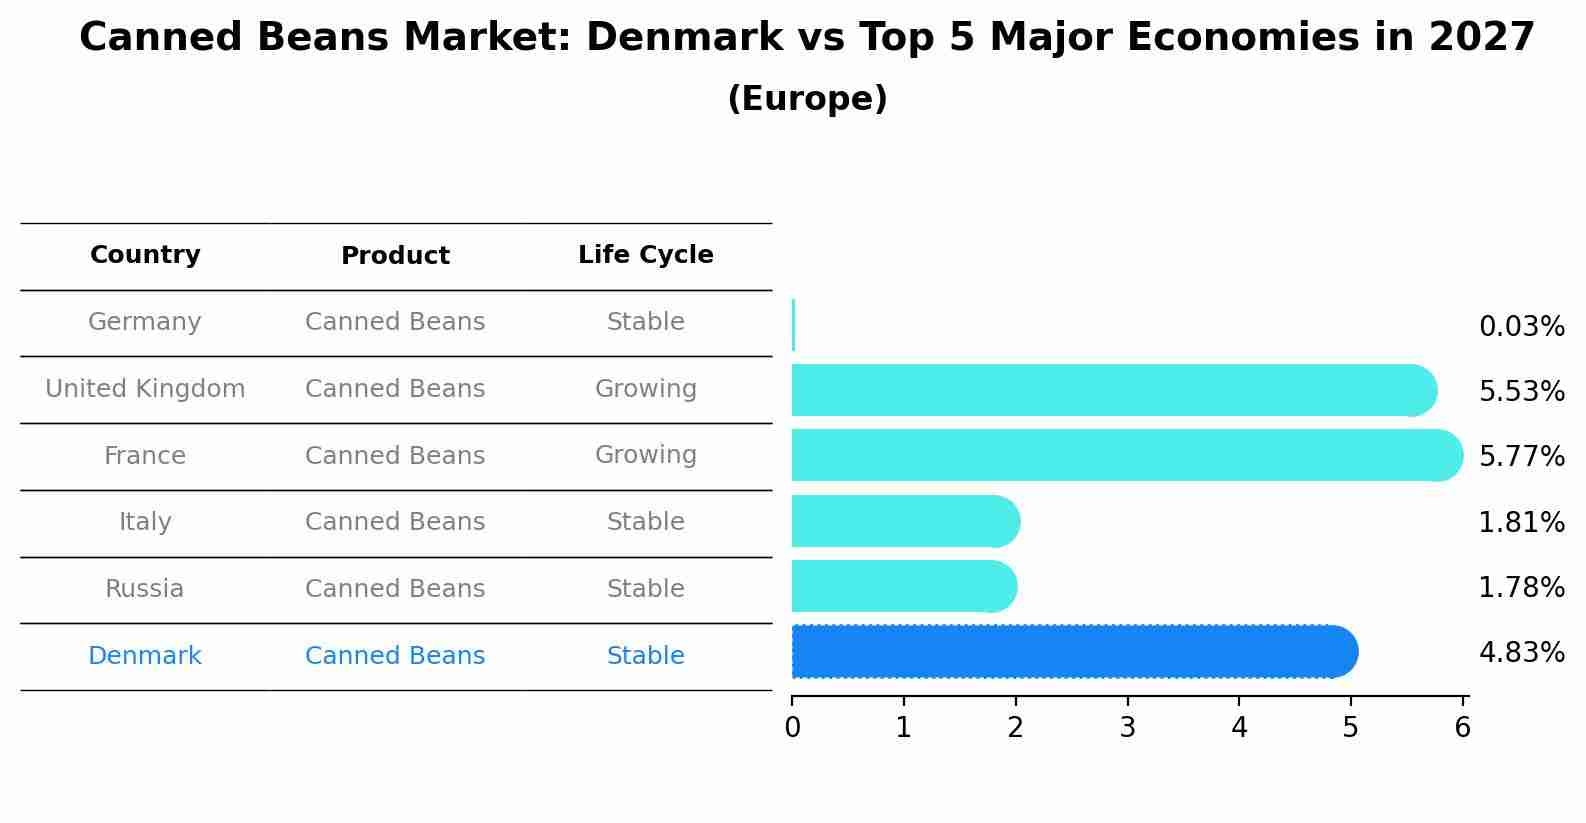
Canned Beans Market: Denmark vs Top 5 Major Economies in 2027 (Europe)
The Canned Beans market in Denmark is projected to grow at a stable growth rate of 4.83% by 2027, within the Europe region led by Germany, along with other countries like United Kingdom, France, Italy and Russia, collectively shaping a dynamic and evolving market environment driven by innovation and increasing adoption of emerging technologies.
Denmark Canned Beans Market Overview
The canned beans market in Denmark is growing steadily as consumers seek convenient, healthy, and ready-to-eat food options. Canned beans are popular in both households and food service industries, especially with the rise of plant-based diets.
Drivers of the market
The canned beans market in Denmark is experiencing growth due to the rising consumer preference for convenient, ready-to-eat foods. Canned beans are viewed as a healthy and versatile ingredient that fits into a wide range of diets, including vegan and vegetarian options. The trend toward plant-based eating and the increasing popularity of high-protein, fiber-rich foods are key drivers of this market. Additionally, the longer shelf life and affordability of canned beans compared to fresh alternatives are contributing to their widespread adoption in households and the foodservice sector.
Challenges of the market
The canned beans market is affected by rising competition from fresh and frozen alternatives as consumers seek healthier and more natural options. Additionally, the market must navigate fluctuating raw material prices and stringent food safety regulations.
Government Policy of the market
Denmarks agricultural policies promoting sustainable farming and food security affect the canned beans market. Government support for local agricultural production and compliance with EU food safety standards ensures that canned beans meet high-quality benchmarks. Policies encouraging healthy eating and sustainability also drive demand for plant-based protein sources like canned beans, although manufacturers must comply with strict food safety and labeling regulations.
Key Highlights of the Report:
- Denmark Canned Beans Market Outlook
- Market Size of Denmark Canned Beans Market, 2024
- Forecast of Denmark Canned Beans Market, 2031
- Historical Data and Forecast of Denmark Canned Beans Revenues & Volume for the Period 2021-2031
- Denmark Canned Beans Market Trend Evolution
- Denmark Canned Beans Market Drivers and Challenges
- Denmark Canned Beans Price Trends
- Denmark Canned Beans Porter`s Five Forces
- Denmark Canned Beans Industry Life Cycle
- Historical Data and Forecast of Denmark Canned Beans Market Revenues & Volume By Type for the Period 2021-2031
- Historical Data and Forecast of Denmark Canned Beans Market Revenues & Volume By Navy Beans for the Period 2021-2031
- Historical Data and Forecast of Denmark Canned Beans Market Revenues & Volume By Kidney Beans for the Period 2021-2031
- Historical Data and Forecast of Denmark Canned Beans Market Revenues & Volume By Garbanzo Beans for the Period 2021-2031
- Historical Data and Forecast of Denmark Canned Beans Market Revenues & Volume By Pinto Beans for the Period 2021-2031
- Historical Data and Forecast of Denmark Canned Beans Market Revenues & Volume By Others for the Period 2021-2031
- Historical Data and Forecast of Denmark Canned Beans Market Revenues & Volume By Category for the Period 2021-2031
- Historical Data and Forecast of Denmark Canned Beans Market Revenues & Volume By Conventional for the Period 2021-2031
- Historical Data and Forecast of Denmark Canned Beans Market Revenues & Volume By Organic for the Period 2021-2031
- Denmark Canned Beans Import Export Trade Statistics
- Market Opportunity Assessment By Type
- Market Opportunity Assessment By Category
- Denmark Canned Beans Top Companies Market Share
- Denmark Canned Beans Competitive Benchmarking By Technical and Operational Parameters
- Denmark Canned Beans Company Profiles
- Denmark Canned Beans Key Strategic Recommendations
Frequently Asked Questions About the Market Study (FAQs):
6Wresearch actively monitors the Denmark Canned Beans Market and publishes its comprehensive annual report, highlighting emerging trends, growth drivers, revenue analysis, and forecast outlook. Our insights help businesses to make data-backed strategic decisions with ongoing market dynamics. Our analysts track relevent industries related to the Denmark Canned Beans Market, allowing our clients with actionable intelligence and reliable forecasts tailored to emerging regional needs.
Yes, we provide customisation as per your requirements. To learn more, feel free to contact us on sales@6wresearch.com
1 Executive Summary |
2 Introduction |
2.1 Key Highlights of the Report |
2.2 Report Description |
2.3 Market Scope & Segmentation |
2.4 Research Methodology |
2.5 Assumptions |
3 Denmark Canned Beans Market Overview |
3.1 Denmark Country Macro Economic Indicators |
3.2 Denmark Canned Beans Market Revenues & Volume, 2021 & 2031F |
3.3 Denmark Canned Beans Market - Industry Life Cycle |
3.4 Denmark Canned Beans Market - Porter's Five Forces |
3.5 Denmark Canned Beans Market Revenues & Volume Share, By Type, 2021 & 2031F |
3.6 Denmark Canned Beans Market Revenues & Volume Share, By Category, 2021 & 2031F |
4 Denmark Canned Beans Market Dynamics |
4.1 Impact Analysis |
4.2 Market Drivers |
4.2.1 Increasing consumer awareness towards health benefits of consuming beans. |
4.2.2 Growing preference for convenient and ready-to-eat food options. |
4.2.3 Shift towards plant-based diets and vegetarian/vegan lifestyles. |
4.3 Market Restraints |
4.3.1 Competition from fresh/frozen alternatives impacting market growth. |
4.3.2 Fluctuating raw material prices affecting production costs. |
4.3.3 Environmental concerns related to canned food packaging and sustainability. |
5 Denmark Canned Beans Market Trends |
6 Denmark Canned Beans Market Segmentations |
6.1 Denmark Canned Beans Market, By Type |
6.1.1 Overview and Analysis |
6.1.2 Denmark Canned Beans Market Revenues & Volume, By Navy Beans, 2021-2031F |
6.1.3 Denmark Canned Beans Market Revenues & Volume, By Kidney Beans, 2021-2031F |
6.1.4 Denmark Canned Beans Market Revenues & Volume, By Garbanzo Beans, 2021-2031F |
6.1.5 Denmark Canned Beans Market Revenues & Volume, By Pinto Beans, 2021-2031F |
6.1.6 Denmark Canned Beans Market Revenues & Volume, By Others, 2021-2031F |
6.2 Denmark Canned Beans Market, By Category |
6.2.1 Overview and Analysis |
6.2.2 Denmark Canned Beans Market Revenues & Volume, By Conventional, 2021-2031F |
6.2.3 Denmark Canned Beans Market Revenues & Volume, By Organic, 2021-2031F |
7 Denmark Canned Beans Market Import-Export Trade Statistics |
7.1 Denmark Canned Beans Market Export to Major Countries |
7.2 Denmark Canned Beans Market Imports from Major Countries |
8 Denmark Canned Beans Market Key Performance Indicators |
8.1 Consumer engagement with bean-related content on social media platforms. |
8.2 Number of new product launches in the canned beans segment. |
8.3 Percentage increase in demand for organic or sustainably sourced canned beans. |
8.4 Adoption rate of canned beans in new consumer segments (e.g., younger demographics, urban populations). |
9 Denmark Canned Beans Market - Opportunity Assessment |
9.1 Denmark Canned Beans Market Opportunity Assessment, By Type, 2021 & 2031F |
9.2 Denmark Canned Beans Market Opportunity Assessment, By Category, 2021 & 2031F |
10 Denmark Canned Beans Market - Competitive Landscape |
10.1 Denmark Canned Beans Market Revenue Share, By Companies, 2024 |
10.2 Denmark Canned Beans Market Competitive Benchmarking, By Operating and Technical Parameters |
11 Company Profiles |
12 Recommendations | 13 Disclaimer |
Export potential assessment - trade Analytics for 2030
Export potential enables firms to identify high-growth global markets with greater confidence by combining advanced trade intelligence with a structured quantitative methodology. The framework analyzes emerging demand trends and country-level import patterns while integrating macroeconomic and trade datasets such as GDP and population forecasts, bilateral import–export flows, tariff structures, elasticity differentials between developed and developing economies, geographic distance, and import demand projections. Using weighted trade values from 2020–2024 as the base period to project country-to-country export potential for 2030, these inputs are operationalized through calculated drivers such as gravity model parameters, tariff impact factors, and projected GDP per-capita growth. Through an analysis of hidden potentials, demand hotspots, and market conditions that are most favorable to success, this method enables firms to focus on target countries, maximize returns, and global expansion with data, backed by accuracy.
By factoring in the projected importer demand gap that is currently unmet and could be potential opportunity, it identifies the potential for the Exporter (Country) among 190 countries, against the general trade analysis, which identifies the biggest importer or exporter.
To discover high-growth global markets and optimize your business strategy:
Click Here
Pricing
- Single User License$ 1,995
- Department License$ 2,400
- Site License$ 3,120
- Global License$ 3,795

Search
Thought Leadership and Analyst Meet


Our Clients
Latest Reports
- Philippines Polyhydroxybutyrate-co-Hydroxyvalerate Market (2026-2032) | Trends, Insights, Challenges, Restraints, Competition, Size, Value, Forecast, Pricing, Share, Outlook, Revenue, Investment Opportunities, Strategy, Drivers, Demand, Growth, segmentation, Analysis, Companies
- Peru Polyhydroxybutyrate-co-Hydroxyvalerate Market (2026-2032) | Growth, Demand, Challenges, Share, Trends, Analysis, Pricing, Investment Opportunities, Drivers, Value, Forecast, Competition, Size, Companies, Insights, Outlook, Restraints, segmentation, Revenue, Strategy
- Pakistan Polyhydroxybutyrate-co-Hydroxyvalerate Market (2026-2032) | Restraints, segmentation, Pricing, Forecast, Share, Strategy, Competition, Trends, Insights, Drivers, Challenges, Growth, Revenue, Outlook, Value, Investment Opportunities, Companies, Size, Analysis, Demand
- Oman Polyhydroxybutyrate-co-Hydroxyvalerate Market (2026-2032) | Drivers, segmentation, Insights, Competition, Pricing, Outlook, Size, Revenue, Challenges, Forecast, Analysis, Growth, Value, Share, Trends, Investment Opportunities, Strategy, Restraints, Companies, Demand
- Nigeria Polyhydroxybutyrate-co-Hydroxyvalerate Market (2026-2032) | Value, Investment Opportunities, Analysis, Revenue, Restraints, Pricing, Outlook, Competition, Demand, Growth, Forecast, Companies, Trends, Challenges, segmentation, Drivers, Insights, Share, Size, Strategy
- Nepal Polyhydroxybutyrate-co-Hydroxyvalerate Market (2026-2032) | Insights, Analysis, Drivers, Share, Revenue, Demand, segmentation, Investment Opportunities, Competition, Forecast, Growth, Pricing, Companies, Strategy, Trends, Restraints, Challenges, Outlook, Size, Value
- Myanmar Polyhydroxybutyrate-co-Hydroxyvalerate Market (2026-2032) | Outlook, Revenue, Strategy, Restraints, Drivers, segmentation, Share, Forecast, Competition, Insights, Growth, Pricing, Size, Demand, Value, Companies, Trends, Challenges, Investment Opportunities, Analysis
- Morocco Polyhydroxybutyrate-co-Hydroxyvalerate Market (2026-2032) | Outlook, Investment Opportunities, Restraints, Strategy, Forecast, Challenges, Drivers, Growth, Companies, segmentation, Trends, Size, Competition, Revenue, Demand, Insights, Share, Analysis, Value, Pricing
- Mexico Polyhydroxybutyrate-co-Hydroxyvalerate Market (2026-2032) | Size, Drivers, Outlook, Share, Strategy, Growth, Pricing, Challenges, Companies, Demand, Value, Investment Opportunities, Restraints, Trends, Forecast, segmentation, Analysis, Insights, Competition, Revenue
- Malaysia Polyhydroxybutyrate-co-Hydroxyvalerate Market (2026-2032) | Share, segmentation, Size, Companies, Analysis, Insights, Forecast, Value, Revenue, Drivers, Restraints, Challenges, Investment Opportunities, Trends, Competition, Strategy, Demand, Growth, Outlook, Pricing
Industry Events and Analyst Meet

HIMTEX 2026

India Refining Summit 2026

India EV Show 2026

EV tech India Expo 2026

Auto Tech Asia 2026
Whitepaper
- Middle East & Africa Commercial Security Market Click here to view more.
- Middle East & Africa Fire Safety Systems & Equipment Market Click here to view more.
- GCC Drone Market Click here to view more.
- Middle East Lighting Fixture Market Click here to view more.
- GCC Physical & Perimeter Security Market Click here to view more.
6WResearch In News
- Doha a strategic location for EV manufacturing hub: IPA Qatar
- Demand for luxury TVs surging in the GCC, says Samsung
- Empowering Growth: The Thriving Journey of Bangladesh’s Cable Industry
- Demand for luxury TVs surging in the GCC, says Samsung
- Video call with a traditional healer? Once unthinkable, it’s now common in South Africa
- Intelligent Buildings To Smooth GCC’s Path To Net Zero