Denmark Cotter Pins Market (2026-2032) | Industry, Revenue, Share, Trends, Forecast, Companies, Analysis, Value, Segmentation, Outlook, Growth & Size
Market Forecast By Product Type (Tapered, Others), By Application (Link, Location) And Competitive Landscape
| Product Code: ETC5391047 | Publication Date: Nov 2023 | Updated Date: Apr 2026 | Product Type: Market Research Report | |
| Publisher: 6Wresearch | Author: Ravi Bhandari | No. of Pages: 60 | No. of Figures: 30 | No. of Tables: 5 |
Denmark Cotter Pins Market Size (2020-2030)
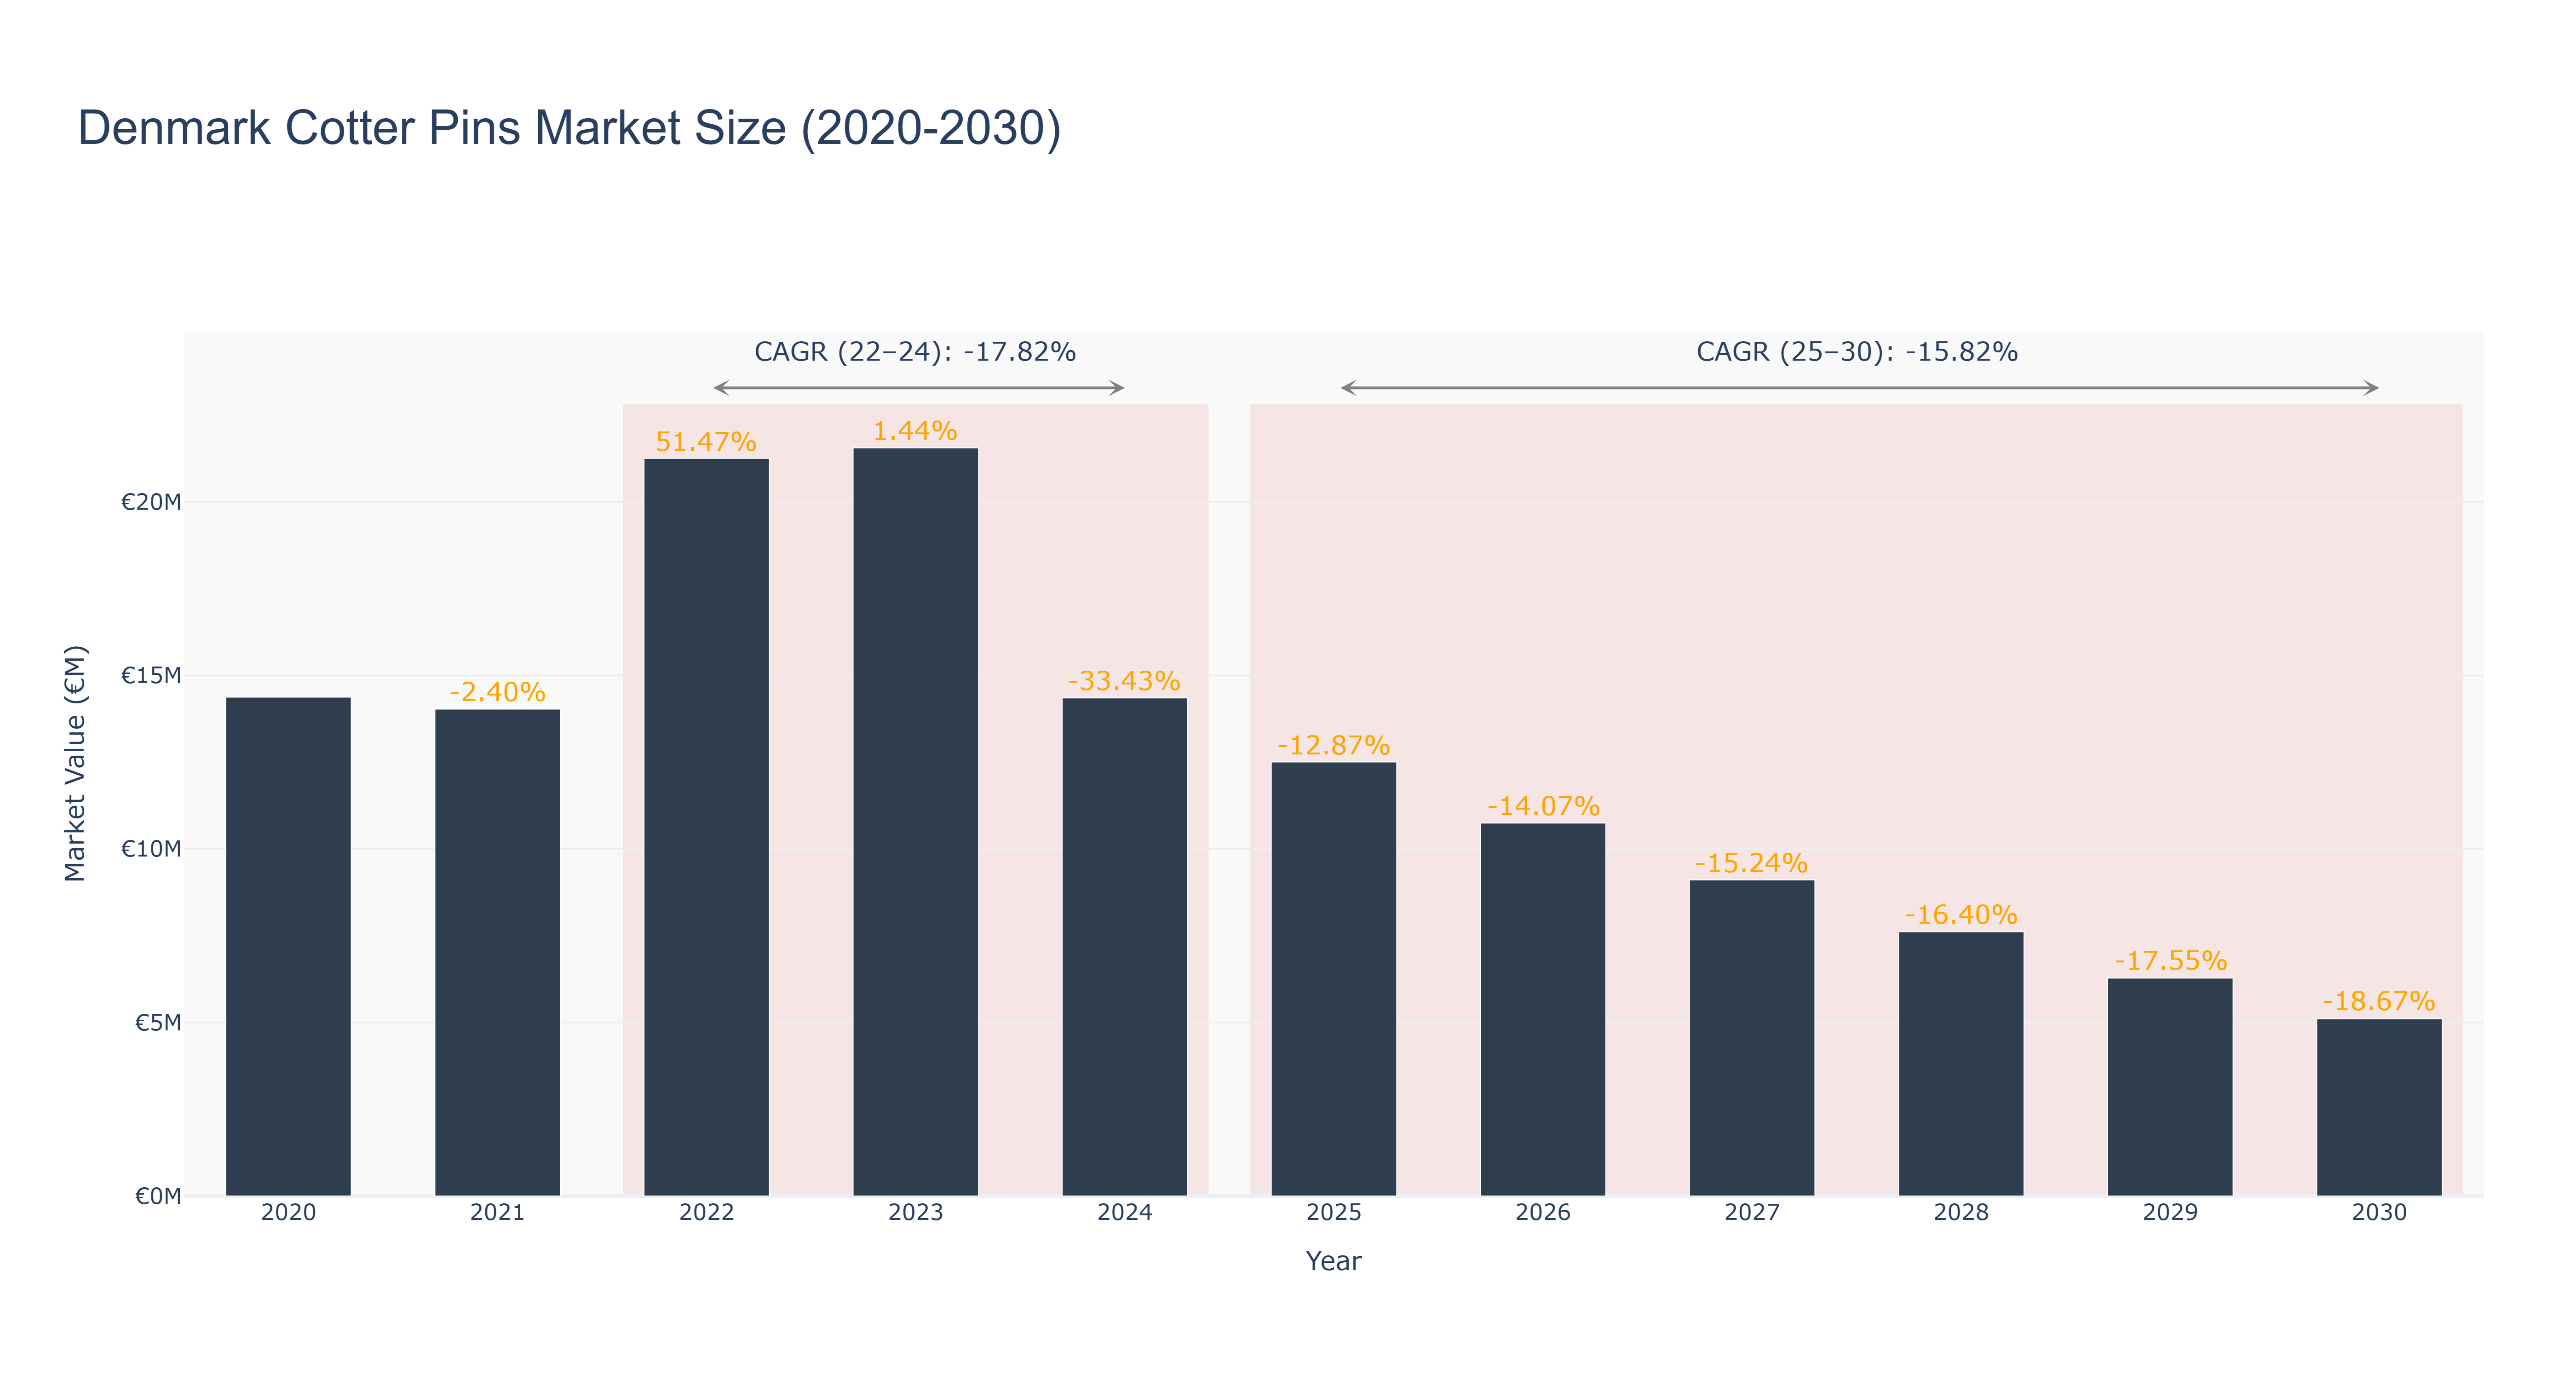
Denmark Cotter Pins Market has experienced fluctuations in market size over the years. The peak market size was recorded in 2022 at €21.26 million, followed by a significant decline to €12.51 million in 2025. The market is forecasted to continue shrinking, with a projected size of €5.11 million in 2030. The CAGR for the period 2022-24 was -17.82%, while for 2025-30, it stands at -15.82%. The market downturn can be attributed to factors such as economic uncertainty and changing consumer preferences. However, efforts to enhance product quality and expand market reach are underway, aiming to revitalize the industry. In the near future, Denmark is set to implement sustainability initiatives in the manufacturing sector, which could potentially drive growth in the Cotter Pins Market.
Denmark Cotter Pins Market: Production & Trade Performance (2019-2025)
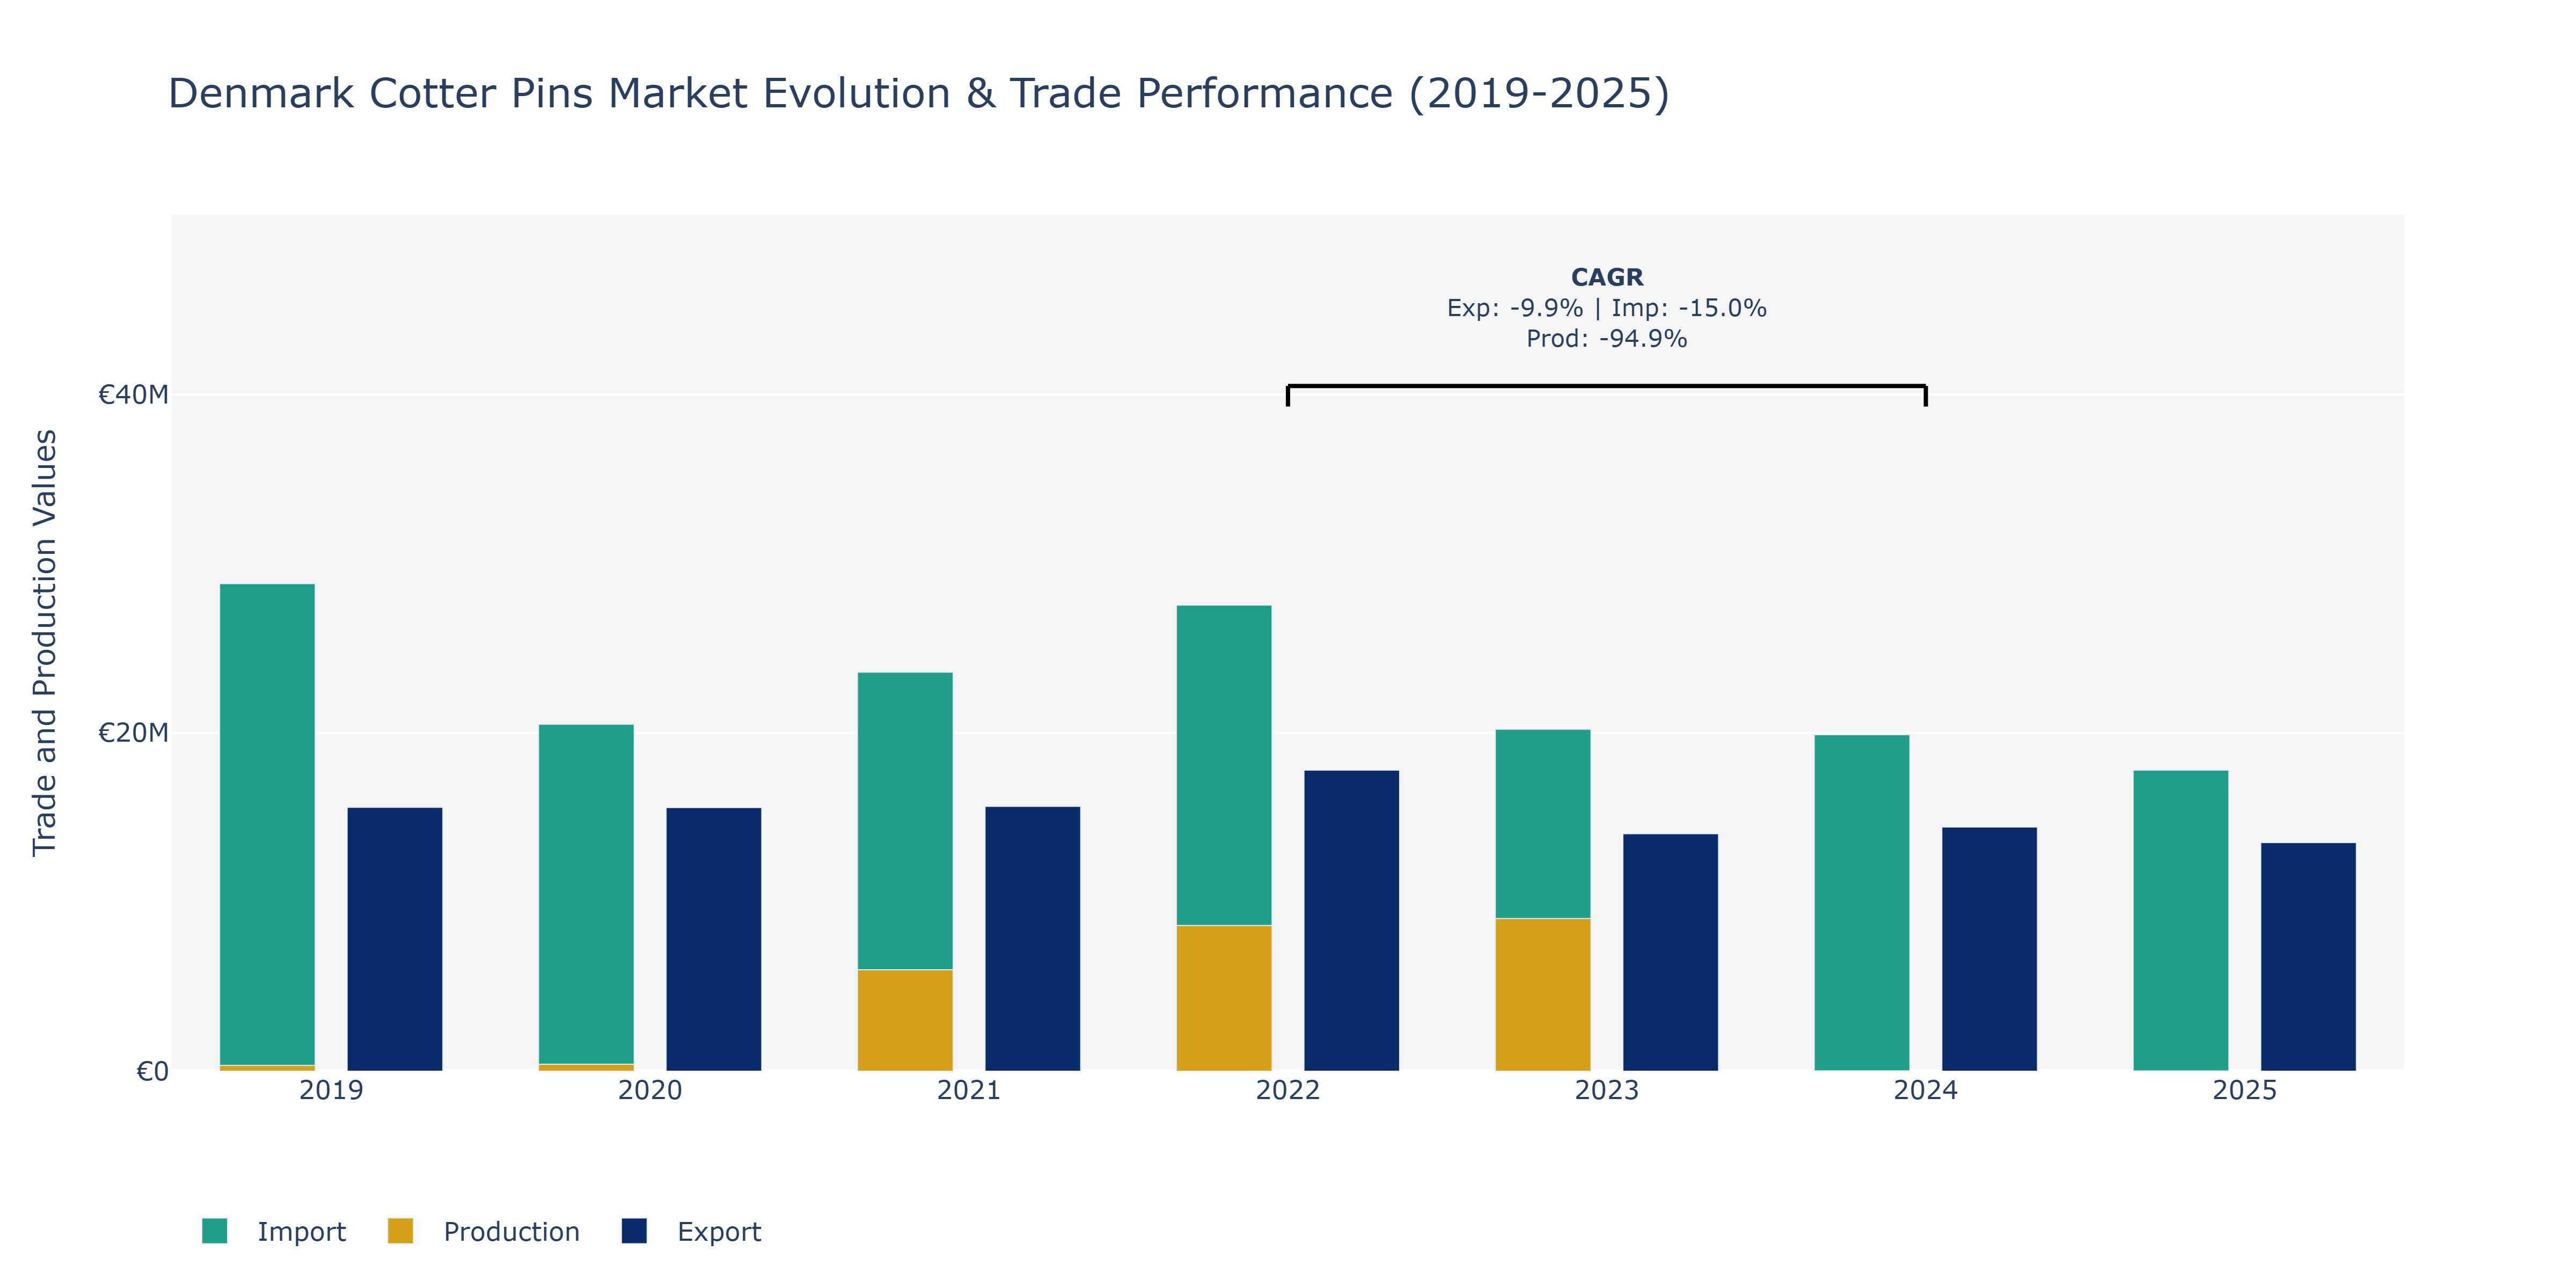
In the Denmark Cotter Pins Market, from 2019 to 2025, there were fluctuations in Exports, Imports, and Production. Exports remained relatively stable around €15.6 million in 2019, 2020, and 2021, before experiencing a slight increase in 2022 to €17.79 million, followed by a decline in subsequent years. Imports saw a decrease from €28.82 million in 2019 to around €17.79 million in 2025. Production peaked in 2021 at €5.99 billion before dropping significantly to €17.03 million in 2025. The decline in production can be attributed to various factors such as changes in consumer demand, advancements in technology impacting production processes, and global economic conditions affecting the overall market. To maintain competitiveness, stakeholders in the Denmark Cotter Pins Market may consider diversifying product offerings, adopting sustainable manufacturing practices, and leveraging digital technologies for operational efficiency.
Key Highlights of the Report:
- Denmark Cotter Pins Market Outlook
- Market Size of Denmark Cotter Pins Market, 2025
- Forecast of Denmark Cotter Pins Market, 2032
- Historical Data and Forecast of Denmark Cotter Pins Revenues & Volume for the Period 2022 - 2032F
- Denmark Cotter Pins Market Trend Evolution
- Denmark Cotter Pins Market Drivers and Challenges
- Denmark Cotter Pins Price Trends
- Denmark Cotter Pins Porter`s Five Forces
- Denmark Cotter Pins Industry Life Cycle
- Historical Data and Forecast of Denmark Cotter Pins Market Revenues & Volume By Product Type for the Period 2022 - 2032F
- Historical Data and Forecast of Denmark Cotter Pins Market Revenues & Volume By Tapered for the Period 2022 - 2032F
- Historical Data and Forecast of Denmark Cotter Pins Market Revenues & Volume By Others for the Period 2022 - 2032F
- Historical Data and Forecast of Denmark Cotter Pins Market Revenues & Volume By Application for the Period 2022 - 2032F
- Historical Data and Forecast of Denmark Cotter Pins Market Revenues & Volume By Link for the Period 2022 - 2032F
- Historical Data and Forecast of Denmark Cotter Pins Market Revenues & Volume By Location for the Period 2022 - 2032F
- Denmark Cotter Pins Import Export Trade Statistics
- Market Opportunity Assessment By Product Type
- Market Opportunity Assessment By Application
- Denmark Cotter Pins Top Companies Market Share
- Denmark Cotter Pins Competitive Benchmarking By Technical and Operational Parameters
- Denmark Cotter Pins Company Profiles
- Denmark Cotter Pins Key Strategic Recommendations
Frequently Asked Questions About the Market Study (FAQs):
6Wresearch actively monitors the Denmark Cotter Pins Market and publishes its comprehensive annual report, highlighting emerging trends, growth drivers, revenue analysis, and forecast outlook. Our insights help businesses to make data-backed strategic decisions with ongoing market dynamics. Our analysts track relevent industries related to the Denmark Cotter Pins Market, allowing our clients with actionable intelligence and reliable forecasts tailored to emerging regional needs.
Yes, we provide customisation as per your requirements. To learn more, feel free to contact us on sales@6wresearch.com
1 Executive Summary |
2 Introduction |
2.1 Key Highlights of the Report |
2.2 Report Description |
2.3 Market Scope & Segmentation |
2.4 Research Methodology |
2.5 Assumptions |
3 Denmark Cotter Pins Market Overview |
3.1 Denmark Country Macro Economic Indicators |
3.2 Denmark Cotter Pins Market Revenues & Volume, 2022 & 2032F |
3.3 Denmark Cotter Pins Market - Industry Life Cycle |
3.4 Denmark Cotter Pins Market - Porter's Five Forces |
3.5 Denmark Cotter Pins Market Revenues & Volume Share, By Product Type, 2022 & 2032F |
3.6 Denmark Cotter Pins Market Revenues & Volume Share, By Application, 2022 & 2032F |
4 Denmark Cotter Pins Market Dynamics |
4.1 Impact Analysis |
4.2 Market Drivers |
4.2.1 Increasing demand for cotter pins in the automotive industry for various applications such as engine components, steering systems, and suspension systems. |
4.2.2 Growing construction industry in Denmark leading to higher demand for cotter pins for structural applications. |
4.2.3 Rising awareness about the benefits of cotter pins in securing fasteners in machinery and equipment, driving their adoption in various sectors. |
4.3 Market Restraints |
4.3.1 Fluctuating raw material prices impacting the production cost of cotter pins. |
4.3.2 Competition from alternative fastening solutions such as lock nuts and retaining rings affecting the market growth. |
4.3.3 Stringent regulations related to material composition and product quality impacting the manufacturing processes of cotter pins. |
5 Denmark Cotter Pins Market Trends |
6 Denmark Cotter Pins Market Segmentations |
6.1 Denmark Cotter Pins Market, By Product Type |
6.1.1 Overview and Analysis |
6.1.2 Denmark Cotter Pins Market Revenues & Volume, By Tapered, 2022 - 2032F |
6.1.3 Denmark Cotter Pins Market Revenues & Volume, By Others, 2022 - 2032F |
6.2 Denmark Cotter Pins Market, By Application |
6.2.1 Overview and Analysis |
6.2.2 Denmark Cotter Pins Market Revenues & Volume, By Link, 2022 - 2032F |
6.2.3 Denmark Cotter Pins Market Revenues & Volume, By Location, 2022 - 2032F |
7 Denmark Cotter Pins Market Import-Export Trade Statistics |
7.1 Denmark Cotter Pins Market Export to Major Countries |
7.2 Denmark Cotter Pins Market Imports from Major Countries |
8 Denmark Cotter Pins Market Key Performance Indicators |
8.1 Percentage increase in the adoption of cotter pins across different industries in Denmark. |
8.2 Rate of innovation in cotter pin technology and design to meet changing market demands. |
8.3 Number of new applications or industries where cotter pins are being used, indicating market diversification. |
9 Denmark Cotter Pins Market - Opportunity Assessment |
9.1 Denmark Cotter Pins Market Opportunity Assessment, By Product Type, 2022 & 2032F |
9.2 Denmark Cotter Pins Market Opportunity Assessment, By Application, 2022 & 2032F |
10 Denmark Cotter Pins Market - Competitive Landscape |
10.1 Denmark Cotter Pins Market Revenue Share, By Companies, 2025 |
10.2 Denmark Cotter Pins Market Competitive Benchmarking, By Operating and Technical Parameters |
11 Company Profiles |
12 Recommendations | 13 Disclaimer |
Global Go To Market Strategy - 2030
Export potential enables firms to identify high-growth global markets with greater confidence by combining advanced trade intelligence with a structured quantitative methodology. The framework analyzes emerging demand trends and country-level import patterns while integrating macroeconomic and trade datasets such as GDP and population forecasts, bilateral import–export flows, tariff structures, elasticity differentials between developed and developing economies, geographic distance, and import demand projections. Using weighted trade values from 2020–2024 as the base period to project country-to-country export potential for 2030, these inputs are operationalized through calculated drivers such as gravity model parameters, tariff impact factors, and projected GDP per-capita growth. Through an analysis of hidden potentials, demand hotspots, and market conditions that are most favorable to success, this method enables firms to focus on target countries, maximize returns, and global expansion with data, backed by accuracy.
By factoring in the projected importer demand gap that is currently unmet and could be potential opportunity, it identifies the potential for the Exporter (Country) among 190 countries, against the general trade analysis, which identifies the biggest importer or exporter.
To discover high-growth global markets and optimize your business strategy:
Click Here
Pricing
- Single User License$ 1,995
- Department License$ 2,400
- Site License$ 3,120
- Global License$ 3,795

Leadership Perspectives from Industry Events
Search
Thought Leadership and Analyst Meet


Our Clients
6WResearch In News
- India Export Attractiveness Tracker 2026
- India Air Conditioner Market Set for Strong Rebound in 2026 After Weather-Led Correction and GST-Driven Recovery: 6Wresearch
- ADAS in India: How Automatic Emergency Braking, Blind Spot Detection & Driver Monitoring are Transforming Road Safety
- Doha a strategic location for EV manufacturing hub: IPA Qatar
- Demand for luxury TVs surging in the GCC, says Samsung
- Empowering Growth: The Thriving Journey of Bangladesh’s Cable Industry
Latest Reports
- Nicaragua RPG Gaming Market (2026-2032)
- New Zealand RPG Gaming Market (2026-2032)
- Netherlands RPG Gaming Market (2026-2032)
- Nauru RPG Gaming Market (2026-2032)
- Namibia RPG Gaming Market (2026-2032)
- Mozambique RPG Gaming Market (2026-2032)
- Montenegro RPG Gaming Market (2026-2032)
- Mongolia RPG Gaming Market (2026-2032)
- Monaco RPG Gaming Market (2026-2032)
- Micronesia RPG Gaming Market (2026-2032)
Industry Events and Analyst Meet

EV India Expo 2026

HIMTEX 2026

India Refining Summit 2026

India EV Show 2026

EV tech India Expo 2026
Whitepaper
- Middle East & Africa Commercial Security Market Click here to view more.
- Middle East & Africa Fire Safety Systems & Equipment Market Click here to view more.
- GCC Drone Market Click here to view more.
- Middle East Lighting Fixture Market Click here to view more.
- GCC Physical & Perimeter Security Market Click here to view more.