Denmark Dimethylformamide Market (2026-2032) | Size & Revenue, Industry, Trends, Analysis, Companies, Competitive Landscape, Forecast, Share, Segmentation, Growth, Value, Outlook
Market Forecast By Application (Chemical Processing and Solvents, Pharmaceuticals, Textiles, Other Applications) And Competitive Landscape
| Product Code: ETC6957728 | Publication Date: Sep 2024 | Updated Date: Apr 2026 | Product Type: Market Research Report | |
| Publisher: 6Wresearch | Author: Sumit Sagar | No. of Pages: 75 | No. of Figures: 35 | No. of Tables: 20 |
Denmark Dimethylformamide Market Size (2020-2030)
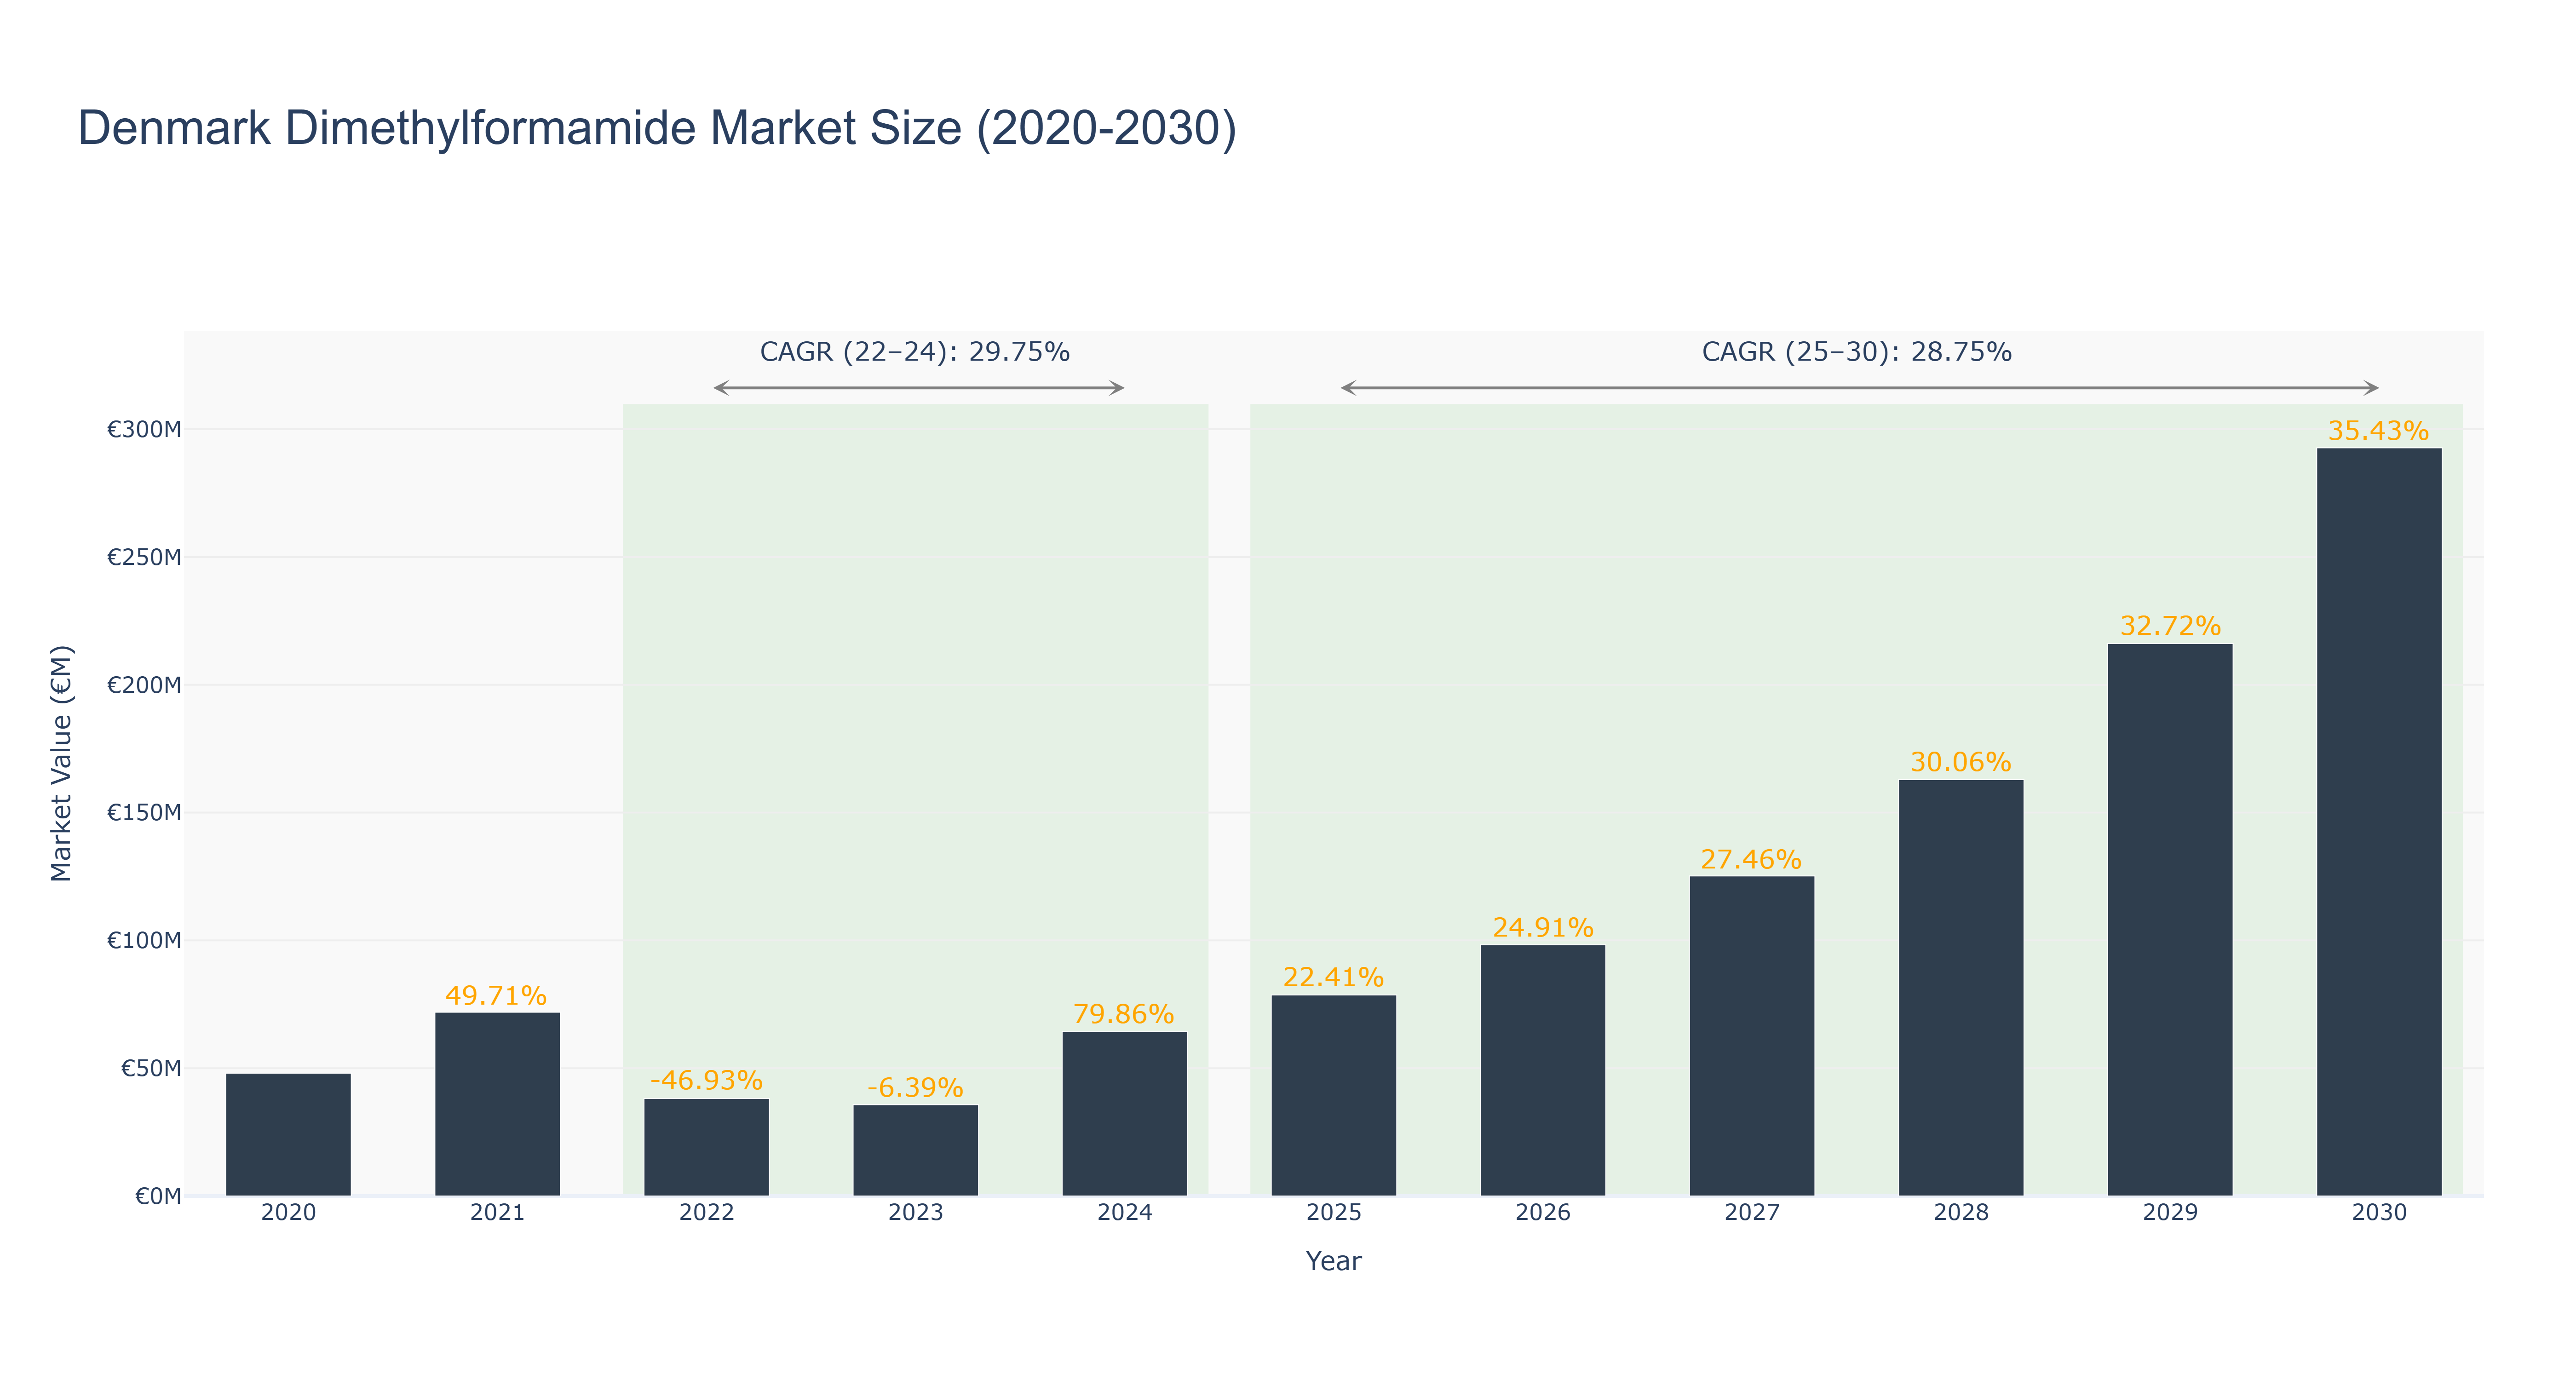
Denmark's Dimethylformamide Market experienced significant fluctuations in market size over the past decade. The market peaked at €292.73 million in 2030, showcasing a robust growth trend. From 2020 to 2024, the market size fluctuated, with a notable decline in 2022 followed by a substantial increase in 2024. The forecasted market size from 2025 to 2030 indicates continued growth, with a Compound Annual Growth Rate (CAGR) of 28.75% post-2025. The market's resilience can be attributed to factors such as increasing demand for industrial solvents and chemicals in various sectors. Looking ahead to 2026, Denmark's Dimethylformamide Market is poised for further expansion, with upcoming projects focusing on sustainable production practices and technological advancements to meet evolving industry standards.
Denmark Dimethylformamide Market: Production & Trade Performance (2019-2025)
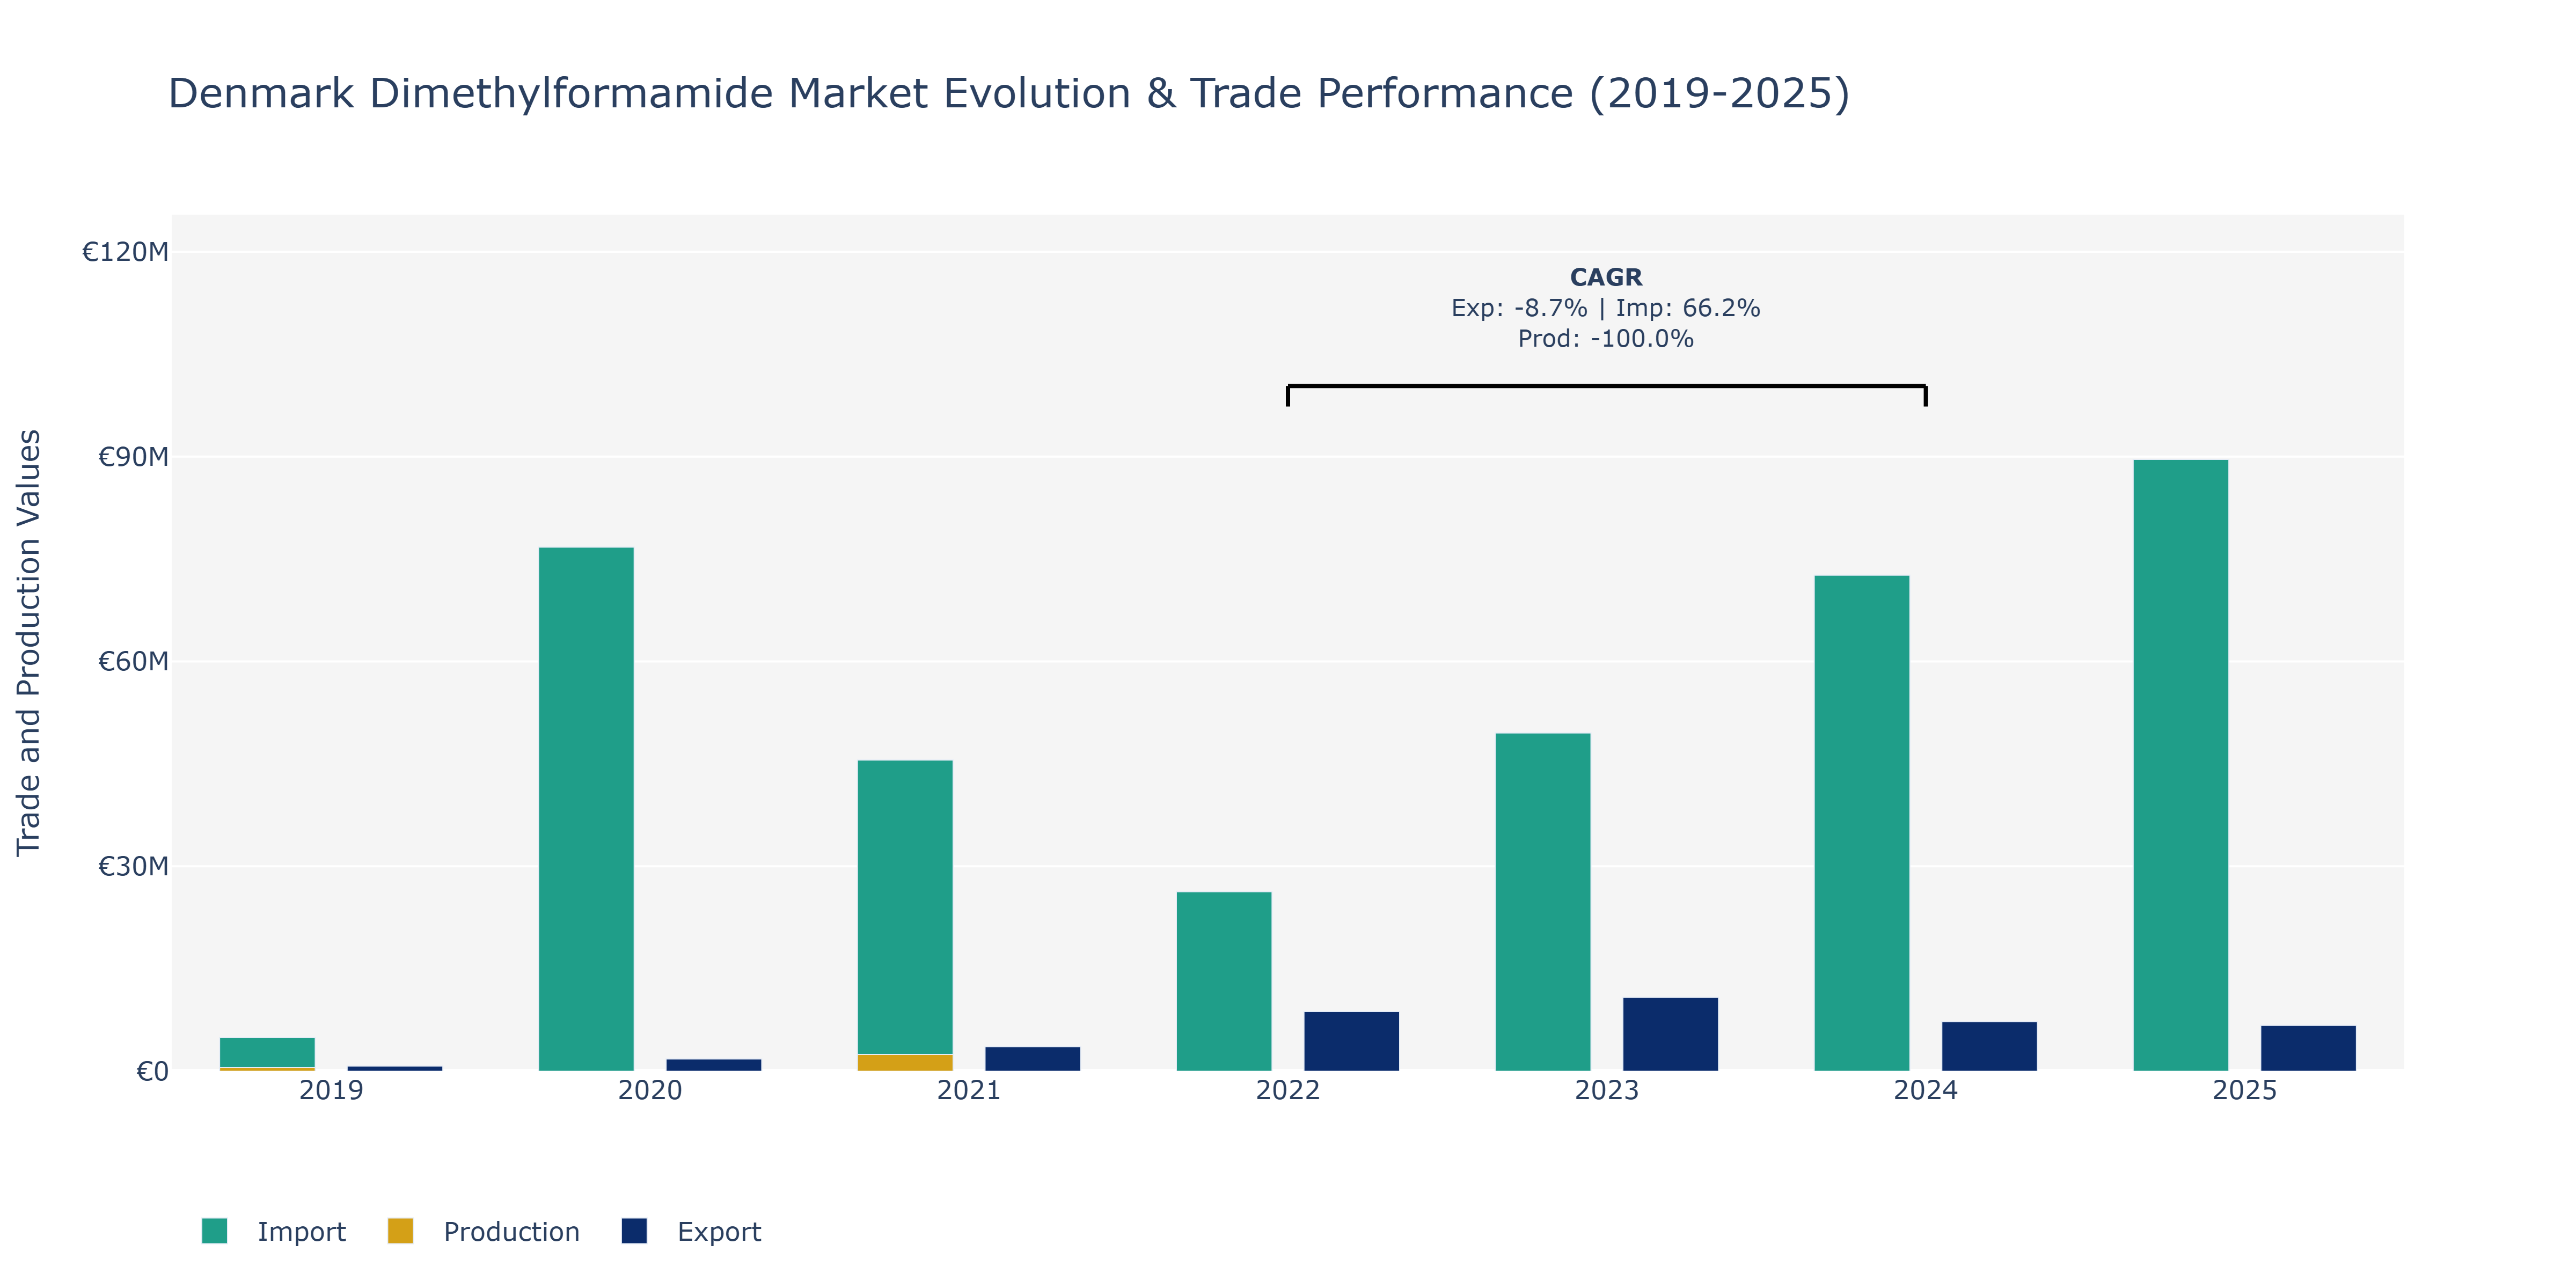
In the Denmark Dimethylformamide Market, from 2019 to 2025, exports experienced fluctuations. In 2019, exports stood at €747.61 thousand, seeing a substantial increase to €1.78 million in 2020. The trend continued upward, reaching a peak of €10.81 million in 2023 before slightly declining to €6.71 million in 2025. Imports, on the other hand, displayed significant growth, growing from €4.96 million in 2019 to €89.6 million in 2025. Production in 2021 was at €3.6 million, showing a sharp decline to €6.32 million in 2022, reflecting potential market shifts or production challenges. The fluctuations in exports could be attributed to shifts in global demand, changes in production capacities, or varying trade policies. The notable increase in imports could indicate increasing domestic demand, potential supply chain optimizations, or changes in sourcing strategies. The drastic decline in production in 2022 might be due to specific market-related factors impacting local manufacturing capabilities or disruptions in the supply chain. These trends suggest a dynamic market environment influenced by both domestic and international factors, highlighting the need for strategic planning and adaptability within the industry.
Key Highlights of the Report:
- Denmark Dimethylformamide Market Outlook
- Market Size of Denmark Dimethylformamide Market, 2025
- Forecast of Denmark Dimethylformamide Market, 2032
- Historical Data and Forecast of Denmark Dimethylformamide Revenues & Volume for the Period 2022 - 2032
- Denmark Dimethylformamide Market Trend Evolution
- Denmark Dimethylformamide Market Drivers and Challenges
- Denmark Dimethylformamide Price Trends
- Denmark Dimethylformamide Porter's Five Forces
- Denmark Dimethylformamide Industry Life Cycle
- Historical Data and Forecast of Denmark Dimethylformamide Market Revenues & Volume By Application for the Period 2022 - 2032
- Historical Data and Forecast of Denmark Dimethylformamide Market Revenues & Volume By Chemical Processing and Solvents for the Period 2022 - 2032
- Historical Data and Forecast of Denmark Dimethylformamide Market Revenues & Volume By Pharmaceuticals for the Period 2022 - 2032
- Historical Data and Forecast of Denmark Dimethylformamide Market Revenues & Volume By Textiles for the Period 2022 - 2032
- Historical Data and Forecast of Denmark Dimethylformamide Market Revenues & Volume By Other Applications for the Period 2022 - 2032
- Denmark Dimethylformamide Import Export Trade Statistics
- Market Opportunity Assessment By Application
- Denmark Dimethylformamide Top Companies Market Share
- Denmark Dimethylformamide Competitive Benchmarking By Technical and Operational Parameters
- Denmark Dimethylformamide Company Profiles
- Denmark Dimethylformamide Key Strategic Recommendations
Frequently Asked Questions About the Market Study (FAQs):
6Wresearch actively monitors the Denmark Dimethylformamide Market and publishes its comprehensive annual report, highlighting emerging trends, growth drivers, revenue analysis, and forecast outlook. Our insights help businesses to make data-backed strategic decisions with ongoing market dynamics. Our analysts track relevent industries related to the Denmark Dimethylformamide Market, allowing our clients with actionable intelligence and reliable forecasts tailored to emerging regional needs.
Yes, we provide customisation as per your requirements. To learn more, feel free to contact us on sales@6wresearch.com
1 Executive Summary |
2 Introduction |
2.1 Key Highlights of the Report |
2.2 Report Description |
2.3 Market Scope & Segmentation |
2.4 Research Methodology |
2.5 Assumptions |
3 Denmark Dimethylformamide Market Overview |
3.1 Denmark Country Macro Economic Indicators |
3.2 Denmark Dimethylformamide Market Revenues & Volume, 2022 & 2032F |
3.3 Denmark Dimethylformamide Market - Industry Life Cycle |
3.4 Denmark Dimethylformamide Market - Porter's Five Forces |
3.5 Denmark Dimethylformamide Market Revenues & Volume Share, By Application, 2022 & 2032F |
4 Denmark Dimethylformamide Market Dynamics |
4.1 Impact Analysis |
4.2 Market Drivers |
4.2.1 Growing demand for dimethylformamide in the pharmaceutical industry for manufacturing active pharmaceutical ingredients (APIs). |
4.2.2 Increasing use of dimethylformamide in the production of pesticides, agrochemicals, and herbicides. |
4.2.3 Rising adoption of dimethylformamide in the manufacture of polyurethane-based products due to its chemical properties. |
4.3 Market Restraints |
4.3.1 Stringent environmental regulations related to the disposal and handling of dimethylformamide. |
4.3.2 Fluctuating raw material prices, such as methanol and dimethylamine, impacting the overall production cost. |
4.3.3 Health hazards associated with exposure to dimethylformamide, leading to safety concerns among workers. |
5 Denmark Dimethylformamide Market Trends |
6 Denmark Dimethylformamide Market, By Types |
6.1 Denmark Dimethylformamide Market, By Application |
6.1.1 Overview and Analysis |
6.1.2 Denmark Dimethylformamide Market Revenues & Volume, By Application, 2022 - 2032F |
6.1.3 Denmark Dimethylformamide Market Revenues & Volume, By Chemical Processing and Solvents, 2022 - 2032F |
6.1.4 Denmark Dimethylformamide Market Revenues & Volume, By Pharmaceuticals, 2022 - 2032F |
6.1.5 Denmark Dimethylformamide Market Revenues & Volume, By Textiles, 2022 - 2032F |
6.1.6 Denmark Dimethylformamide Market Revenues & Volume, By Other Applications, 2022 - 2032F |
7 Denmark Dimethylformamide Market Import-Export Trade Statistics |
7.1 Denmark Dimethylformamide Market Export to Major Countries |
7.2 Denmark Dimethylformamide Market Imports from Major Countries |
8 Denmark Dimethylformamide Market Key Performance Indicators |
8.1 Environmental compliance metrics, such as waste management practices and emissions control. |
8.2 Raw material sourcing efficiency, focusing on cost-effective procurement strategies. |
8.3 Workplace safety indicators, including accident rates and compliance with health regulations. |
9 Denmark Dimethylformamide Market - Opportunity Assessment |
9.1 Denmark Dimethylformamide Market Opportunity Assessment, By Application, 2022 & 2032F |
10 Denmark Dimethylformamide Market - Competitive Landscape |
10.1 Denmark Dimethylformamide Market Revenue Share, By Companies, 2025 |
10.2 Denmark Dimethylformamide Market Competitive Benchmarking, By Operating and Technical Parameters |
11 Company Profiles |
12 Recommendations |
13 Disclaimer |
Export potential assessment - trade Analytics for 2030
Export potential enables firms to identify high-growth global markets with greater confidence by combining advanced trade intelligence with a structured quantitative methodology. The framework analyzes emerging demand trends and country-level import patterns while integrating macroeconomic and trade datasets such as GDP and population forecasts, bilateral import–export flows, tariff structures, elasticity differentials between developed and developing economies, geographic distance, and import demand projections. Using weighted trade values from 2020–2024 as the base period to project country-to-country export potential for 2030, these inputs are operationalized through calculated drivers such as gravity model parameters, tariff impact factors, and projected GDP per-capita growth. Through an analysis of hidden potentials, demand hotspots, and market conditions that are most favorable to success, this method enables firms to focus on target countries, maximize returns, and global expansion with data, backed by accuracy.
By factoring in the projected importer demand gap that is currently unmet and could be potential opportunity, it identifies the potential for the Exporter (Country) among 190 countries, against the general trade analysis, which identifies the biggest importer or exporter.
To discover high-growth global markets and optimize your business strategy:
Click Here
Pricing
- Single User License$ 1,995
- Department License$ 2,400
- Site License$ 3,120
- Global License$ 3,795

Search
Thought Leadership and Analyst Meet


Our Clients
Latest Reports
- Philippines Polyhydroxybutyrate-co-Hydroxyvalerate Market (2026-2032) | Trends, Insights, Challenges, Restraints, Competition, Size, Value, Forecast, Pricing, Share, Outlook, Revenue, Investment Opportunities, Strategy, Drivers, Demand, Growth, segmentation, Analysis, Companies
- Peru Polyhydroxybutyrate-co-Hydroxyvalerate Market (2026-2032) | Growth, Demand, Challenges, Share, Trends, Analysis, Pricing, Investment Opportunities, Drivers, Value, Forecast, Competition, Size, Companies, Insights, Outlook, Restraints, segmentation, Revenue, Strategy
- Pakistan Polyhydroxybutyrate-co-Hydroxyvalerate Market (2026-2032) | Restraints, segmentation, Pricing, Forecast, Share, Strategy, Competition, Trends, Insights, Drivers, Challenges, Growth, Revenue, Outlook, Value, Investment Opportunities, Companies, Size, Analysis, Demand
- Oman Polyhydroxybutyrate-co-Hydroxyvalerate Market (2026-2032) | Drivers, segmentation, Insights, Competition, Pricing, Outlook, Size, Revenue, Challenges, Forecast, Analysis, Growth, Value, Share, Trends, Investment Opportunities, Strategy, Restraints, Companies, Demand
- Nigeria Polyhydroxybutyrate-co-Hydroxyvalerate Market (2026-2032) | Value, Investment Opportunities, Analysis, Revenue, Restraints, Pricing, Outlook, Competition, Demand, Growth, Forecast, Companies, Trends, Challenges, segmentation, Drivers, Insights, Share, Size, Strategy
- Nepal Polyhydroxybutyrate-co-Hydroxyvalerate Market (2026-2032) | Insights, Analysis, Drivers, Share, Revenue, Demand, segmentation, Investment Opportunities, Competition, Forecast, Growth, Pricing, Companies, Strategy, Trends, Restraints, Challenges, Outlook, Size, Value
- Myanmar Polyhydroxybutyrate-co-Hydroxyvalerate Market (2026-2032) | Outlook, Revenue, Strategy, Restraints, Drivers, segmentation, Share, Forecast, Competition, Insights, Growth, Pricing, Size, Demand, Value, Companies, Trends, Challenges, Investment Opportunities, Analysis
- Morocco Polyhydroxybutyrate-co-Hydroxyvalerate Market (2026-2032) | Outlook, Investment Opportunities, Restraints, Strategy, Forecast, Challenges, Drivers, Growth, Companies, segmentation, Trends, Size, Competition, Revenue, Demand, Insights, Share, Analysis, Value, Pricing
- Mexico Polyhydroxybutyrate-co-Hydroxyvalerate Market (2026-2032) | Size, Drivers, Outlook, Share, Strategy, Growth, Pricing, Challenges, Companies, Demand, Value, Investment Opportunities, Restraints, Trends, Forecast, segmentation, Analysis, Insights, Competition, Revenue
- Malaysia Polyhydroxybutyrate-co-Hydroxyvalerate Market (2026-2032) | Share, segmentation, Size, Companies, Analysis, Insights, Forecast, Value, Revenue, Drivers, Restraints, Challenges, Investment Opportunities, Trends, Competition, Strategy, Demand, Growth, Outlook, Pricing
Industry Events and Analyst Meet

HIMTEX 2026

India Refining Summit 2026

India EV Show 2026

EV tech India Expo 2026

Auto Tech Asia 2026
Whitepaper
- Middle East & Africa Commercial Security Market Click here to view more.
- Middle East & Africa Fire Safety Systems & Equipment Market Click here to view more.
- GCC Drone Market Click here to view more.
- Middle East Lighting Fixture Market Click here to view more.
- GCC Physical & Perimeter Security Market Click here to view more.
6WResearch In News
- Doha a strategic location for EV manufacturing hub: IPA Qatar
- Demand for luxury TVs surging in the GCC, says Samsung
- Empowering Growth: The Thriving Journey of Bangladesh’s Cable Industry
- Demand for luxury TVs surging in the GCC, says Samsung
- Video call with a traditional healer? Once unthinkable, it’s now common in South Africa
- Intelligent Buildings To Smooth GCC’s Path To Net Zero