Denmark Fiberboard Market (2026-2032) | Value, Size, Share, Analysis, Trends, Forecast, Growth, Outlook, Revenue, Industry, Segmentation & Companies
Market Forecast By Board Type (Hardboard, Medium/Hard Density Fiberboard MDF/HDF, Other Fiberboard), By Application (Construction, Roofing, Others) And Competitive Landscape
| Product Code: ETC5335586 | Publication Date: Nov 2023 | Updated Date: Apr 2026 | Product Type: Market Research Report | |
| Publisher: 6Wresearch | Author: Ravi Bhandari | No. of Pages: 60 | No. of Figures: 30 | No. of Tables: 5 |
Denmark Fiberboard Market Size (2020-2030)
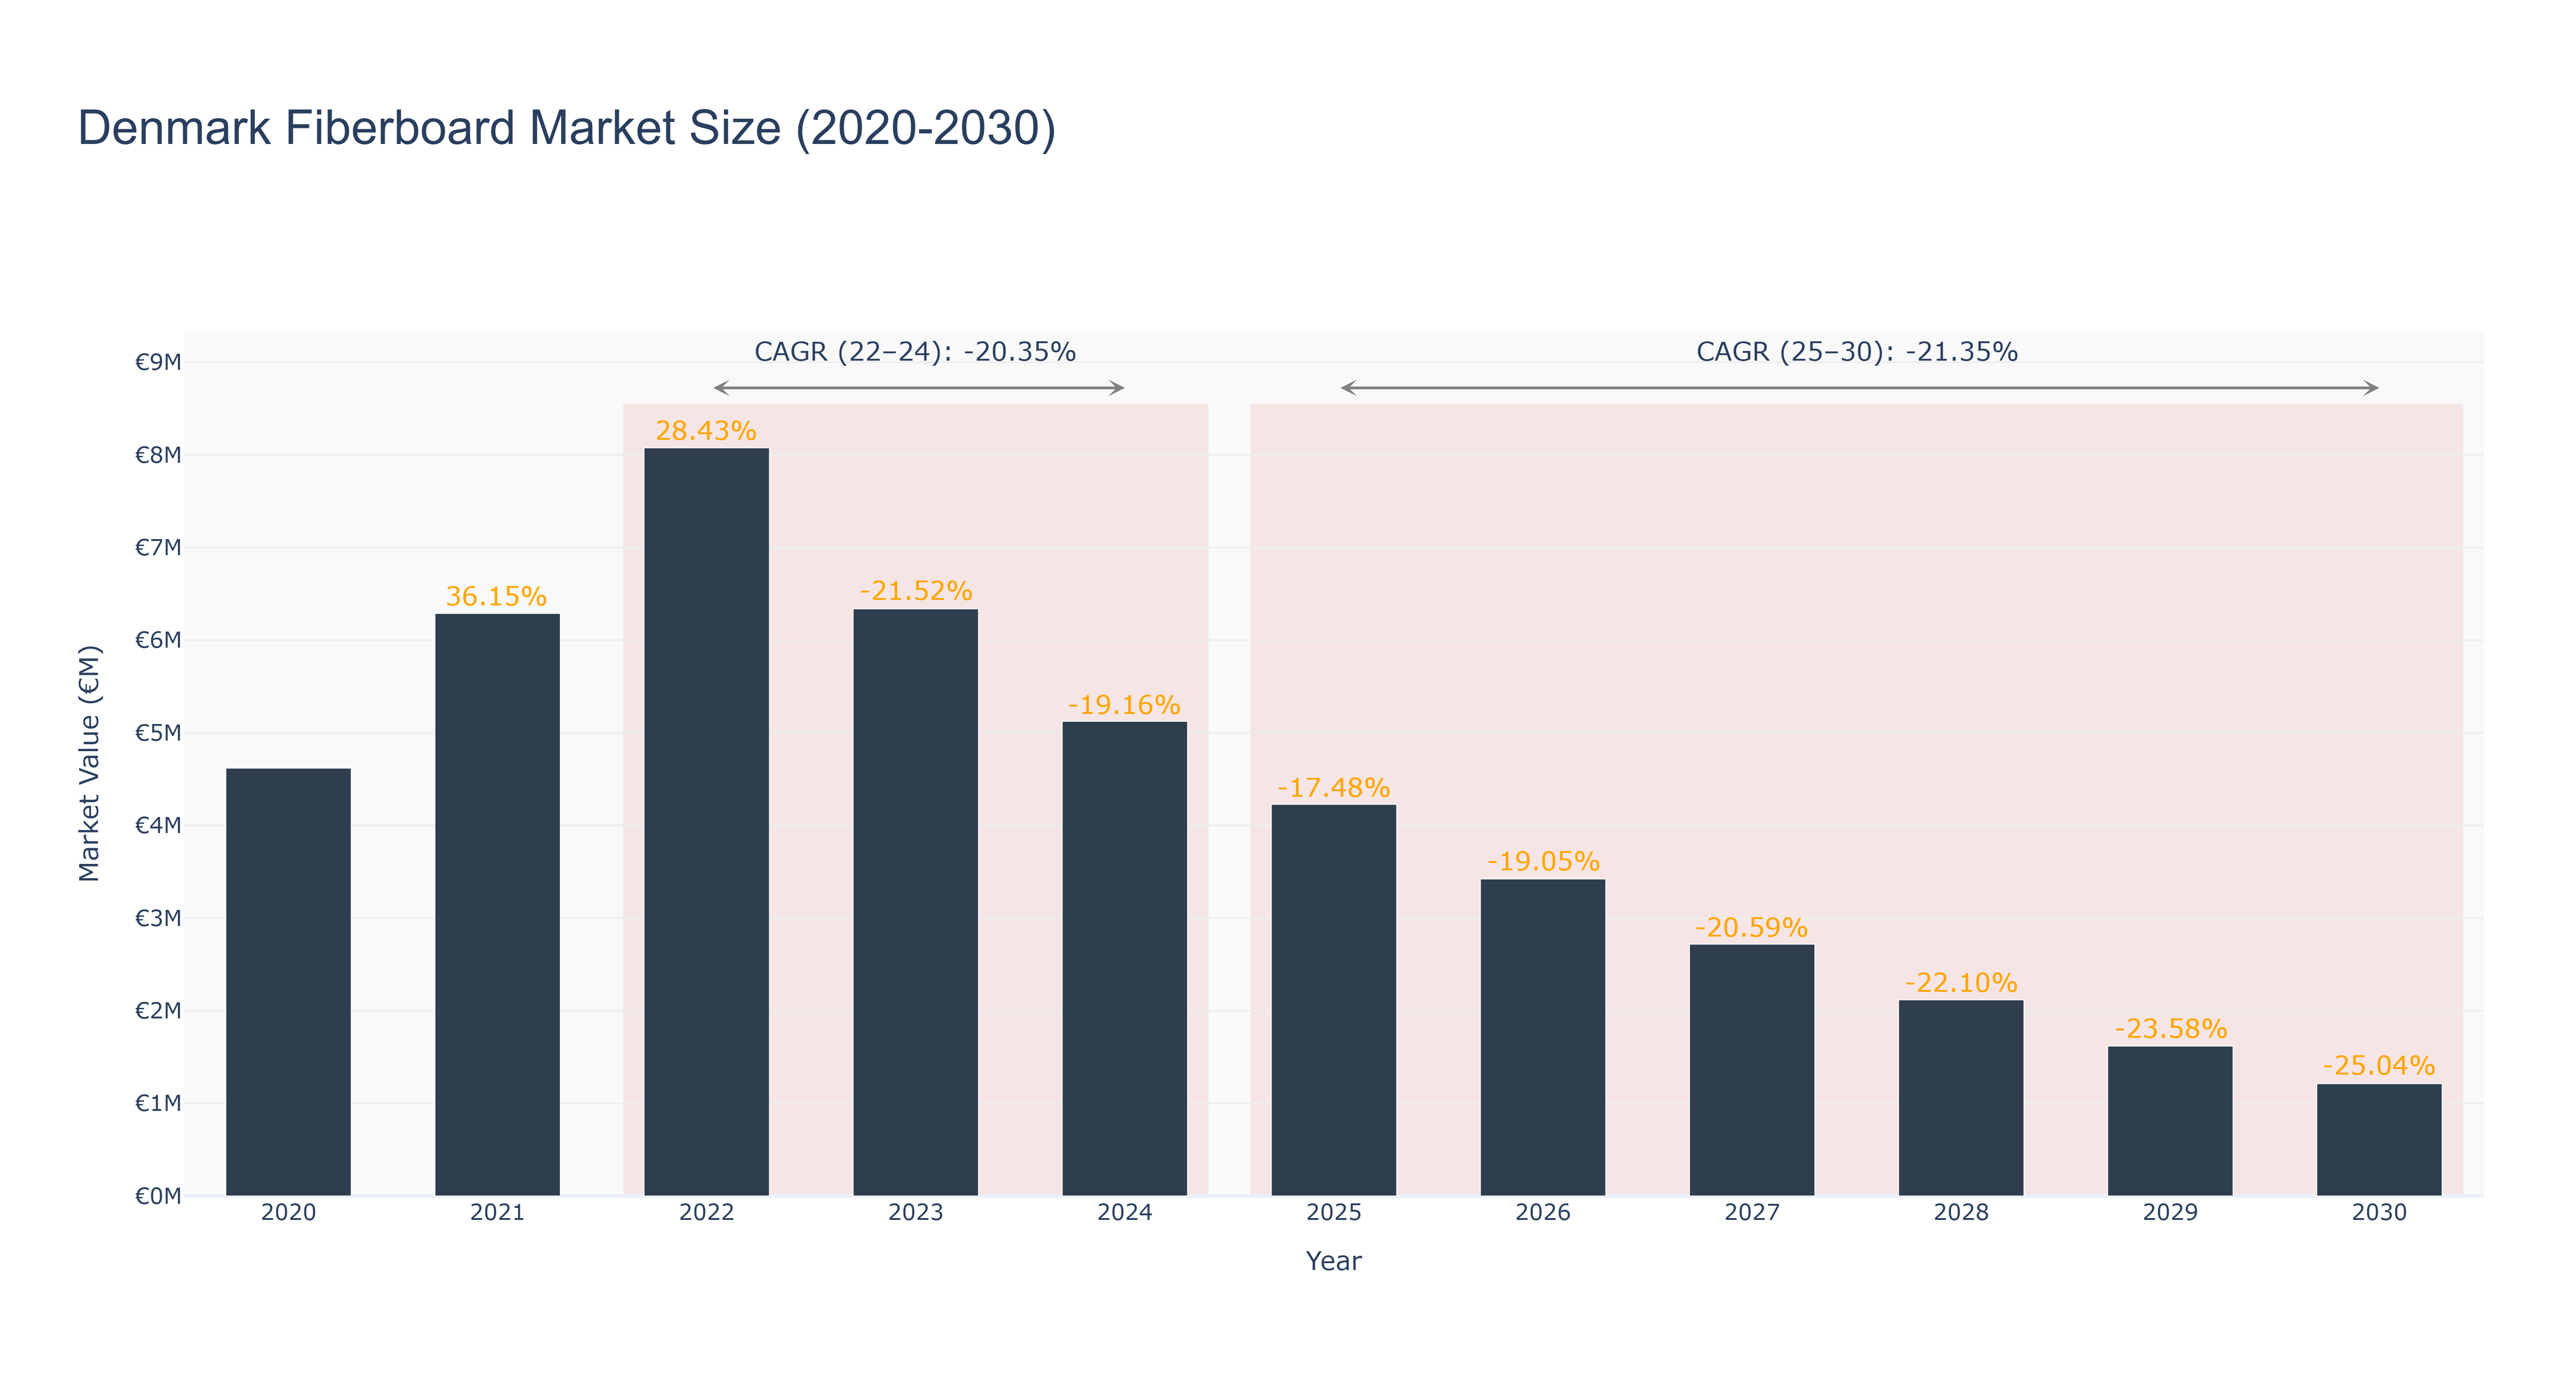
Denmark Fiberboard Market has shown a declining trend in market size over the years. The peak market size of €8.08 million was recorded in 2022, followed by a steady decrease to €1.21 million in 2030. The CAGR from 2022 to 2024 was -20.35%, while the forecasted CAGR from 2025 to 2030 is -21.35%. The market faced challenges due to economic downturns and reduced demand for fiberboard products. However, industry drivers such as sustainability initiatives and technological advancements in manufacturing processes could potentially drive market recovery in the future. Recent developments in the Danish fiberboard market include increased focus on eco-friendly materials and innovative product designs to cater to evolving consumer preferences. Future projects may involve collaborations with renewable energy sources to enhance sustainability practices within the industry.
Denmark Fiberboard Market: Production & Trade Performance (2019-2025)
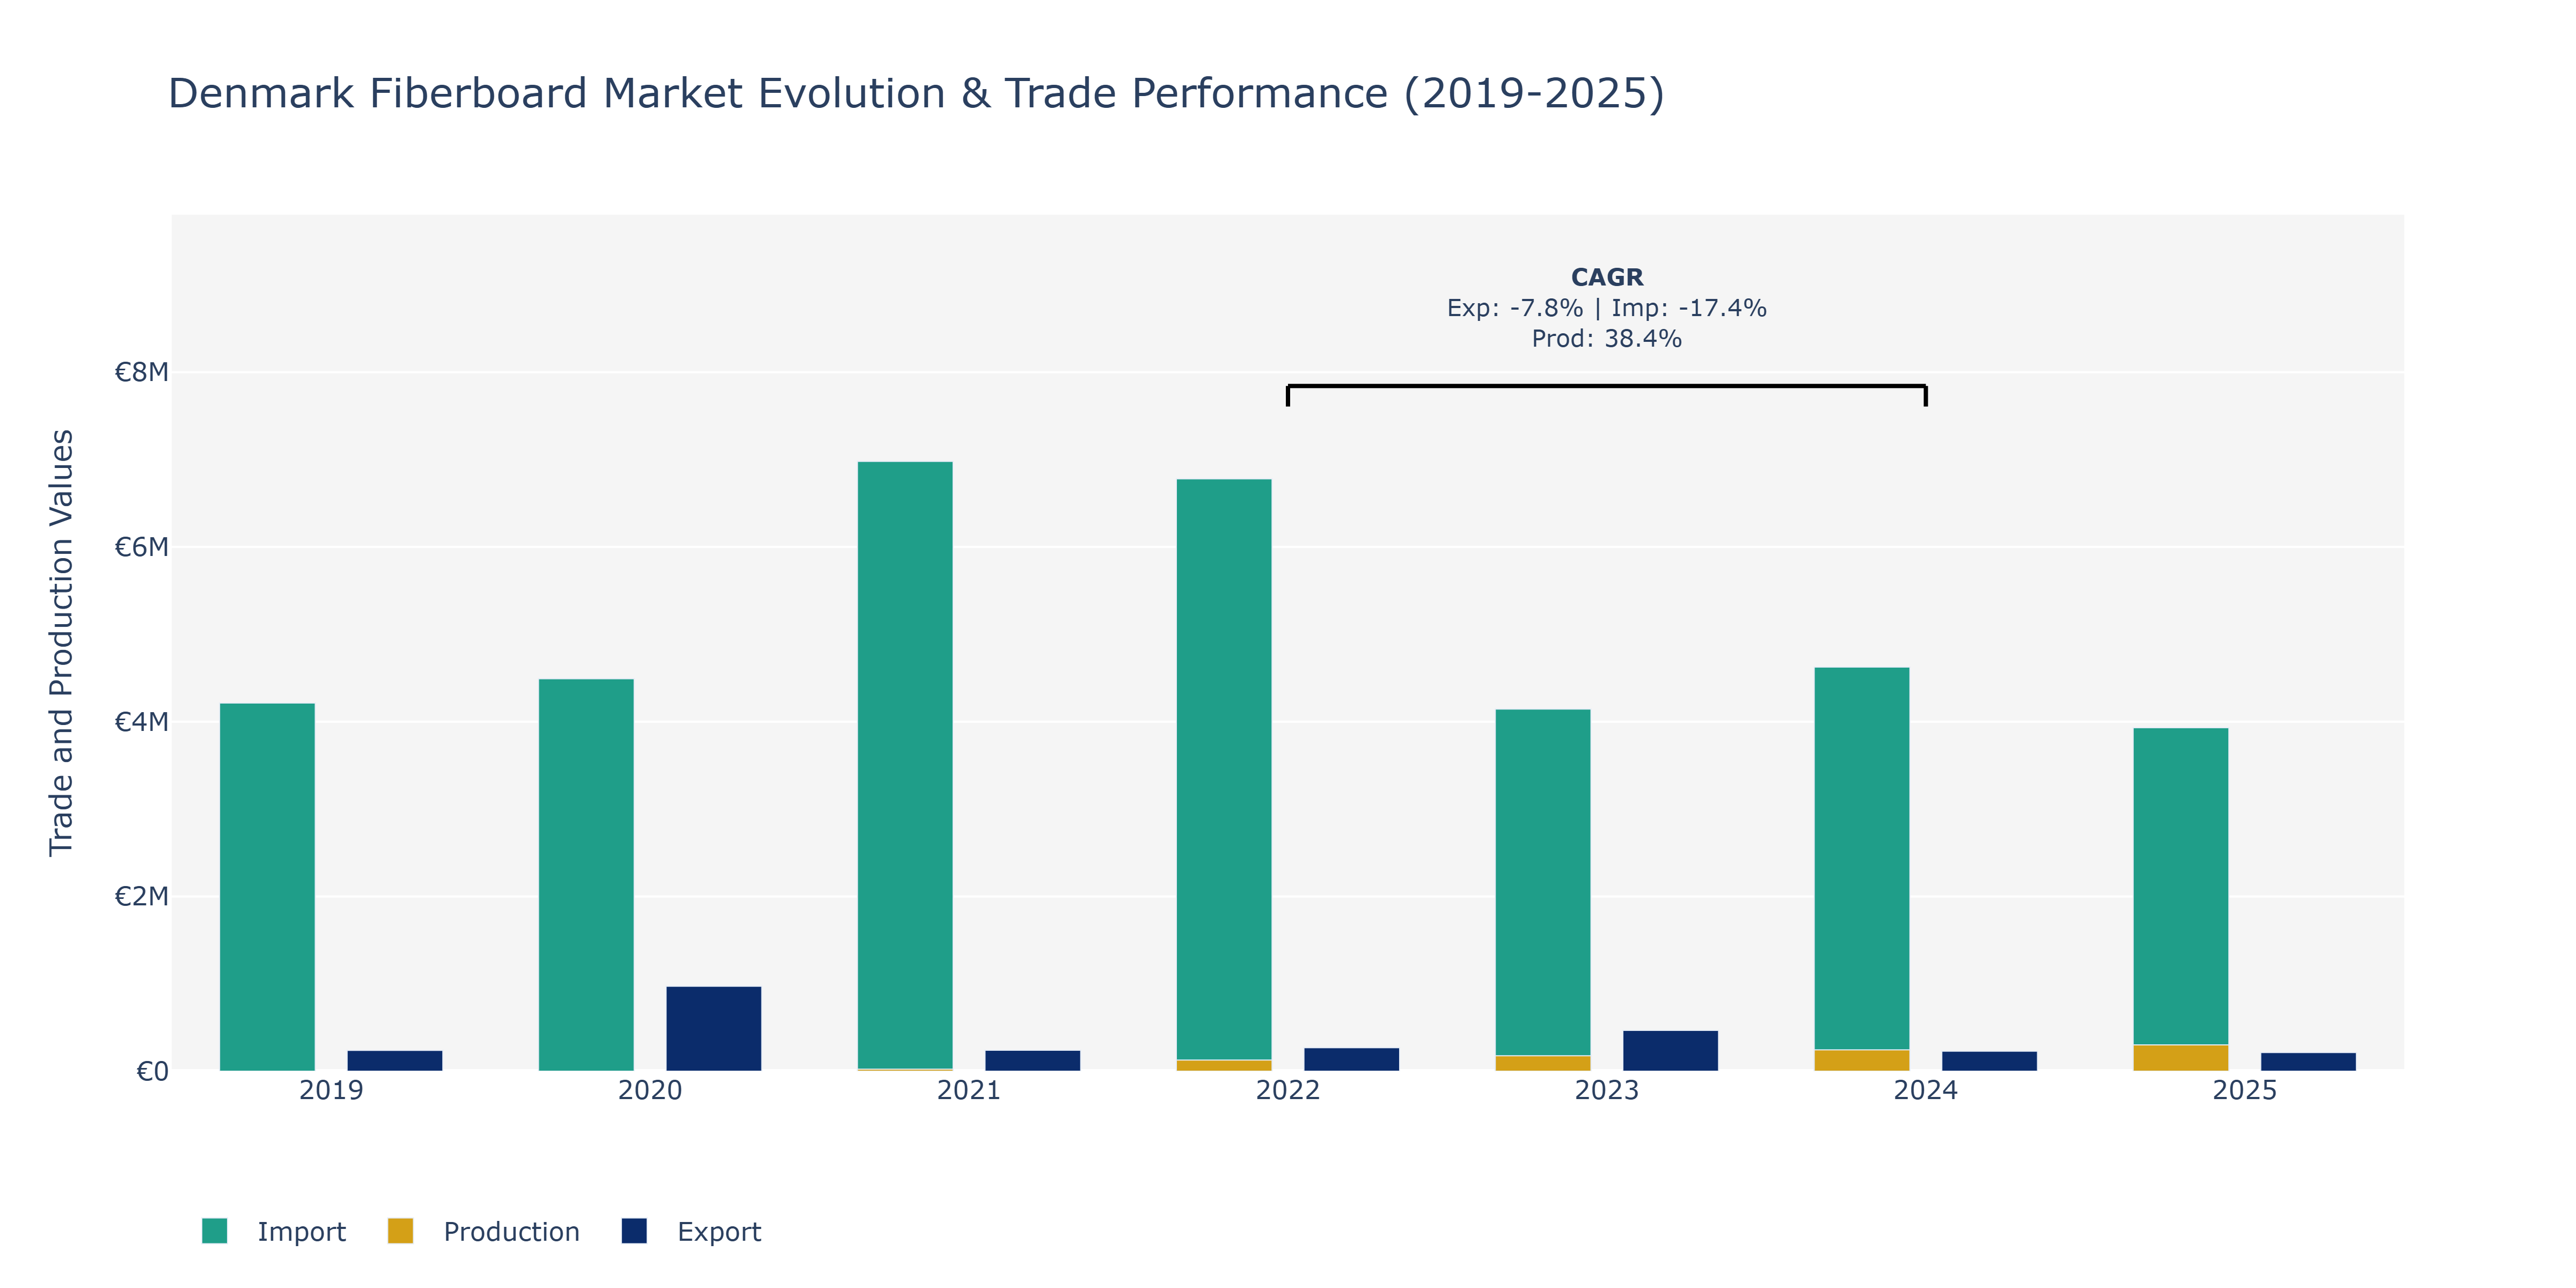
In the Denmark Fiberboard Market, from 2019 to 2025, Exports experienced fluctuations, with peaks in 2020 at €972.19 thousand and a noticeable decline in 2024 to €229.03 thousand. Imports also fluctuated, reaching a peak in 2021 at €6.98 million before decreasing in 2025 to €3.93 million. Production showed a steady increase over the period, with a significant rise from 2019 to 2025, reaching €300.82 million. The fluctuations in Exports and Imports can be attributed to global economic conditions, trade agreements, and market demand shifts. The rise in Production is likely due to technological advancements, increased demand for fiberboard products, and sustainable manufacturing practices in the industry. These trends reflect the market's responsiveness to both local and international factors, indicating the need for companies to adapt to changing market dynamics to maintain competitiveness in the fiberboard sector.
Key Highlights of the Report:
- Denmark Fiberboard Market Outlook
- Market Size of Denmark Fiberboard Market, 2025
- Forecast of Denmark Fiberboard Market, 2032
- Historical Data and Forecast of Denmark Fiberboard Revenues & Volume for the Period 2022 - 2032F
- Denmark Fiberboard Market Trend Evolution
- Denmark Fiberboard Market Drivers and Challenges
- Denmark Fiberboard Price Trends
- Denmark Fiberboard Porter`s Five Forces
- Denmark Fiberboard Industry Life Cycle
- Historical Data and Forecast of Denmark Fiberboard Market Revenues & Volume By Board Type for the Period 2022 - 2032F
- Historical Data and Forecast of Denmark Fiberboard Market Revenues & Volume By Hardboard for the Period 2022 - 2032F
- Historical Data and Forecast of Denmark Fiberboard Market Revenues & Volume By Medium/Hard Density Fiberboard MDF/HDF for the Period 2022 - 2032F
- Historical Data and Forecast of Denmark Fiberboard Market Revenues & Volume By Other Fiberboard for the Period 2022 - 2032F
- Historical Data and Forecast of Denmark Fiberboard Market Revenues & Volume By Application for the Period 2022 - 2032F
- Historical Data and Forecast of Denmark Fiberboard Market Revenues & Volume By Construction for the Period 2022 - 2032F
- Historical Data and Forecast of Denmark Fiberboard Market Revenues & Volume By Roofing for the Period 2022 - 2032F
- Historical Data and Forecast of Denmark Fiberboard Market Revenues & Volume By Others for the Period 2022 - 2032F
- Denmark Fiberboard Import Export Trade Statistics
- Market Opportunity Assessment By Board Type
- Market Opportunity Assessment By Application
- Denmark Fiberboard Top Companies Market Share
- Denmark Fiberboard Competitive Benchmarking By Technical and Operational Parameters
- Denmark Fiberboard Company Profiles
- Denmark Fiberboard Key Strategic Recommendations
Frequently Asked Questions About the Market Study (FAQs):
6Wresearch actively monitors the Denmark Fiberboard Market and publishes its comprehensive annual report, highlighting emerging trends, growth drivers, revenue analysis, and forecast outlook. Our insights help businesses to make data-backed strategic decisions with ongoing market dynamics. Our analysts track relevent industries related to the Denmark Fiberboard Market, allowing our clients with actionable intelligence and reliable forecasts tailored to emerging regional needs.
Yes, we provide customisation as per your requirements. To learn more, feel free to contact us on sales@6wresearch.com
1 Executive Summary |
2 Introduction |
2.1 Key Highlights of the Report |
2.2 Report Description |
2.3 Market Scope & Segmentation |
2.4 Research Methodology |
2.5 Assumptions |
3 Denmark Fiberboard Market Overview |
3.1 Denmark Country Macro Economic Indicators |
3.2 Denmark Fiberboard Market Revenues & Volume, 2022 & 2032F |
3.3 Denmark Fiberboard Market - Industry Life Cycle |
3.4 Denmark Fiberboard Market - Porter's Five Forces |
3.5 Denmark Fiberboard Market Revenues & Volume Share, By Board Type, 2022 & 2032F |
3.6 Denmark Fiberboard Market Revenues & Volume Share, By Application , 2022 & 2032F |
4 Denmark Fiberboard Market Dynamics |
4.1 Impact Analysis |
4.2 Market Drivers |
4.2.1 Increasing demand for sustainable and eco-friendly building materials |
4.2.2 Growing construction industry in Denmark |
4.2.3 Government initiatives promoting the use of renewable materials in construction |
4.3 Market Restraints |
4.3.1 Fluctuations in raw material prices |
4.3.2 Competition from substitute materials such as plastic and metal |
4.3.3 Regulatory challenges related to environmental standards and certifications |
5 Denmark Fiberboard Market Trends |
6 Denmark Fiberboard Market Segmentations |
6.1 Denmark Fiberboard Market, By Board Type |
6.1.1 Overview and Analysis |
6.1.2 Denmark Fiberboard Market Revenues & Volume, By Hardboard, 2022 - 2032F |
6.1.3 Denmark Fiberboard Market Revenues & Volume, By Medium/Hard Density Fiberboard MDF/HDF, 2022 - 2032F |
6.1.4 Denmark Fiberboard Market Revenues & Volume, By Other Fiberboard, 2022 - 2032F |
6.2 Denmark Fiberboard Market, By Application |
6.2.1 Overview and Analysis |
6.2.2 Denmark Fiberboard Market Revenues & Volume, By Construction, 2022 - 2032F |
6.2.3 Denmark Fiberboard Market Revenues & Volume, By Roofing, 2022 - 2032F |
6.2.4 Denmark Fiberboard Market Revenues & Volume, By Others, 2022 - 2032F |
7 Denmark Fiberboard Market Import-Export Trade Statistics |
7.1 Denmark Fiberboard Market Export to Major Countries |
7.2 Denmark Fiberboard Market Imports from Major Countries |
8 Denmark Fiberboard Market Key Performance Indicators |
8.1 Percentage of construction projects using fiberboard as a primary material |
8.2 Growth in the number of fiberboard manufacturing facilities in Denmark |
8.3 Adoption rate of eco-label certifications for fiberboard products |
9 Denmark Fiberboard Market - Opportunity Assessment |
9.1 Denmark Fiberboard Market Opportunity Assessment, By Board Type, 2022 & 2032F |
9.2 Denmark Fiberboard Market Opportunity Assessment, By Application , 2022 & 2032F |
10 Denmark Fiberboard Market - Competitive Landscape |
10.1 Denmark Fiberboard Market Revenue Share, By Companies, 2025 |
10.2 Denmark Fiberboard Market Competitive Benchmarking, By Operating and Technical Parameters |
11 Company Profiles |
12 Recommendations | 13 Disclaimer |
Global Go To Market Strategy - 2030
Export potential enables firms to identify high-growth global markets with greater confidence by combining advanced trade intelligence with a structured quantitative methodology. The framework analyzes emerging demand trends and country-level import patterns while integrating macroeconomic and trade datasets such as GDP and population forecasts, bilateral import–export flows, tariff structures, elasticity differentials between developed and developing economies, geographic distance, and import demand projections. Using weighted trade values from 2020–2024 as the base period to project country-to-country export potential for 2030, these inputs are operationalized through calculated drivers such as gravity model parameters, tariff impact factors, and projected GDP per-capita growth. Through an analysis of hidden potentials, demand hotspots, and market conditions that are most favorable to success, this method enables firms to focus on target countries, maximize returns, and global expansion with data, backed by accuracy.
By factoring in the projected importer demand gap that is currently unmet and could be potential opportunity, it identifies the potential for the Exporter (Country) among 190 countries, against the general trade analysis, which identifies the biggest importer or exporter.
To discover high-growth global markets and optimize your business strategy:
Click Here
Pricing
- Single User License$ 1,995
- Department License$ 2,400
- Site License$ 3,120
- Global License$ 3,795

Leadership Perspectives from Industry Events
Search
Thought Leadership and Analyst Meet


Our Clients
6WResearch In News
- Doha a strategic location for EV manufacturing hub: IPA Qatar
- Demand for luxury TVs surging in the GCC, says Samsung
- Empowering Growth: The Thriving Journey of Bangladesh’s Cable Industry
- Demand for luxury TVs surging in the GCC, says Samsung
- Video call with a traditional healer? Once unthinkable, it’s now common in South Africa
- Intelligent Buildings To Smooth GCC’s Path To Net Zero
Latest Reports
- Cape Verde Portable Hand-Thrown Extinguisher Market (2026-2032)
- Canada Portable Hand-Thrown Extinguisher Market (2026-2032)
- Cameroon Portable Hand-Thrown Extinguisher Market (2026-2032)
- Burundi Portable Hand-Thrown Extinguisher Market (2026-2032)
- Burkina Faso Portable Hand-Thrown Extinguisher Market (2026-2032)
- Bulgaria Portable Hand-Thrown Extinguisher Market (2026-2032)
- Brunei Portable Hand-Thrown Extinguisher Market (2026-2032)
- Botswana Portable Hand-Thrown Extinguisher Market (2026-2032)
- Bosnia and Herzegovina Portable Hand-Thrown Extinguisher Market (2026-2032)
- Bolivia Portable Hand-Thrown Extinguisher Market (2026-2032)
Industry Events and Analyst Meet

HIMTEX 2026

India Refining Summit 2026

India EV Show 2026

EV tech India Expo 2026

Auto Tech Asia 2026
Whitepaper
- Middle East & Africa Commercial Security Market Click here to view more.
- Middle East & Africa Fire Safety Systems & Equipment Market Click here to view more.
- GCC Drone Market Click here to view more.
- Middle East Lighting Fixture Market Click here to view more.
- GCC Physical & Perimeter Security Market Click here to view more.