Denmark Fructose Market (2026-2032) | Outlook, Trends, Forecast, Analysis, Revenue, Growth, Size, Segmentation, Industry, Value, Companies & Share
Market Forecast By Product (High Fructose Corn Syrup, Fructose Syrups, Fructose Solids), By Application (Beverages, Processed Foods, Dairy Products, Confectionary, Bakery & Cereals, Others) And Competitive Landscape
| Product Code: ETC4733362 | Publication Date: Nov 2023 | Updated Date: Apr 2026 | Product Type: Market Research Report | |
| Publisher: 6Wresearch | Author: Shubham Padhi | No. of Pages: 60 | No. of Figures: 30 | No. of Tables: 5 |
Denmark Fructose Market Size (2020-2030)
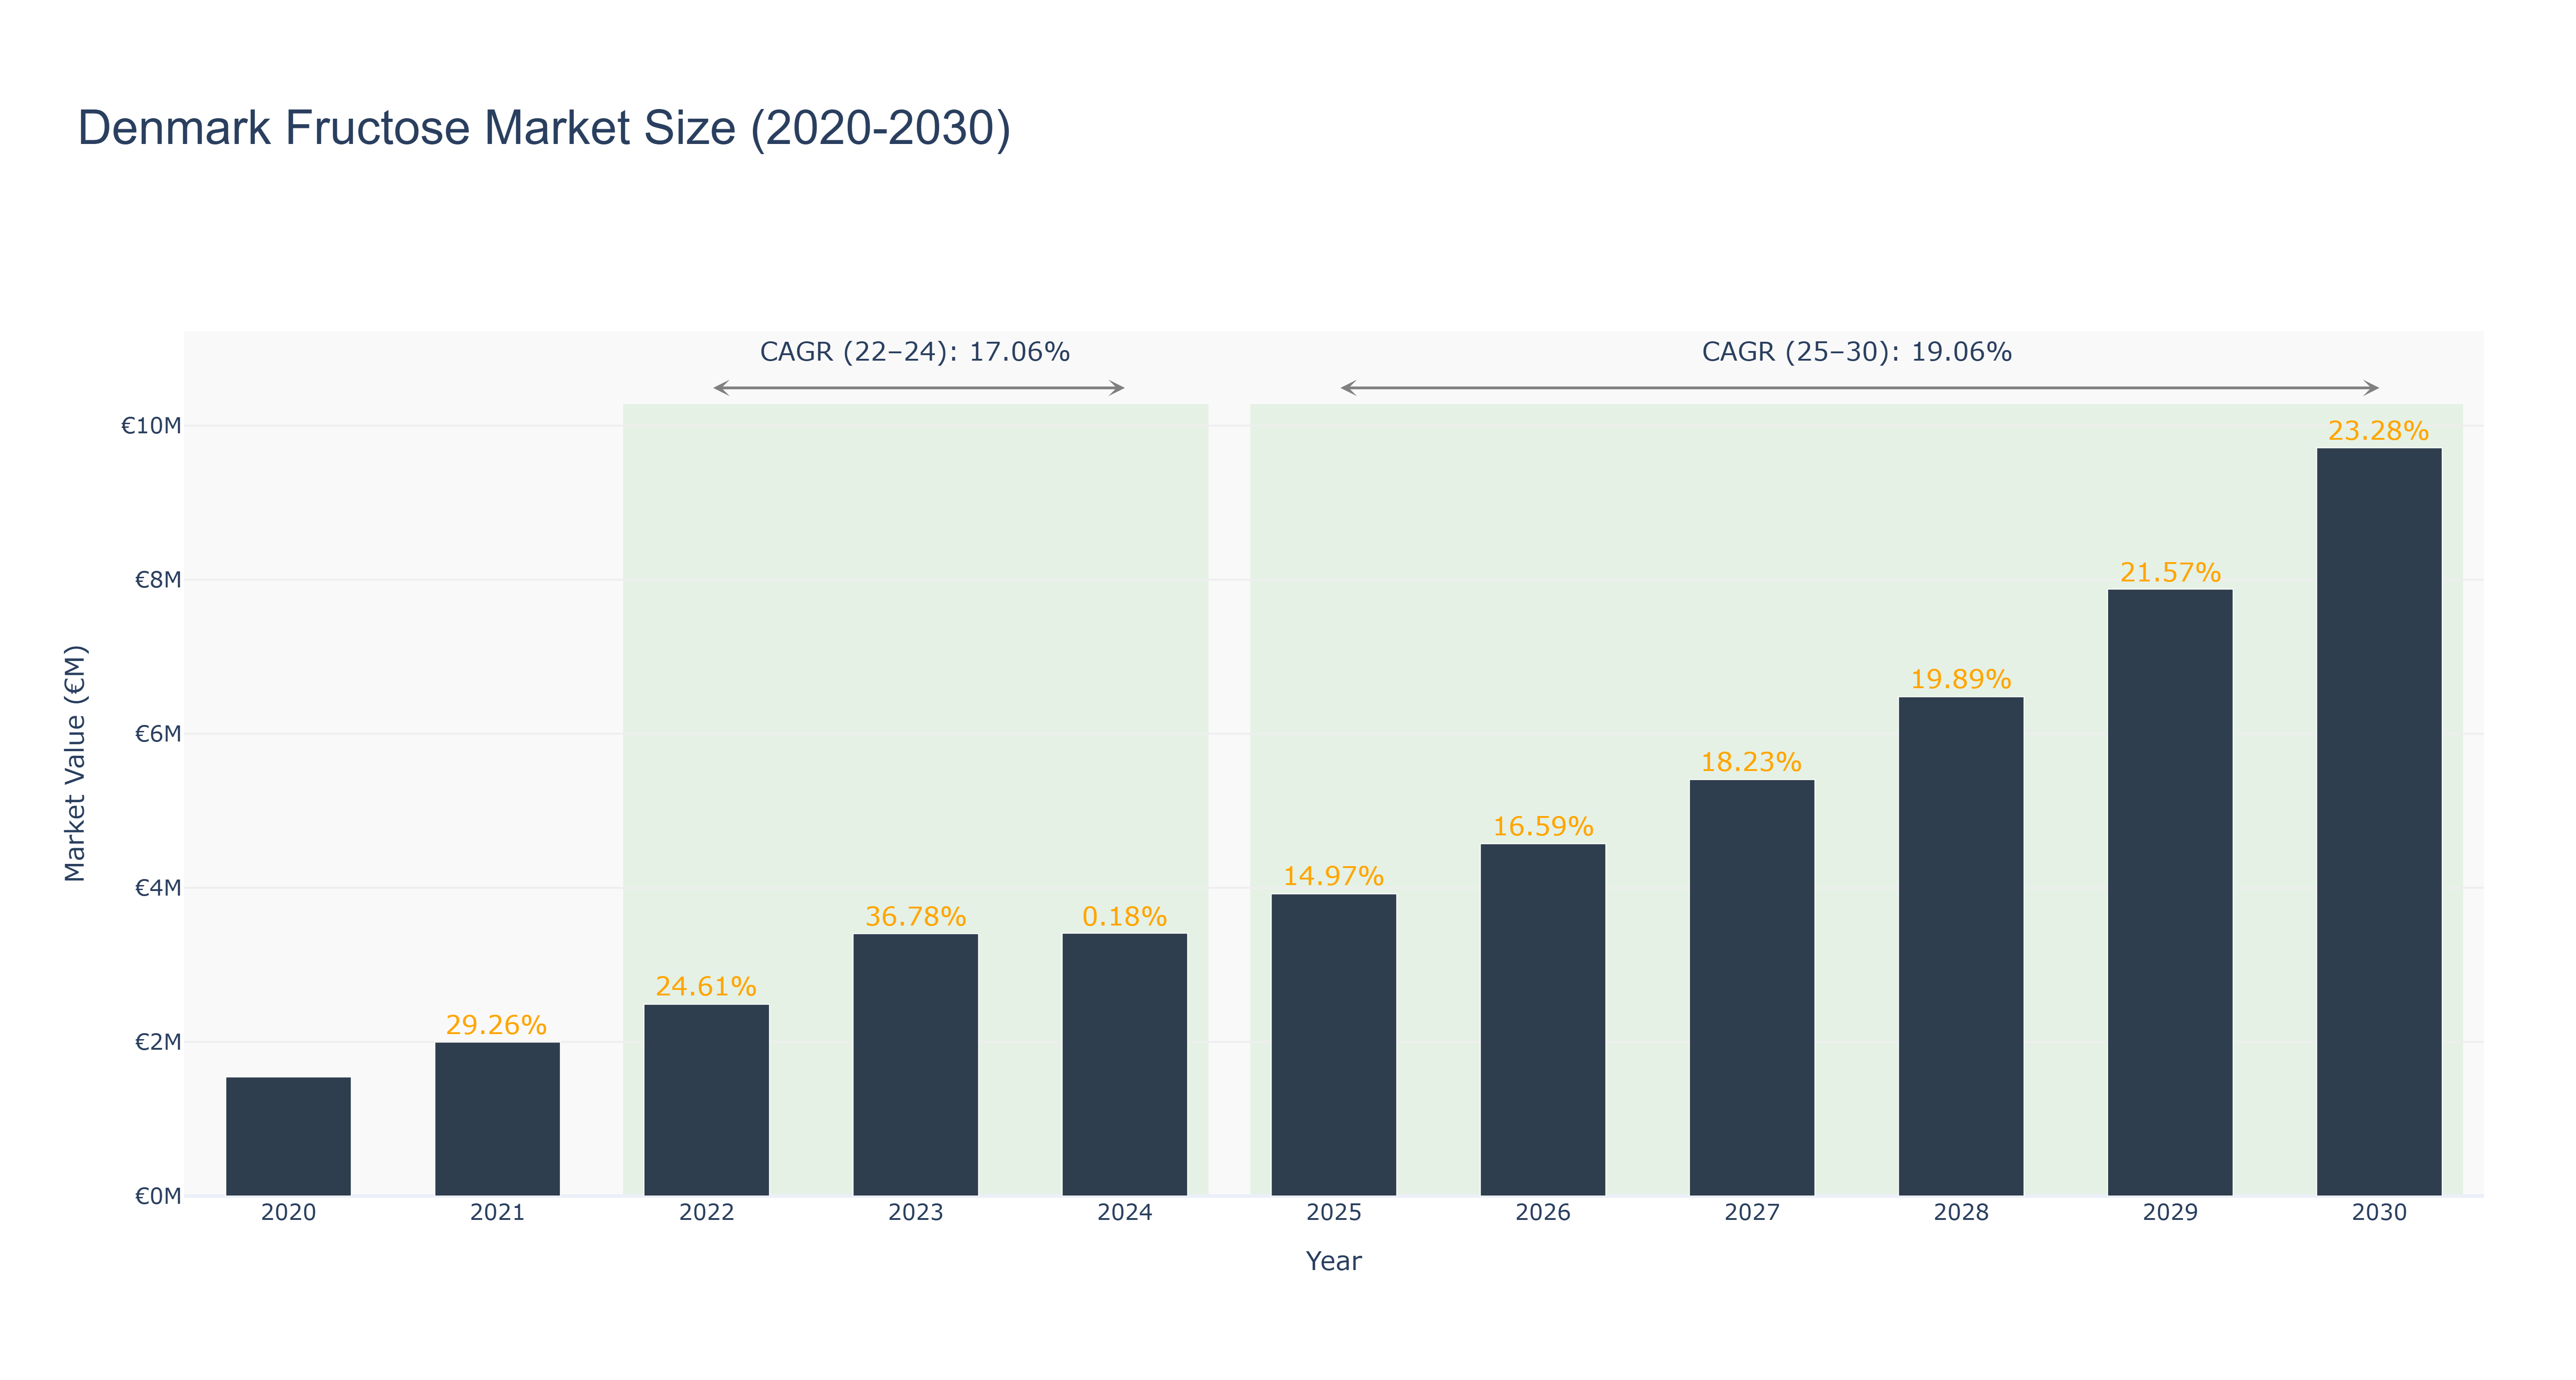
Denmark's Fructose Market has shown a steady growth trajectory over the years. The market size increased from €1.55 million in 2020 to €3.41 million in 2024, experiencing a slight dip in growth rate during that period. However, from 2025 to 2030, the market is forecasted to expand significantly, reaching €9.71 million in 2030 with a CAGR of 19.06%. The CAGR for the period 2022-24 was 17.06%. The market's growth can be attributed to the rising consumer awareness about health benefits associated with fructose consumption and increasing demand for natural sweeteners. Recent developments indicate a focus on innovative product offerings and sustainable sourcing practices, aligning with the market's evolving consumer preferences. Looking ahead, investments in research and development for new fructose-based products are expected to drive further market growth in Denmark.
Denmark Fructose Market: Production & Trade Performance (2019-2025)
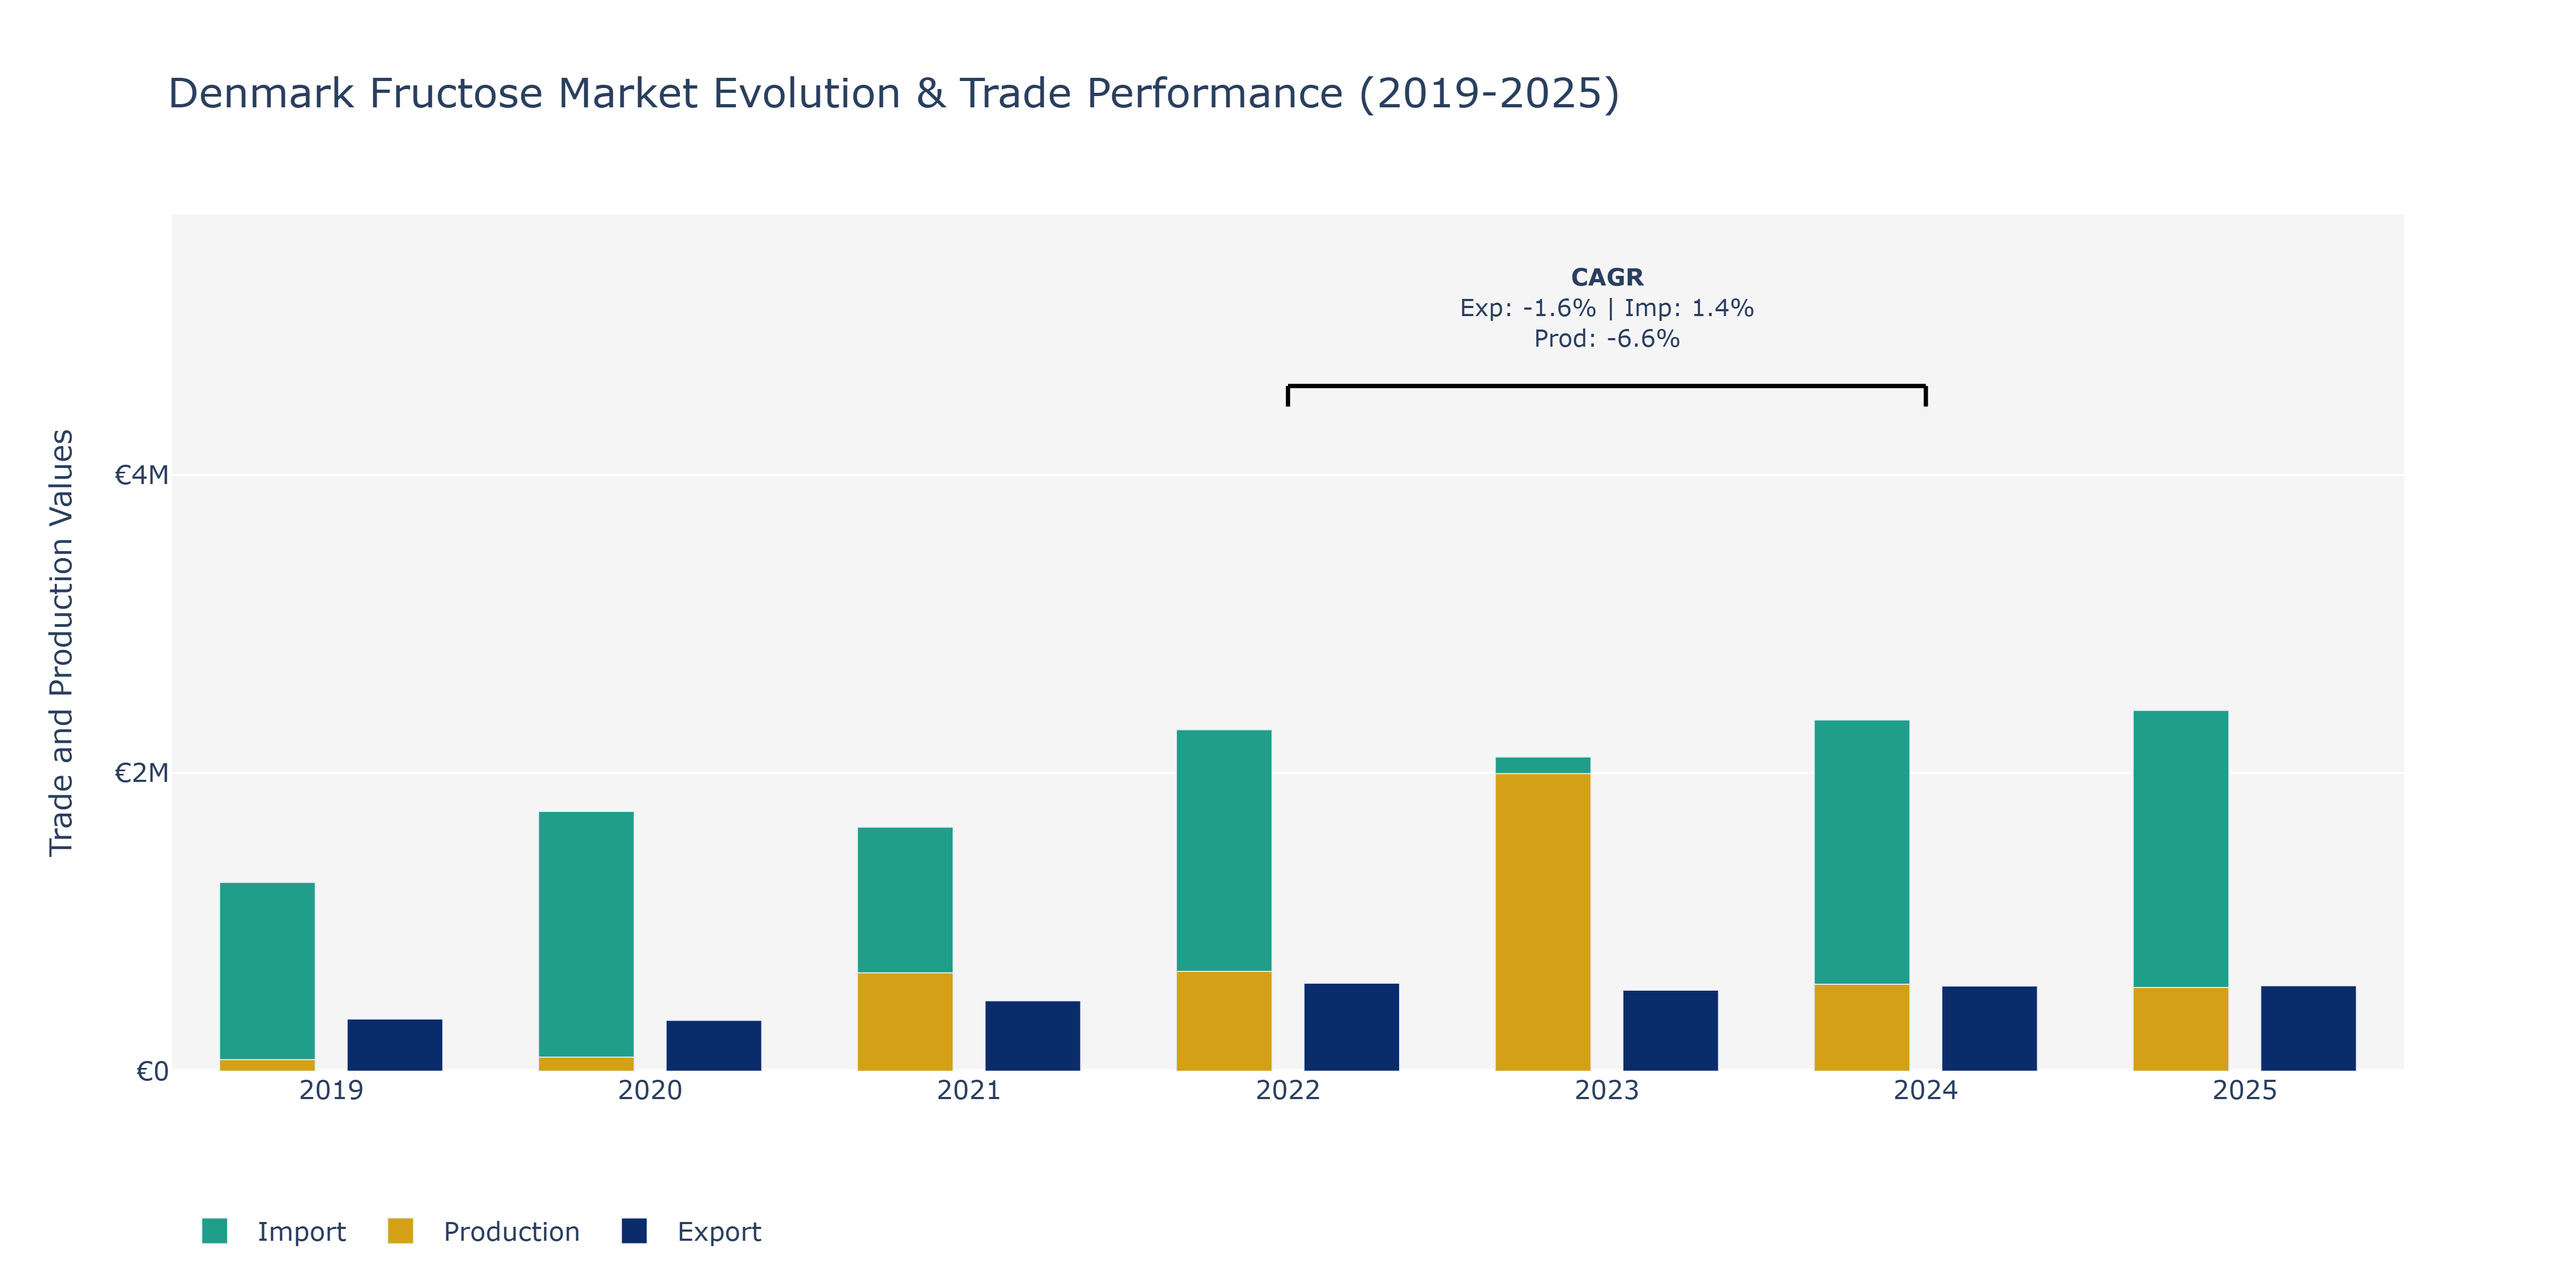
Between 2019 and 2025, the Denmark Fructose Market experienced various trends in Exports, Imports, and Production. Exports saw fluctuations from €349.81 thousand in 2019 to a peak of €590.77 thousand in 2022 before stabilizing around €573.39 thousand in 2025. In contrast, Imports consistently increased from €1.27 million in 2019 to €2.42 million in 2025, showing steady growth. Production displayed a decline from €771.49 thousand in 2019 to a low of €583.46 thousand in 2024, followed by a slight recovery to €561.80 thousand in 2025. These movements can be attributed to factors such as changing consumer preferences towards healthier sweeteners, global market demand fluctuations, and advancements in production technologies leading to varying levels of domestic output. The rise in imports could be linked to increased demand for fructose-based products in the food and beverage industry, driving the need for higher imports to meet market needs.
Key Highlights of the Report:
- Denmark Fructose Market Outlook
- Market Size of Denmark Fructose Market, 2025
- Forecast of Denmark Fructose Market, 2032
- Historical Data and Forecast of Denmark Fructose Revenues & Volume for the Period 2022 - 2032F
- Denmark Fructose Market Trend Evolution
- Denmark Fructose Market Drivers and Challenges
- Denmark Fructose Price Trends
- Denmark Fructose Porter`s Five Forces
- Denmark Fructose Industry Life Cycle
- Historical Data and Forecast of Denmark Fructose Market Revenues & Volume By Product for the Period 2022 - 2032F
- Historical Data and Forecast of Denmark Fructose Market Revenues & Volume By High Fructose Corn Syrup for the Period 2022 - 2032F
- Historical Data and Forecast of Denmark Fructose Market Revenues & Volume By Fructose Syrups for the Period 2022 - 2032F
- Historical Data and Forecast of Denmark Fructose Market Revenues & Volume By Fructose Solids for the Period 2022 - 2032F
- Historical Data and Forecast of Denmark Fructose Market Revenues & Volume By Application for the Period 2022 - 2032F
- Historical Data and Forecast of Denmark Fructose Market Revenues & Volume By Beverages for the Period 2022 - 2032F
- Historical Data and Forecast of Denmark Fructose Market Revenues & Volume By Processed Foods for the Period 2022 - 2032F
- Historical Data and Forecast of Denmark Fructose Market Revenues & Volume By Dairy Products for the Period 2022 - 2032F
- Historical Data and Forecast of Denmark Fructose Market Revenues & Volume By Confectionary for the Period 2022 - 2032F
- Historical Data and Forecast of Denmark Fructose Market Revenues & Volume By Bakery & Cereals for the Period 2022 - 2032F
- Historical Data and Forecast of Denmark Fructose Market Revenues & Volume By Others for the Period 2022 - 2032F
- Denmark Fructose Import Export Trade Statistics
- Market Opportunity Assessment By Product
- Market Opportunity Assessment By Application
- Denmark Fructose Top Companies Market Share
- Denmark Fructose Competitive Benchmarking By Technical and Operational Parameters
- Denmark Fructose Company Profiles
- Denmark Fructose Key Strategic Recommendations
Frequently Asked Questions About the Market Study (FAQs):
6Wresearch actively monitors the Denmark Fructose Market and publishes its comprehensive annual report, highlighting emerging trends, growth drivers, revenue analysis, and forecast outlook. Our insights help businesses to make data-backed strategic decisions with ongoing market dynamics. Our analysts track relevent industries related to the Denmark Fructose Market, allowing our clients with actionable intelligence and reliable forecasts tailored to emerging regional needs.
Yes, we provide customisation as per your requirements. To learn more, feel free to contact us on sales@6wresearch.com
1 Executive Summary |
2 Introduction |
2.1 Key Highlights of the Report |
2.2 Report Description |
2.3 Market Scope & Segmentation |
2.4 Research Methodology |
2.5 Assumptions |
3 Denmark Fructose Market Overview |
3.1 Denmark Country Macro Economic Indicators |
3.2 Denmark Fructose Market Revenues & Volume, 2022 & 2032F |
3.3 Denmark Fructose Market - Industry Life Cycle |
3.4 Denmark Fructose Market - Porter's Five Forces |
3.5 Denmark Fructose Market Revenues & Volume Share, By Product, 2022 & 2032F |
3.6 Denmark Fructose Market Revenues & Volume Share, By Application, 2022 & 2032F |
4 Denmark Fructose Market Dynamics |
4.1 Impact Analysis |
4.2 Market Drivers |
4.2.1 Increasing consumer awareness about health risks associated with high sugar consumption |
4.2.2 Rising demand for natural and clean label ingredients in food and beverages |
4.2.3 Growing preference for low-calorie and sugar-free products |
4.3 Market Restraints |
4.3.1 Stringent regulations and guidelines related to sugar content in food products |
4.3.2 Fluctuating prices of raw materials used in fructose production |
4.3.3 Competition from alternative sweeteners such as stevia and erythritol |
5 Denmark Fructose Market Trends |
6 Denmark Fructose Market Segmentations |
6.1 Denmark Fructose Market, By Product |
6.1.1 Overview and Analysis |
6.1.2 Denmark Fructose Market Revenues & Volume, By High Fructose Corn Syrup, 2022 - 2032F |
6.1.3 Denmark Fructose Market Revenues & Volume, By Fructose Syrups, 2022 - 2032F |
6.1.4 Denmark Fructose Market Revenues & Volume, By Fructose Solids, 2022 - 2032F |
6.2 Denmark Fructose Market, By Application |
6.2.1 Overview and Analysis |
6.2.2 Denmark Fructose Market Revenues & Volume, By Beverages, 2022 - 2032F |
6.2.3 Denmark Fructose Market Revenues & Volume, By Processed Foods, 2022 - 2032F |
6.2.4 Denmark Fructose Market Revenues & Volume, By Dairy Products, 2022 - 2032F |
6.2.5 Denmark Fructose Market Revenues & Volume, By Confectionary, 2022 - 2032F |
6.2.6 Denmark Fructose Market Revenues & Volume, By Bakery & Cereals, 2022 - 2032F |
6.2.7 Denmark Fructose Market Revenues & Volume, By Others, 2022 - 2032F |
7 Denmark Fructose Market Import-Export Trade Statistics |
7.1 Denmark Fructose Market Export to Major Countries |
7.2 Denmark Fructose Market Imports from Major Countries |
8 Denmark Fructose Market Key Performance Indicators |
8.1 Consumer demand for low-sugar or sugar-free products containing fructose |
8.2 Number of new product launches in the fructose market in Denmark |
8.3 Adoption rate of fructose in various food and beverage categories |
9 Denmark Fructose Market - Opportunity Assessment |
9.1 Denmark Fructose Market Opportunity Assessment, By Product, 2022 & 2032F |
9.2 Denmark Fructose Market Opportunity Assessment, By Application, 2022 & 2032F |
10 Denmark Fructose Market - Competitive Landscape |
10.1 Denmark Fructose Market Revenue Share, By Companies, 2025 |
10.2 Denmark Fructose Market Competitive Benchmarking, By Operating and Technical Parameters |
11 Company Profiles |
12 Recommendations | 13 Disclaimer |
Global Go To Market Strategy - 2030
Export potential enables firms to identify high-growth global markets with greater confidence by combining advanced trade intelligence with a structured quantitative methodology. The framework analyzes emerging demand trends and country-level import patterns while integrating macroeconomic and trade datasets such as GDP and population forecasts, bilateral import–export flows, tariff structures, elasticity differentials between developed and developing economies, geographic distance, and import demand projections. Using weighted trade values from 2020–2024 as the base period to project country-to-country export potential for 2030, these inputs are operationalized through calculated drivers such as gravity model parameters, tariff impact factors, and projected GDP per-capita growth. Through an analysis of hidden potentials, demand hotspots, and market conditions that are most favorable to success, this method enables firms to focus on target countries, maximize returns, and global expansion with data, backed by accuracy.
By factoring in the projected importer demand gap that is currently unmet and could be potential opportunity, it identifies the potential for the Exporter (Country) among 190 countries, against the general trade analysis, which identifies the biggest importer or exporter.
To discover high-growth global markets and optimize your business strategy:
Click Here
Pricing
- Single User License$ 1,995
- Department License$ 2,400
- Site License$ 3,120
- Global License$ 3,795

Leadership Perspectives from Industry Events
Search
Thought Leadership and Analyst Meet


Our Clients
6WResearch In News
- Doha a strategic location for EV manufacturing hub: IPA Qatar
- Demand for luxury TVs surging in the GCC, says Samsung
- Empowering Growth: The Thriving Journey of Bangladesh’s Cable Industry
- Demand for luxury TVs surging in the GCC, says Samsung
- Video call with a traditional healer? Once unthinkable, it’s now common in South Africa
- Intelligent Buildings To Smooth GCC’s Path To Net Zero
Latest Reports
- Taiwan Airport Wireless Infrastructure Market (2026-2032)
- Vietnam Airport Wireless Infrastructure Market (2026-2032)
- Thailand Airport Wireless Infrastructure Market (2026-2032)
- South Korea Airport Wireless Infrastructure Market (2026-2032)
- Romania Airport Wireless Infrastructure Market (2026-2032)
- Qatar Airport Wireless Infrastructure Market (2026-2032)
- Philippines Airport Wireless Infrastructure Market (2026-2032)
- Japan Airport Wireless Infrastructure Market (2026-2032)
- Taiwan Airport Winter Services Market (2026-2032)
- Vietnam Airport Winter Services Market (2026-2032)
Industry Events and Analyst Meet

HIMTEX 2026

India Refining Summit 2026

India EV Show 2026

EV tech India Expo 2026

Auto Tech Asia 2026
Whitepaper
- Middle East & Africa Commercial Security Market Click here to view more.
- Middle East & Africa Fire Safety Systems & Equipment Market Click here to view more.
- GCC Drone Market Click here to view more.
- Middle East Lighting Fixture Market Click here to view more.
- GCC Physical & Perimeter Security Market Click here to view more.