Denmark Invert Sugar Market (2026-2032) | Forecast, Segmentation, Industry, Trends, Share, Revenue, Growth, Size, Value, Analysis, Outlook & Companies
Market Forecast By Type (50 percent, 100 percent), By Application (Sweetener, Texturizing agent, Preservative) And Competitive Landscape
| Product Code: ETC4846811 | Publication Date: Nov 2023 | Updated Date: Apr 2026 | Product Type: Market Research Report | |
| Publisher: 6Wresearch | Author: Shubham Padhi | No. of Pages: 60 | No. of Figures: 30 | No. of Tables: 5 |
Denmark Invert Sugar Market Size (2020-2030)
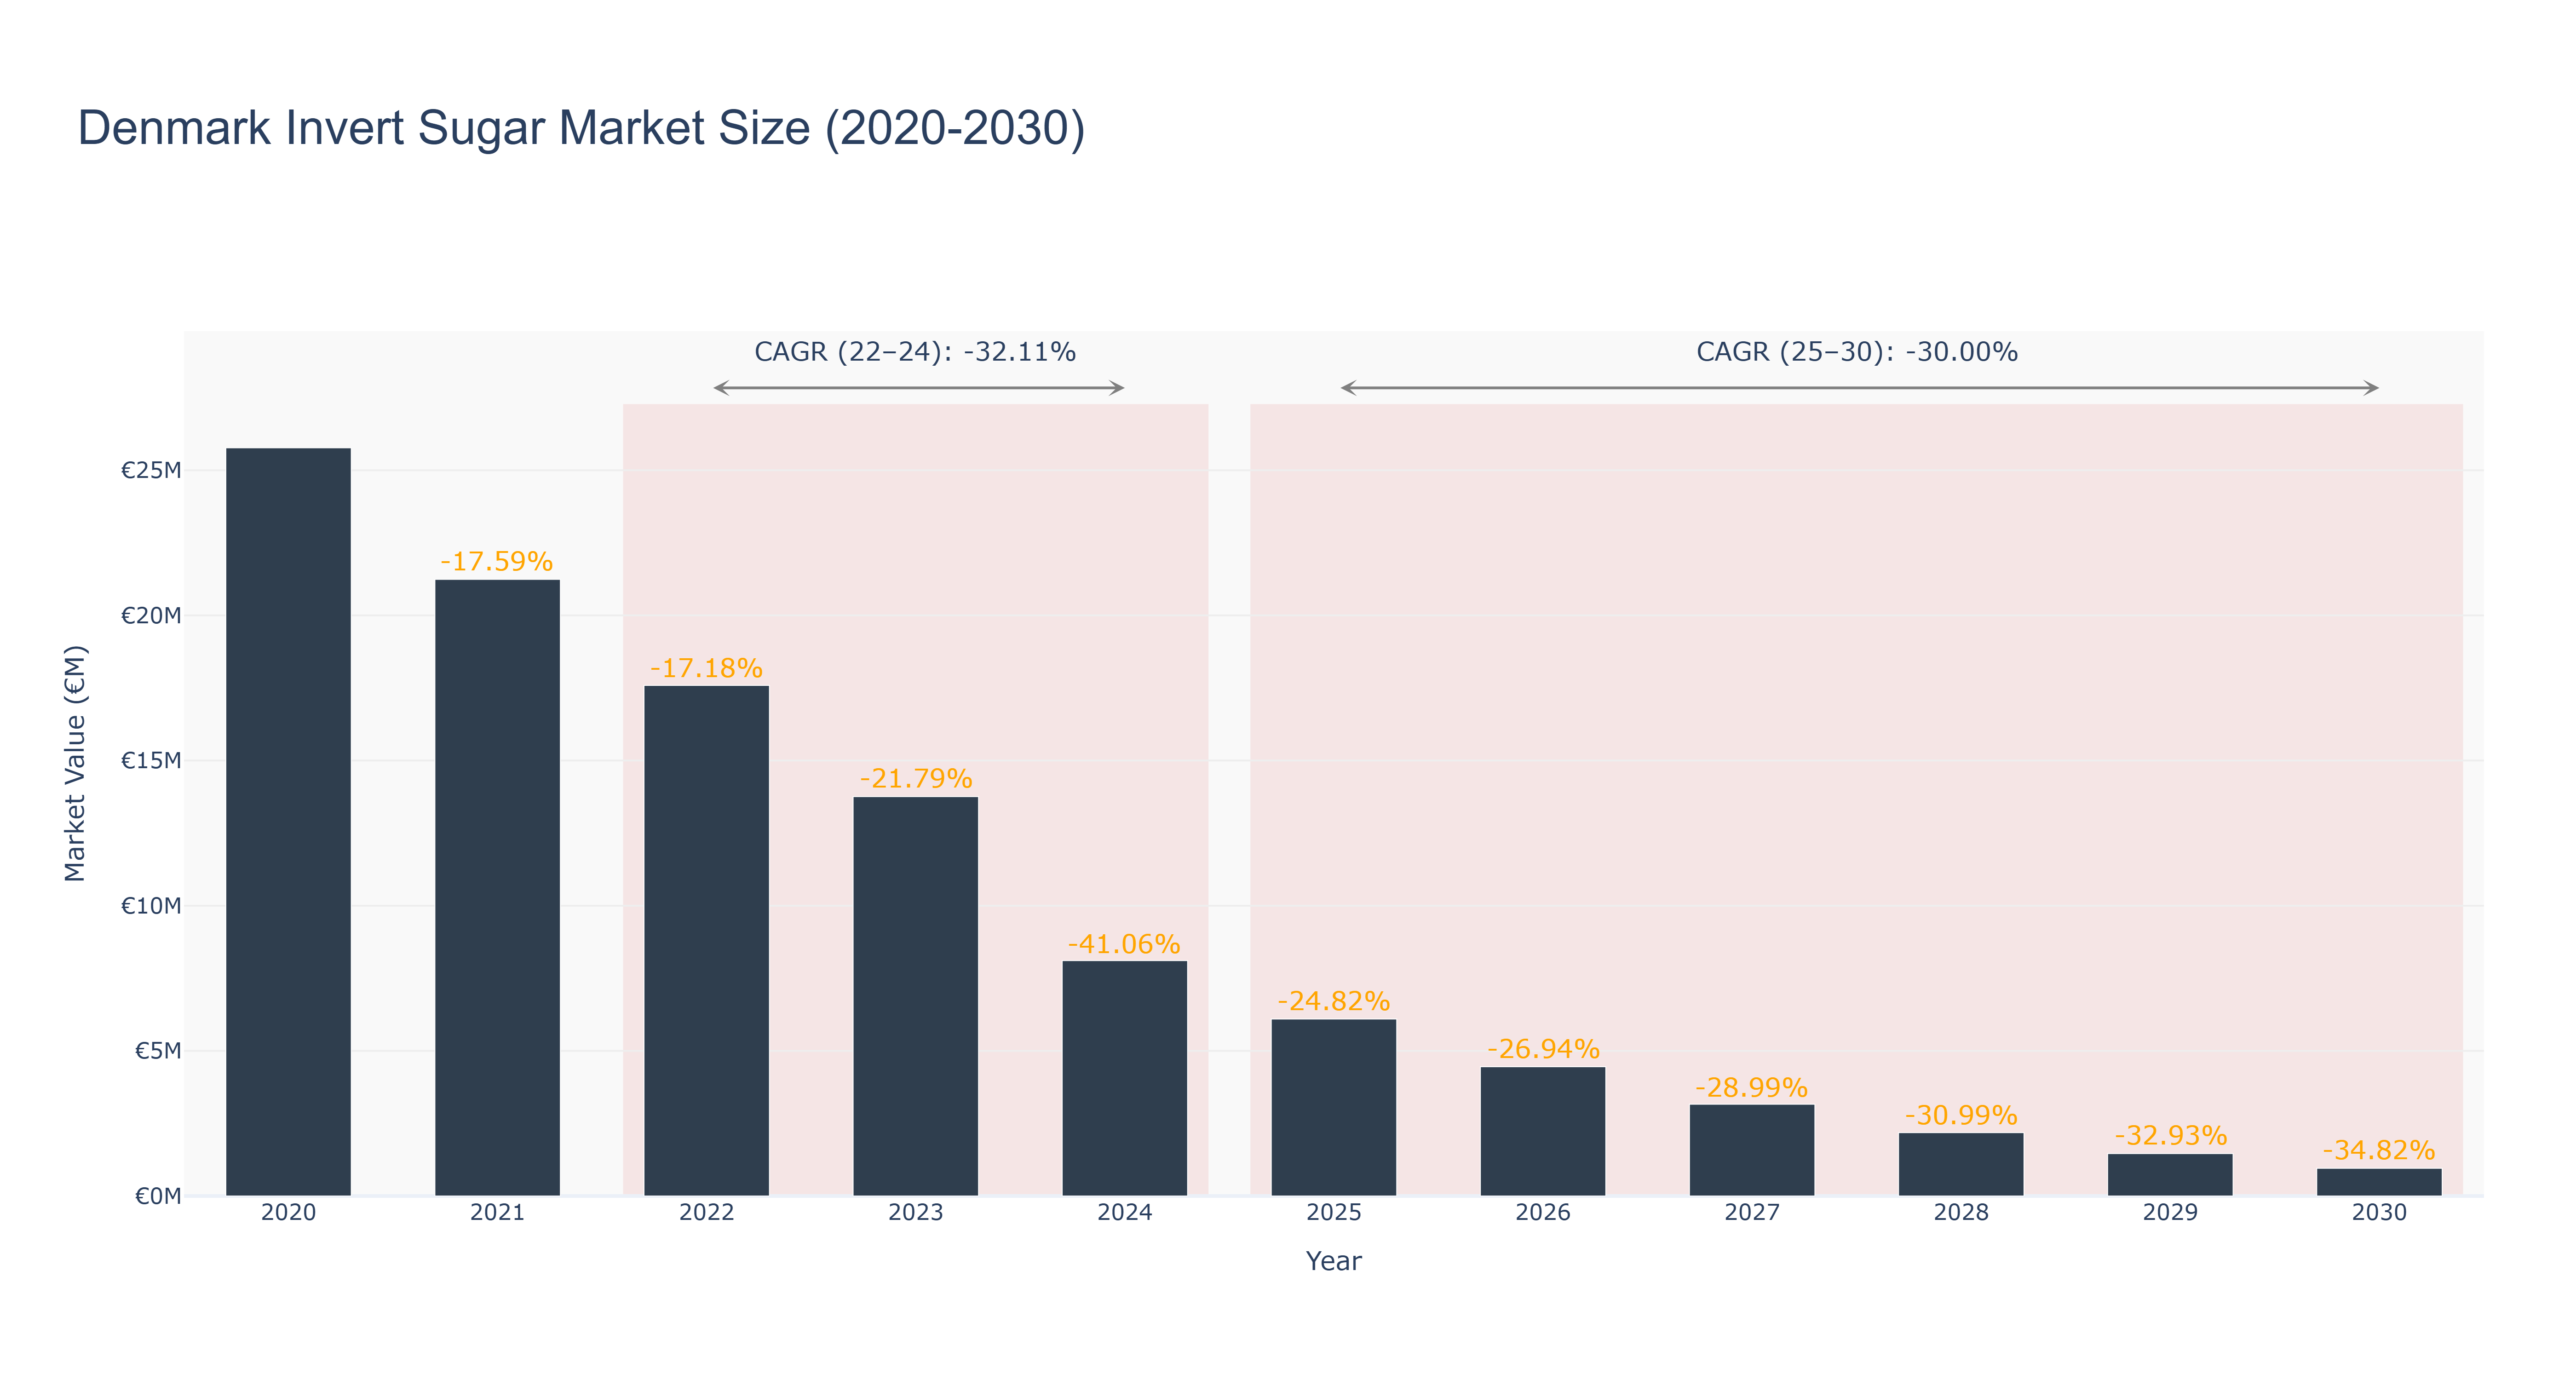
The Denmark Invert Sugar Market experienced its peak in 2020, with a market size of €25.77 million. However, from 2021 to 2024, the market has been on a downward trajectory, with actual sizes decreasing from €21.24 million in 2021 to €8.11 million in 2024, reflecting a substantial CAGR of -32.11% during this period. This decline can be attributed to changing consumer preferences towards healthier alternatives and a reduction in demand from the food and beverage sector. Looking ahead, the forecasted period from 2025 to 2030 indicates a continued contraction, with projected market sizes shrinking from €6.09 million in 2025 to €953.78 thousand by 2030, reflecting a CAGR of -30.00%. The ongoing health trends and competition from alternative sweeteners are likely to drive this decline further, suggesting a challenging environment for the invert sugar segment in Denmark.
Denmark Invert Sugar Market: Production & Trade Performance (2019-2025)
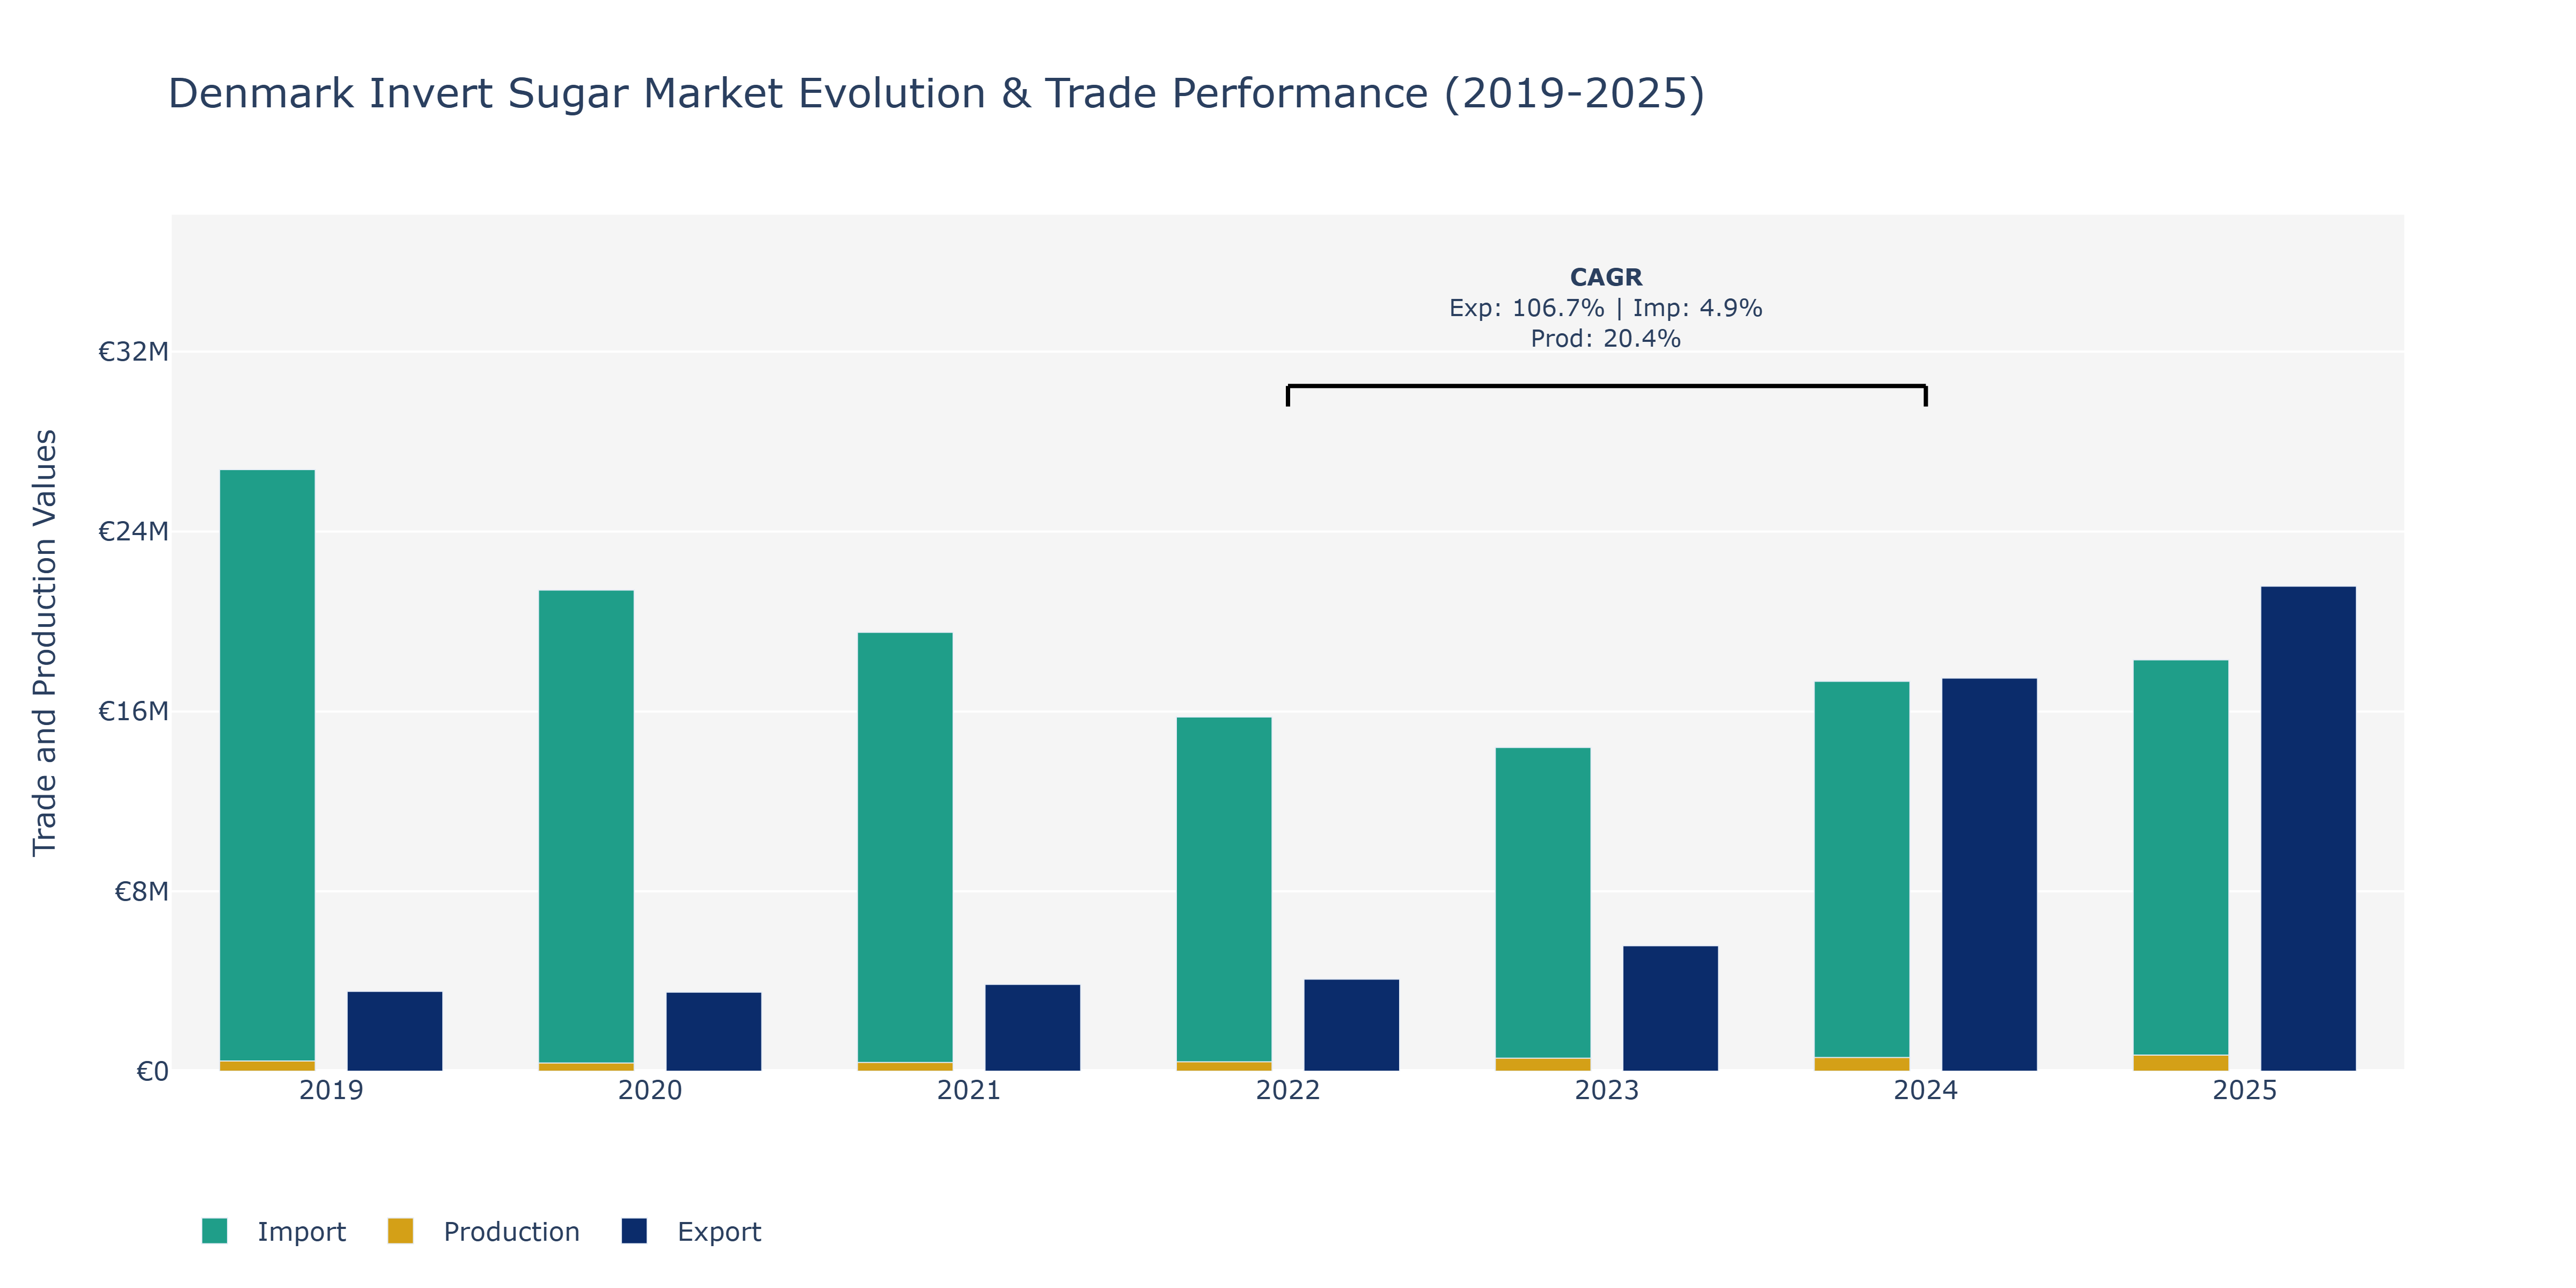
Between 2019 and 2025, Denmark's Invert Sugar market displayed dynamic fluctuations in Exports, Imports, and Production. Exports started at €3.55 million in 2019, steadily increased until 2023, and then saw a substantial surge to €21.57 million in 2025. This remarkable growth can be attributed to increased global demand for invert sugar as a natural sweetener and ingredient in various food products, aligning with the global trend toward healthier alternatives to traditional sugars. In contrast, Imports began at €26.76 million in 2019, declined consistently each year, reaching €18.3 million in 2025. This decline may reflect a shift towards self-sufficiency or a focus on sourcing invert sugar domestically to support local producers. Production, starting at €455 million, showed steady growth each year, reaching €713.39 million in 2025. The growth in Production can be linked to technological advancements, driving efficiency and expanding production capacity to meet the increasing global demand for invert sugar. The CAGR values further emphasize the market's growth trajectory, with Exports demonstrating the highest CAGR, Imports showing a modest increase, and Production maintaining a healthy growth rate within the analyzed period. Overall, Denmark's Invert Sugar market showcases a strong performance driven by evolving consumer preferences and the industry's adaptability to meet changing market demands.
Key Highlights of the Report:
- Denmark Invert Sugar Market Outlook
- Market Size of Denmark Invert Sugar Market, 2025
- Forecast of Denmark Invert Sugar Market, 2032
- Historical Data and Forecast of Denmark Invert Sugar Revenues & Volume for the Period 2022 - 2032F
- Denmark Invert Sugar Market Trend Evolution
- Denmark Invert Sugar Market Drivers and Challenges
- Denmark Invert Sugar Price Trends
- Denmark Invert Sugar Porter`s Five Forces
- Denmark Invert Sugar Industry Life Cycle
- Historical Data and Forecast of Denmark Invert Sugar Market Revenues & Volume By Type for the Period 2022 - 2032F
- Historical Data and Forecast of Denmark Invert Sugar Market Revenues & Volume By 50 percent for the Period 2022 - 2032F
- Historical Data and Forecast of Denmark Invert Sugar Market Revenues & Volume By 100 percent for the Period 2022 - 2032F
- Historical Data and Forecast of Denmark Invert Sugar Market Revenues & Volume By Application for the Period 2022 - 2032F
- Historical Data and Forecast of Denmark Invert Sugar Market Revenues & Volume By Sweetener for the Period 2022 - 2032F
- Historical Data and Forecast of Denmark Invert Sugar Market Revenues & Volume By Texturizing agent for the Period 2022 - 2032F
- Historical Data and Forecast of Denmark Invert Sugar Market Revenues & Volume By Preservative for the Period 2022 - 2032F
- Denmark Invert Sugar Import Export Trade Statistics
- Market Opportunity Assessment By Type
- Market Opportunity Assessment By Application
- Denmark Invert Sugar Top Companies Market Share
- Denmark Invert Sugar Competitive Benchmarking By Technical and Operational Parameters
- Denmark Invert Sugar Company Profiles
- Denmark Invert Sugar Key Strategic Recommendations
Frequently Asked Questions About the Market Study (FAQs):
6Wresearch actively monitors the Denmark Invert Sugar Market and publishes its comprehensive annual report, highlighting emerging trends, growth drivers, revenue analysis, and forecast outlook. Our insights help businesses to make data-backed strategic decisions with ongoing market dynamics. Our analysts track relevent industries related to the Denmark Invert Sugar Market, allowing our clients with actionable intelligence and reliable forecasts tailored to emerging regional needs.
Yes, we provide customisation as per your requirements. To learn more, feel free to contact us on sales@6wresearch.com
1 Executive Summary |
2 Introduction |
2.1 Key Highlights of the Report |
2.2 Report Description |
2.3 Market Scope & Segmentation |
2.4 Research Methodology |
2.5 Assumptions |
3 Denmark Invert Sugar Market Overview |
3.1 Denmark Country Macro Economic Indicators |
3.2 Denmark Invert Sugar Market Revenues & Volume, 2022 & 2032F |
3.3 Denmark Invert Sugar Market - Industry Life Cycle |
3.4 Denmark Invert Sugar Market - Porter's Five Forces |
3.5 Denmark Invert Sugar Market Revenues & Volume Share, By Type, 2022 & 2032F |
3.6 Denmark Invert Sugar Market Revenues & Volume Share, By Application, 2022 & 2032F |
4 Denmark Invert Sugar Market Dynamics |
4.1 Impact Analysis |
4.2 Market Drivers |
4.2.1 Increasing health consciousness leading to a shift towards natural sweeteners |
4.2.2 Growing demand for clean-label and organic products |
4.2.3 Rising awareness about the benefits of invert sugar in food and beverage industry |
4.3 Market Restraints |
4.3.1 Fluctuating prices of raw materials such as sugar beets |
4.3.2 Strict regulations and standards for food additives in Denmark |
4.3.3 Competition from other alternative sweeteners like stevia and agave syrup |
5 Denmark Invert Sugar Market Trends |
6 Denmark Invert Sugar Market Segmentations |
6.1 Denmark Invert Sugar Market, By Type |
6.1.1 Overview and Analysis |
6.1.2 Denmark Invert Sugar Market Revenues & Volume, By 50 percent, 2022 - 2032F |
6.1.3 Denmark Invert Sugar Market Revenues & Volume, By 100 percent, 2022 - 2032F |
6.2 Denmark Invert Sugar Market, By Application |
6.2.1 Overview and Analysis |
6.2.2 Denmark Invert Sugar Market Revenues & Volume, By Sweetener, 2022 - 2032F |
6.2.3 Denmark Invert Sugar Market Revenues & Volume, By Texturizing agent, 2022 - 2032F |
6.2.4 Denmark Invert Sugar Market Revenues & Volume, By Preservative, 2022 - 2032F |
7 Denmark Invert Sugar Market Import-Export Trade Statistics |
7.1 Denmark Invert Sugar Market Export to Major Countries |
7.2 Denmark Invert Sugar Market Imports from Major Countries |
8 Denmark Invert Sugar Market Key Performance Indicators |
8.1 Consumer awareness and perception of invert sugar as a healthier alternative |
8.2 Number of new product launches containing invert sugar |
8.3 Growth in the number of partnerships between invert sugar manufacturers and food/beverage companies |
9 Denmark Invert Sugar Market - Opportunity Assessment |
9.1 Denmark Invert Sugar Market Opportunity Assessment, By Type, 2022 & 2032F |
9.2 Denmark Invert Sugar Market Opportunity Assessment, By Application, 2022 & 2032F |
10 Denmark Invert Sugar Market - Competitive Landscape |
10.1 Denmark Invert Sugar Market Revenue Share, By Companies, 2025 |
10.2 Denmark Invert Sugar Market Competitive Benchmarking, By Operating and Technical Parameters |
11 Company Profiles |
12 Recommendations | 13 Disclaimer |
Global Go To Market Strategy - 2030
Export potential enables firms to identify high-growth global markets with greater confidence by combining advanced trade intelligence with a structured quantitative methodology. The framework analyzes emerging demand trends and country-level import patterns while integrating macroeconomic and trade datasets such as GDP and population forecasts, bilateral import–export flows, tariff structures, elasticity differentials between developed and developing economies, geographic distance, and import demand projections. Using weighted trade values from 2020–2024 as the base period to project country-to-country export potential for 2030, these inputs are operationalized through calculated drivers such as gravity model parameters, tariff impact factors, and projected GDP per-capita growth. Through an analysis of hidden potentials, demand hotspots, and market conditions that are most favorable to success, this method enables firms to focus on target countries, maximize returns, and global expansion with data, backed by accuracy.
By factoring in the projected importer demand gap that is currently unmet and could be potential opportunity, it identifies the potential for the Exporter (Country) among 190 countries, against the general trade analysis, which identifies the biggest importer or exporter.
To discover high-growth global markets and optimize your business strategy:
Click Here
Pricing
- Single User License$ 1,995
- Department License$ 2,400
- Site License$ 3,120
- Global License$ 3,795

Leadership Perspectives from Industry Events
Search
Thought Leadership and Analyst Meet


Our Clients
6WResearch In News
- Doha a strategic location for EV manufacturing hub: IPA Qatar
- Demand for luxury TVs surging in the GCC, says Samsung
- Empowering Growth: The Thriving Journey of Bangladesh’s Cable Industry
- Demand for luxury TVs surging in the GCC, says Samsung
- Video call with a traditional healer? Once unthinkable, it’s now common in South Africa
- Intelligent Buildings To Smooth GCC’s Path To Net Zero
Latest Reports
- Taiwan Airport Wireless Infrastructure Market (2026-2032)
- Vietnam Airport Wireless Infrastructure Market (2026-2032)
- Thailand Airport Wireless Infrastructure Market (2026-2032)
- South Korea Airport Wireless Infrastructure Market (2026-2032)
- Romania Airport Wireless Infrastructure Market (2026-2032)
- Qatar Airport Wireless Infrastructure Market (2026-2032)
- Philippines Airport Wireless Infrastructure Market (2026-2032)
- Japan Airport Wireless Infrastructure Market (2026-2032)
- Taiwan Airport Winter Services Market (2026-2032)
- Vietnam Airport Winter Services Market (2026-2032)
Industry Events and Analyst Meet

HIMTEX 2026

India Refining Summit 2026

India EV Show 2026

EV tech India Expo 2026

Auto Tech Asia 2026
Whitepaper
- Middle East & Africa Commercial Security Market Click here to view more.
- Middle East & Africa Fire Safety Systems & Equipment Market Click here to view more.
- GCC Drone Market Click here to view more.
- Middle East Lighting Fixture Market Click here to view more.
- GCC Physical & Perimeter Security Market Click here to view more.