Denmark Lead Foil Market (2026-2032) | Industry, Revenue, Share, Analysis, Segmentation, Growth, Trends, Size, Outlook, Companies, Forecast & Value
Market Forecast By Types (Thickness: Below 0.1mm, Thickness: 0.1mm-0.5mm, Thickness: 0.5mm-1mm), By Applications (Industrial, Others) And Competitive Landscape
| Product Code: ETC5070783 | Publication Date: Nov 2023 | Updated Date: Apr 2026 | Product Type: Market Research Report | |
| Publisher: 6Wresearch | Author: Shubham Padhi | No. of Pages: 60 | No. of Figures: 30 | No. of Tables: 5 |
Denmark Lead Foil Market Size (2020-2030)
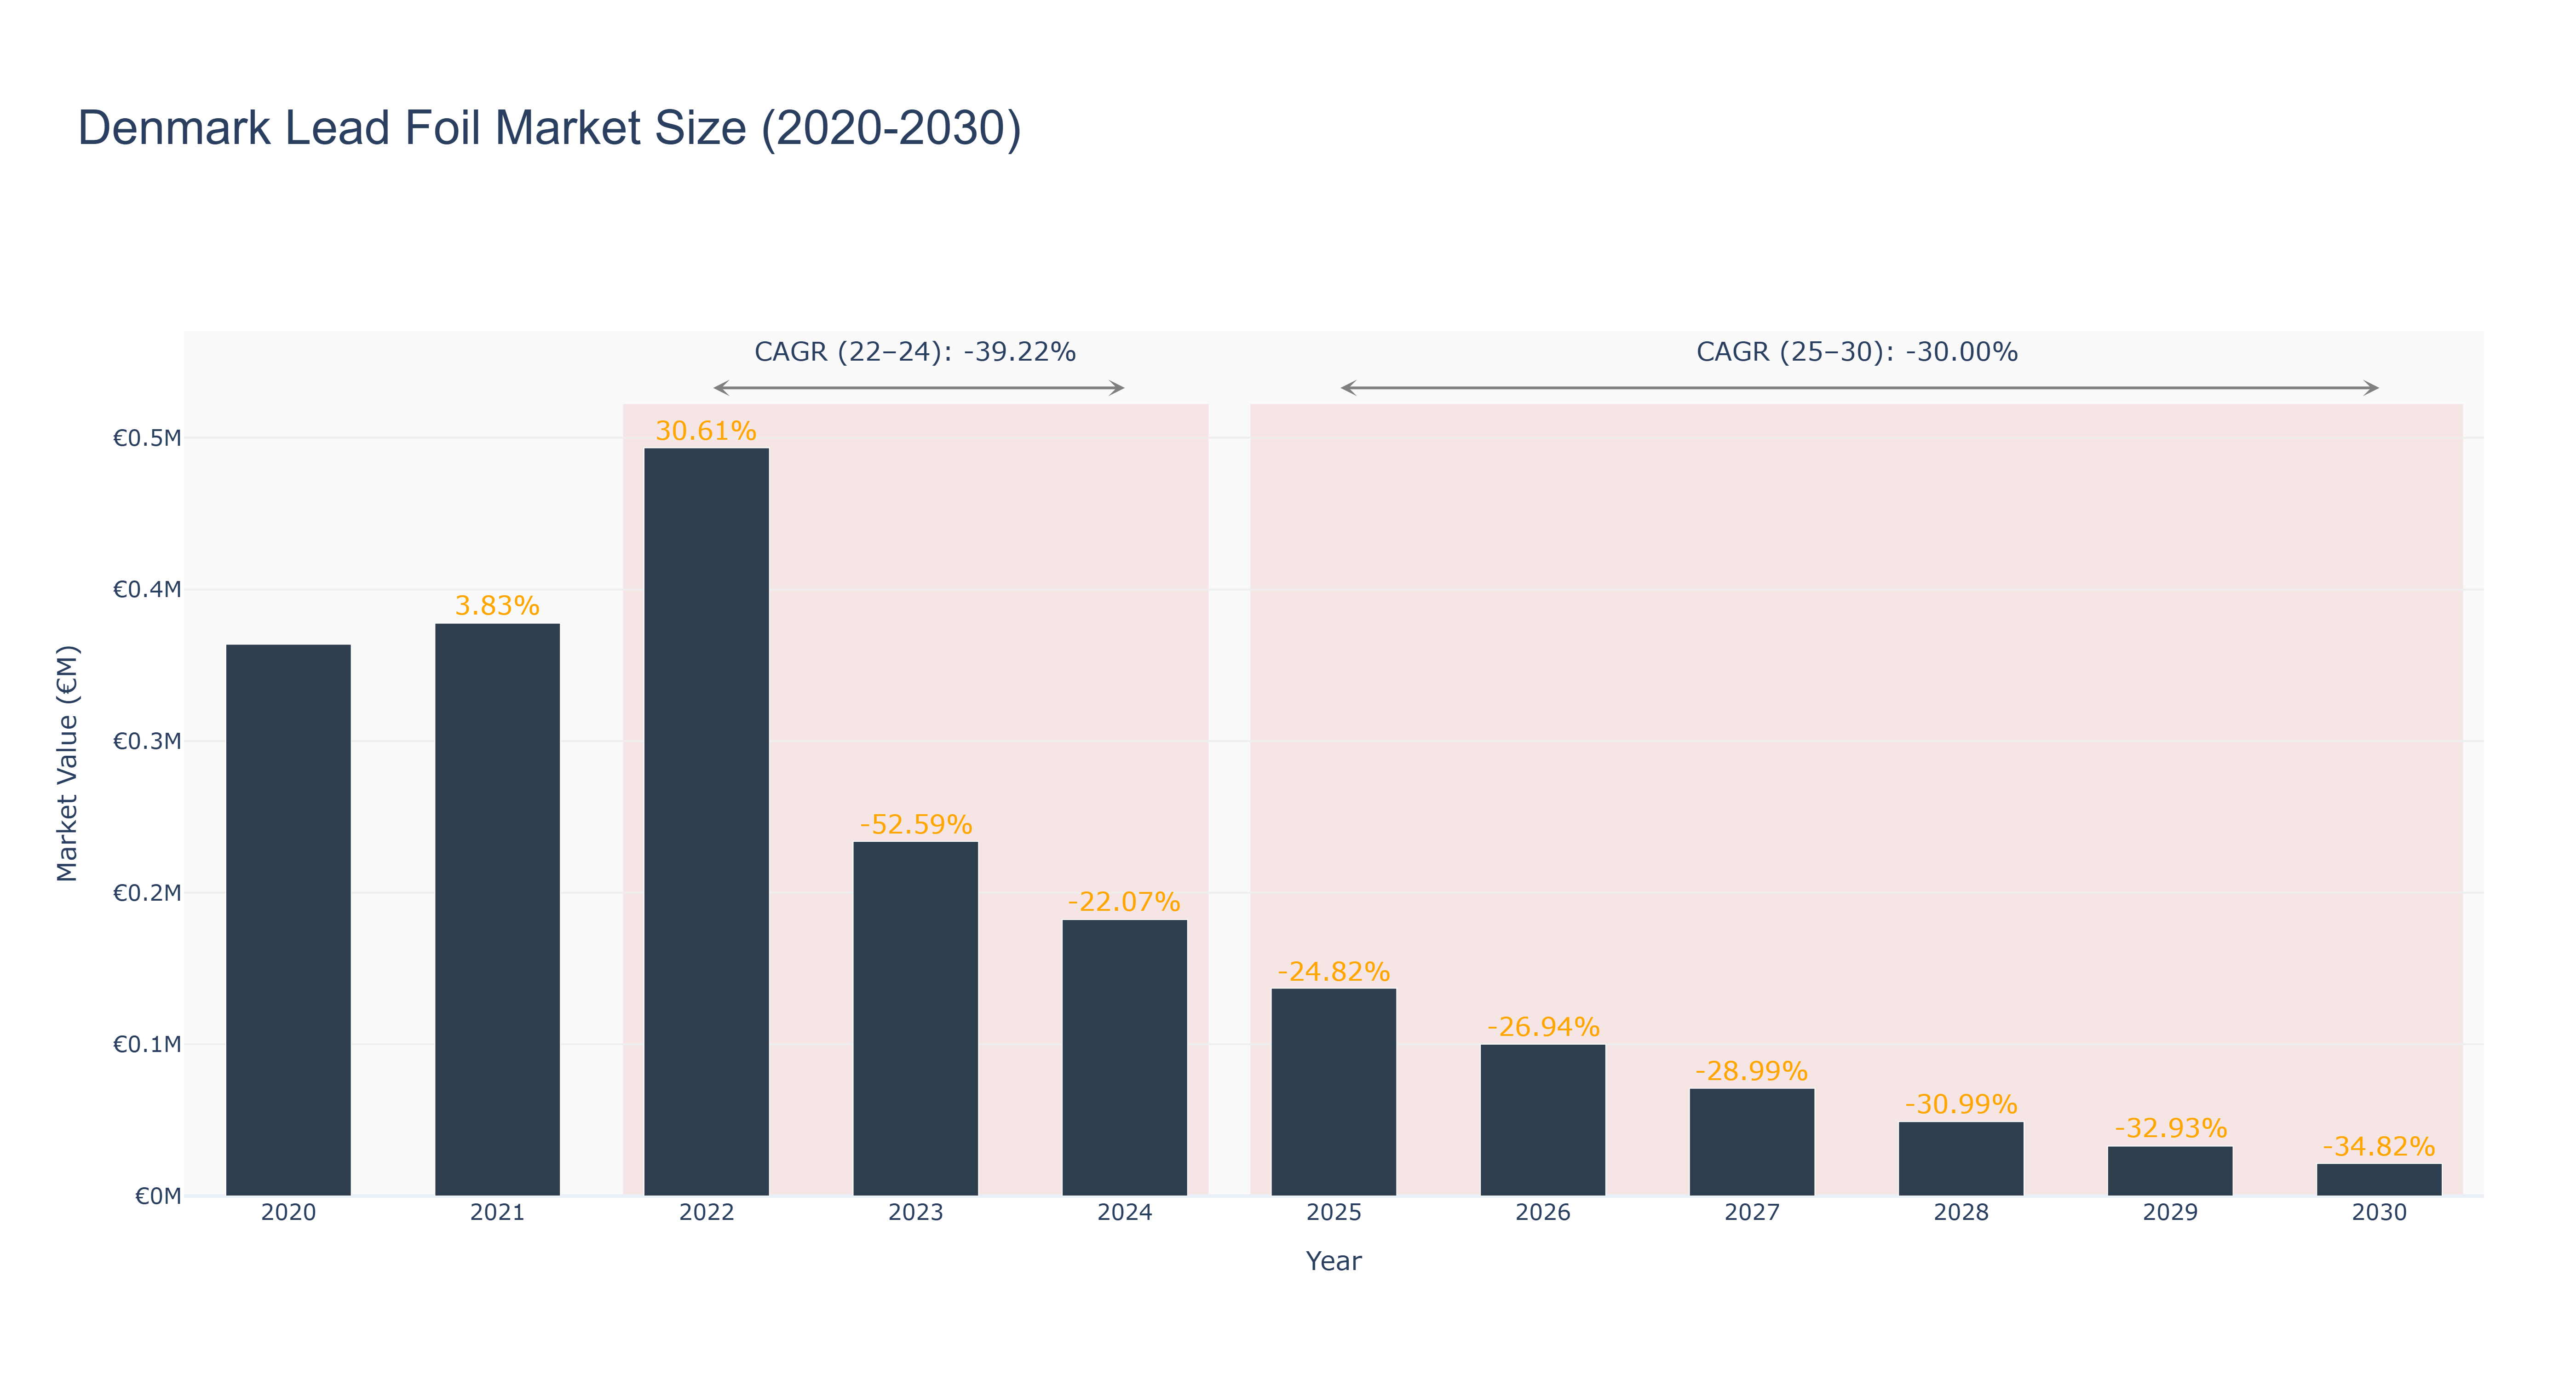
Denmark Lead Foil Market has experienced a significant decline in market size over the years. The peak market size was €0.49 million in 2022, followed by a sharp decrease to €0.14 million in 2025. The market is forecasted to further decrease to €0.02 million by 2030, with a CAGR of -30.0% from 2025 to 2030. The market faced challenges due to factors such as technological advancements in alternative materials, changing consumer preferences, and economic uncertainties. Despite the current downturn, recent developments indicate potential opportunities for growth in the future. One such development is the introduction of sustainable lead foil production methods aimed at reducing environmental impact, which could attract environmentally conscious consumers and drive market recovery in the coming years. Industry drivers for the Denmark Lead Foil Market include increasing demand for eco-friendly packaging solutions, stringent regulations promoting sustainable practices, and advancements in recycling technologies. These factors are expected to shape the market landscape and drive innovation in lead foil production and usage.
Denmark Lead Foil Market: Production & Trade Performance (2019-2025)
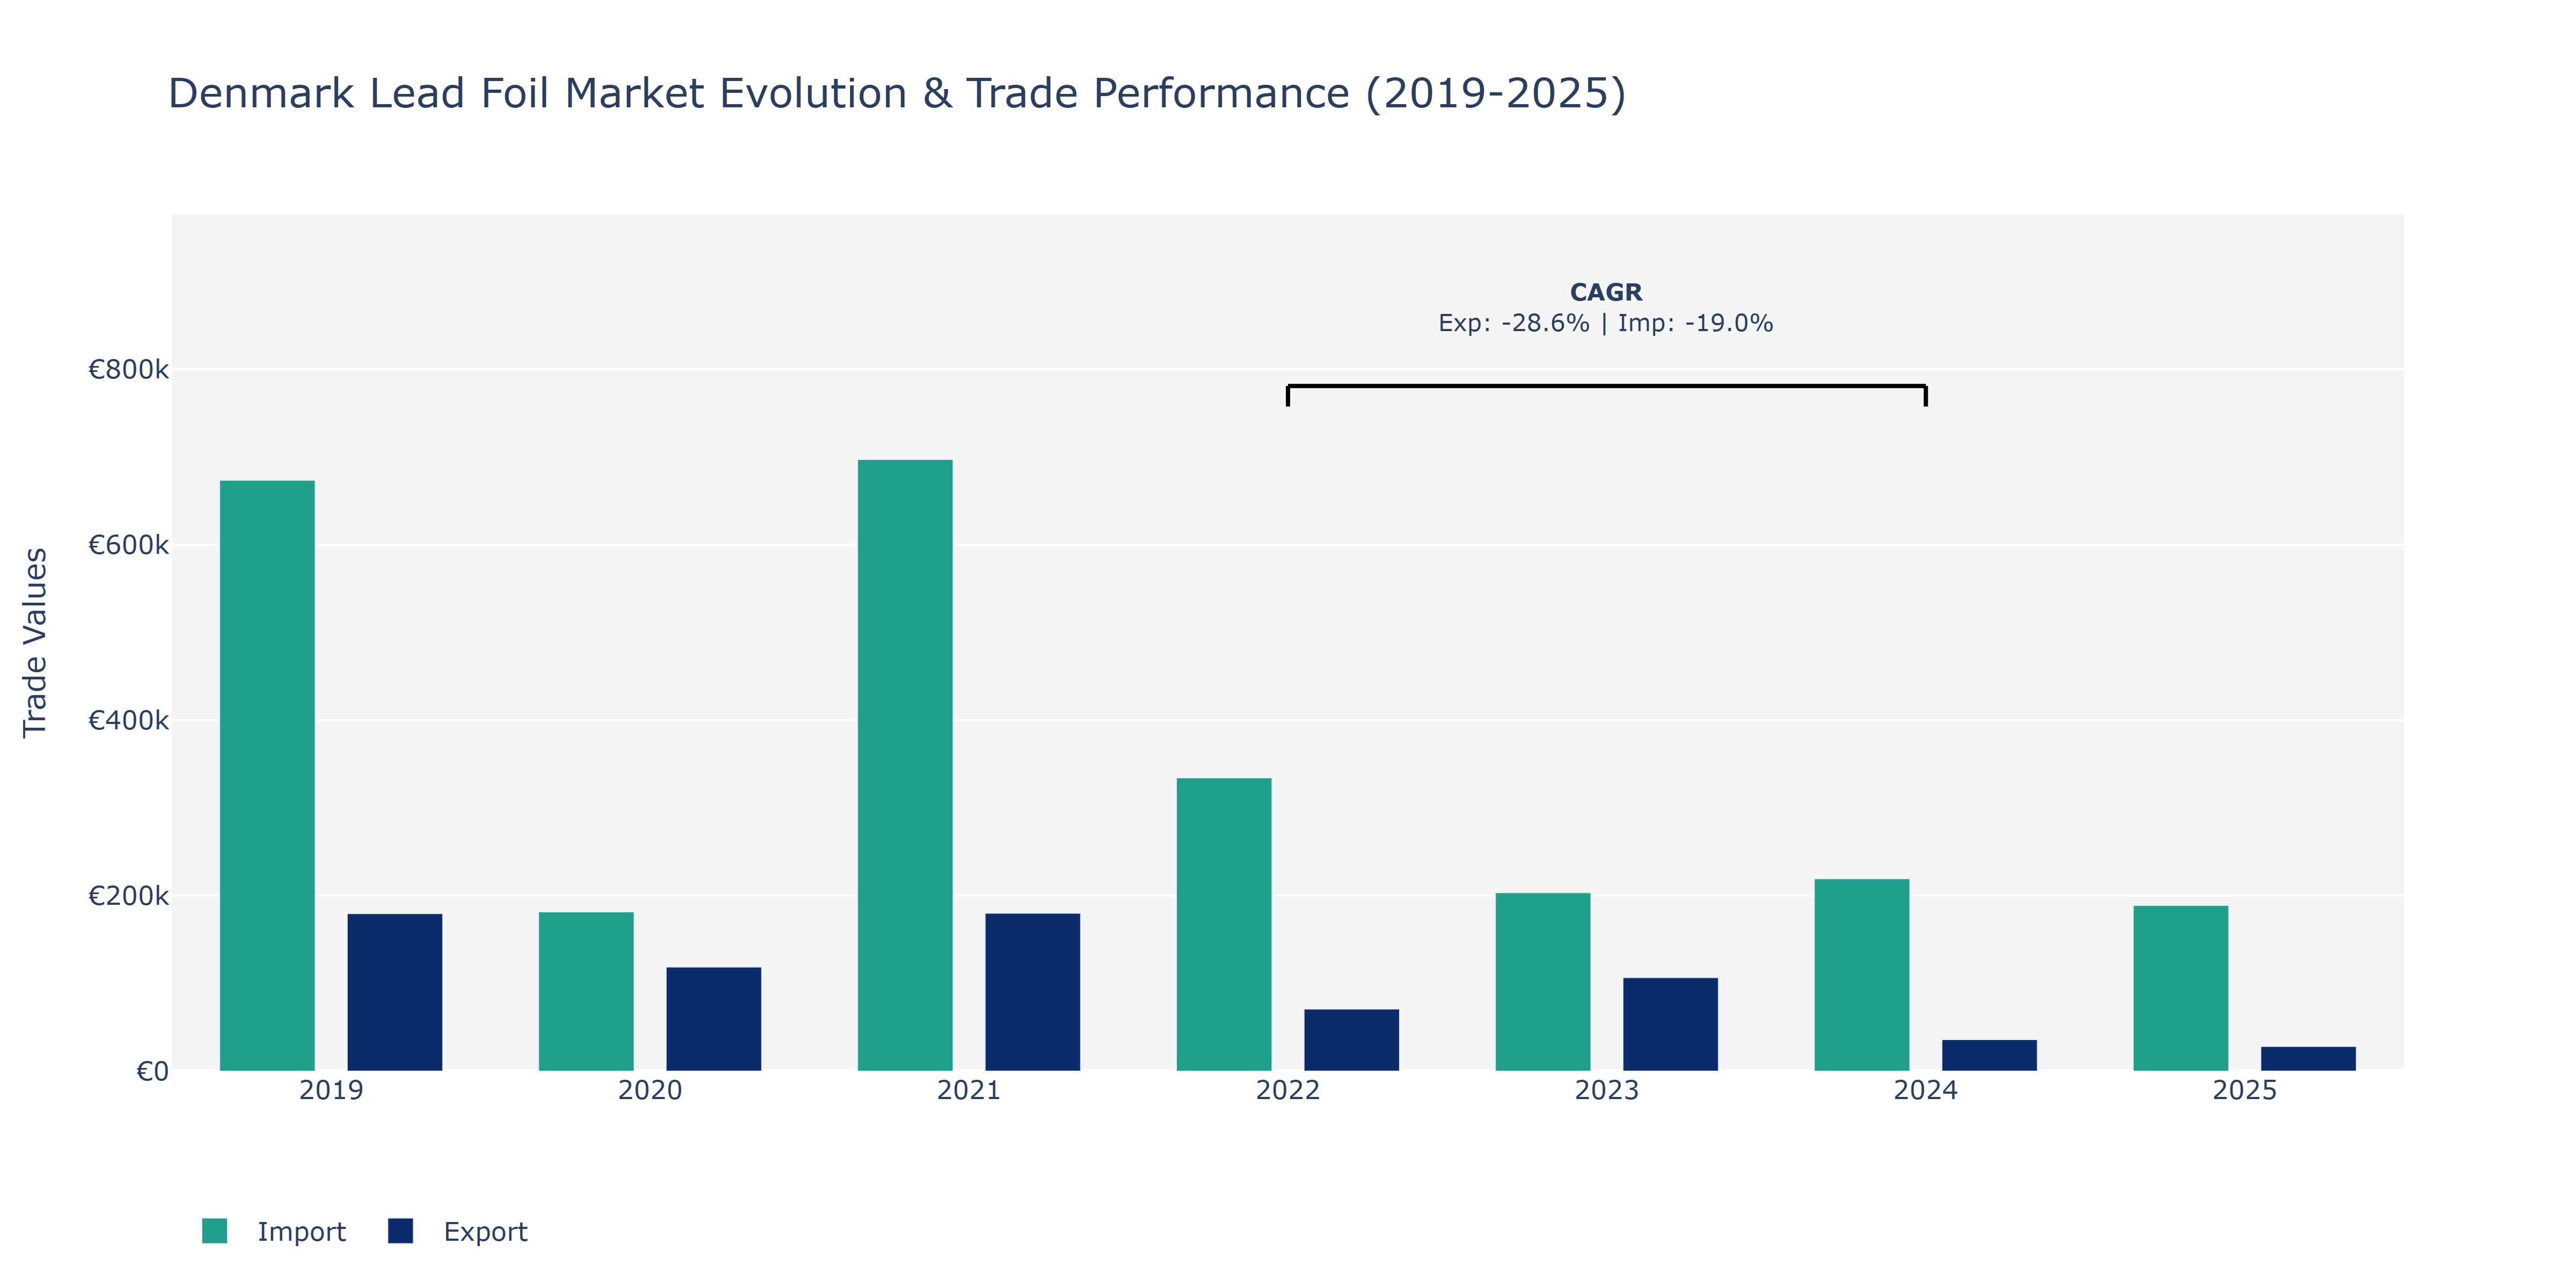
Between 2019 and 2025, the Denmark Lead Foil Market experienced notable fluctuations in both exports and imports. In 2019, imports stood at €673.5 thousand, significantly surpassing exports of €179.61 thousand, indicative of a trade imbalance. The following year, both exports and imports dropped, with exports at €118.87 thousand and imports at €181.66 thousand. However, a recovery was seen in 2021 with exports rebounding to €180.16 thousand and imports reaching €697.2 thousand. The market saw a substantial decrease in 2022, with exports at €70.87 thousand and imports at €334.39 thousand. This decline continued in 2023 and 2024. Reasons for these fluctuations could include global economic conditions impacting demand, local production capacities, and evolving trade policies affecting international transactions. The market may have experienced challenges such as fluctuating raw material costs, changing consumer preferences, or competitive pressures driving these shifts in trade volumes.
Key Highlights of the Report:
- Denmark Lead Foil Market Outlook
- Market Size of Denmark Lead Foil Market, 2025
- Forecast of Denmark Lead Foil Market, 2032
- Historical Data and Forecast of Denmark Lead Foil Revenues & Volume for the Period 2022 - 2032F
- Denmark Lead Foil Market Trend Evolution
- Denmark Lead Foil Market Drivers and Challenges
- Denmark Lead Foil Price Trends
- Denmark Lead Foil Porter`s Five Forces
- Denmark Lead Foil Industry Life Cycle
- Historical Data and Forecast of Denmark Lead Foil Market Revenues & Volume By Types for the Period 2022 - 2032F
- Historical Data and Forecast of Denmark Lead Foil Market Revenues & Volume By Thickness: Below 0.1mm for the Period 2022 - 2032F
- Historical Data and Forecast of Denmark Lead Foil Market Revenues & Volume By Thickness: 0.1mm-0.5mm for the Period 2022 - 2032F
- Historical Data and Forecast of Denmark Lead Foil Market Revenues & Volume By Thickness: 0.5mm-1mm for the Period 2022 - 2032F
- Historical Data and Forecast of Denmark Lead Foil Market Revenues & Volume By Applications for the Period 2022 - 2032F
- Historical Data and Forecast of Denmark Lead Foil Market Revenues & Volume By Industrial for the Period 2022 - 2032F
- Historical Data and Forecast of Denmark Lead Foil Market Revenues & Volume By Others for the Period 2022 - 2032F
- Denmark Lead Foil Import Export Trade Statistics
- Market Opportunity Assessment By Types
- Market Opportunity Assessment By Applications
- Denmark Lead Foil Top Companies Market Share
- Denmark Lead Foil Competitive Benchmarking By Technical and Operational Parameters
- Denmark Lead Foil Company Profiles
- Denmark Lead Foil Key Strategic Recommendations
Frequently Asked Questions About the Market Study (FAQs):
6Wresearch actively monitors the Denmark Lead Foil Market and publishes its comprehensive annual report, highlighting emerging trends, growth drivers, revenue analysis, and forecast outlook. Our insights help businesses to make data-backed strategic decisions with ongoing market dynamics. Our analysts track relevent industries related to the Denmark Lead Foil Market, allowing our clients with actionable intelligence and reliable forecasts tailored to emerging regional needs.
Yes, we provide customisation as per your requirements. To learn more, feel free to contact us on sales@6wresearch.com
1 Executive Summary |
2 Introduction |
2.1 Key Highlights of the Report |
2.2 Report Description |
2.3 Market Scope & Segmentation |
2.4 Research Methodology |
2.5 Assumptions |
3 Denmark Lead Foil Market Overview |
3.1 Denmark Country Macro Economic Indicators |
3.2 Denmark Lead Foil Market Revenues & Volume, 2022 & 2032F |
3.3 Denmark Lead Foil Market - Industry Life Cycle |
3.4 Denmark Lead Foil Market - Porter's Five Forces |
3.5 Denmark Lead Foil Market Revenues & Volume Share Segmentations, 2022 & 2032F |
3.6 Denmark Lead Foil Market Revenues & Volume Share, By Applications, 2022 & 2032F |
4 Denmark Lead Foil Market Dynamics |
4.1 Impact Analysis |
4.2 Market Drivers |
4.2.1 Increasing demand for lead foil in the healthcare sector for radiation protection in diagnostic imaging. |
4.2.2 Growing adoption of lead foil in the construction industry for soundproofing and radiation shielding applications. |
4.2.3 Rising awareness about the benefits of lead foil in preventing contamination in the food and beverage packaging industry. |
4.3 Market Restraints |
4.3.1 Stringent regulations regarding lead content in consumer products may limit the market growth. |
4.3.2 Fluctuating raw material prices of lead could impact the cost of production for lead foil manufacturers. |
4.3.3 Competition from alternative materials such as aluminum and copper for similar applications may pose a challenge. |
5 Denmark Lead Foil Market Trends |
6 Denmark Lead Foil Market Segmentations |
6.1 Denmark Lead Foil Market Segmentations |
6.1.1 Overview and Analysis |
6.1.2 Denmark Lead Foil Market Revenues & Volume, By Thickness: Below 0.1mm, 2022 - 2032F |
6.1.3 Denmark Lead Foil Market Revenues & Volume, By Thickness: 0.1mm-0.5mm, 2022 - 2032F |
6.1.4 Denmark Lead Foil Market Revenues & Volume, By Thickness: 0.5mm-1mm, 2022 - 2032F |
6.2 Denmark Lead Foil Market, By Applications |
6.2.1 Overview and Analysis |
6.2.2 Denmark Lead Foil Market Revenues & Volume, By Industrial, 2022 - 2032F |
6.2.3 Denmark Lead Foil Market Revenues & Volume, By Others, 2022 - 2032F |
7 Denmark Lead Foil Market Import-Export Trade Statistics |
7.1 Denmark Lead Foil Market Export to Major Countries |
7.2 Denmark Lead Foil Market Imports from Major Countries |
8 Denmark Lead Foil Market Key Performance Indicators |
8.1 Adoption rate of lead foil in new application areas. |
8.2 Number of partnerships and collaborations within the lead foil industry. |
8.3 Investment in research and development for lead foil product innovation. |
8.4 Environmental sustainability initiatives in lead foil manufacturing processes. |
9 Denmark Lead Foil Market - Opportunity Assessment |
9.1 Denmark Lead Foil Market Opportunity Assessment Segmentations, 2022 & 2032F |
9.2 Denmark Lead Foil Market Opportunity Assessment, By Applications, 2022 & 2032F |
10 Denmark Lead Foil Market - Competitive Landscape |
10.1 Denmark Lead Foil Market Revenue Share, By Companies, 2025 |
10.2 Denmark Lead Foil Market Competitive Benchmarking, By Operating and Technical Parameters |
11 Company Profiles |
12 Recommendations | 13 Disclaimer |
Global Go To Market Strategy - 2030
Export potential enables firms to identify high-growth global markets with greater confidence by combining advanced trade intelligence with a structured quantitative methodology. The framework analyzes emerging demand trends and country-level import patterns while integrating macroeconomic and trade datasets such as GDP and population forecasts, bilateral import–export flows, tariff structures, elasticity differentials between developed and developing economies, geographic distance, and import demand projections. Using weighted trade values from 2020–2024 as the base period to project country-to-country export potential for 2030, these inputs are operationalized through calculated drivers such as gravity model parameters, tariff impact factors, and projected GDP per-capita growth. Through an analysis of hidden potentials, demand hotspots, and market conditions that are most favorable to success, this method enables firms to focus on target countries, maximize returns, and global expansion with data, backed by accuracy.
By factoring in the projected importer demand gap that is currently unmet and could be potential opportunity, it identifies the potential for the Exporter (Country) among 190 countries, against the general trade analysis, which identifies the biggest importer or exporter.
To discover high-growth global markets and optimize your business strategy:
Click Here
Pricing
- Single User License$ 1,995
- Department License$ 2,400
- Site License$ 3,120
- Global License$ 3,795

Leadership Perspectives from Industry Events
Search
Thought Leadership and Analyst Meet


Our Clients
6WResearch In News
- Doha a strategic location for EV manufacturing hub: IPA Qatar
- Demand for luxury TVs surging in the GCC, says Samsung
- Empowering Growth: The Thriving Journey of Bangladesh’s Cable Industry
- Demand for luxury TVs surging in the GCC, says Samsung
- Video call with a traditional healer? Once unthinkable, it’s now common in South Africa
- Intelligent Buildings To Smooth GCC’s Path To Net Zero
Latest Reports
- Taiwan Airport Wireless Infrastructure Market (2026-2032)
- Vietnam Airport Wireless Infrastructure Market (2026-2032)
- Thailand Airport Wireless Infrastructure Market (2026-2032)
- South Korea Airport Wireless Infrastructure Market (2026-2032)
- Romania Airport Wireless Infrastructure Market (2026-2032)
- Qatar Airport Wireless Infrastructure Market (2026-2032)
- Philippines Airport Wireless Infrastructure Market (2026-2032)
- Japan Airport Wireless Infrastructure Market (2026-2032)
- Taiwan Airport Winter Services Market (2026-2032)
- Vietnam Airport Winter Services Market (2026-2032)
Industry Events and Analyst Meet

HIMTEX 2026

India Refining Summit 2026

India EV Show 2026

EV tech India Expo 2026

Auto Tech Asia 2026
Whitepaper
- Middle East & Africa Commercial Security Market Click here to view more.
- Middle East & Africa Fire Safety Systems & Equipment Market Click here to view more.
- GCC Drone Market Click here to view more.
- Middle East Lighting Fixture Market Click here to view more.
- GCC Physical & Perimeter Security Market Click here to view more.