Denmark Liquid Milk Market (2026-2032) | Share, Segmentation, Analysis, Growth, Value, Size & Revenue, Outlook, Forecast, Industry, Competitive Landscape, Trends, Companies
Market Forecast By Type (Whole Milk, Low-Fat Milk (1%), Reduced-Fat Milk (2%), Skim-Milk, Cultured Buttermilk, Lactose-Free Milk, Others), By Source (Cow Milk, Sheep Milk, Goat Milk, Buffalo Milk, Others), By Application (Fortified Milk, Flavored Dairy Drinks, Yoghurts, Cheese, Creams, Frozen Desserts, Others), By Distribution Channel (Supermarkets and Hypermarkets, Convenience Stores, Specialty Food Stores, Convenience Stores, Online Retail, Others) And Competitive Landscape
| Product Code: ETC6962792 | Publication Date: Sep 2024 | Updated Date: Apr 2026 | Product Type: Market Research Report | |
| Publisher: 6Wresearch | Author: Summon Dutta | No. of Pages: 75 | No. of Figures: 35 | No. of Tables: 20 |
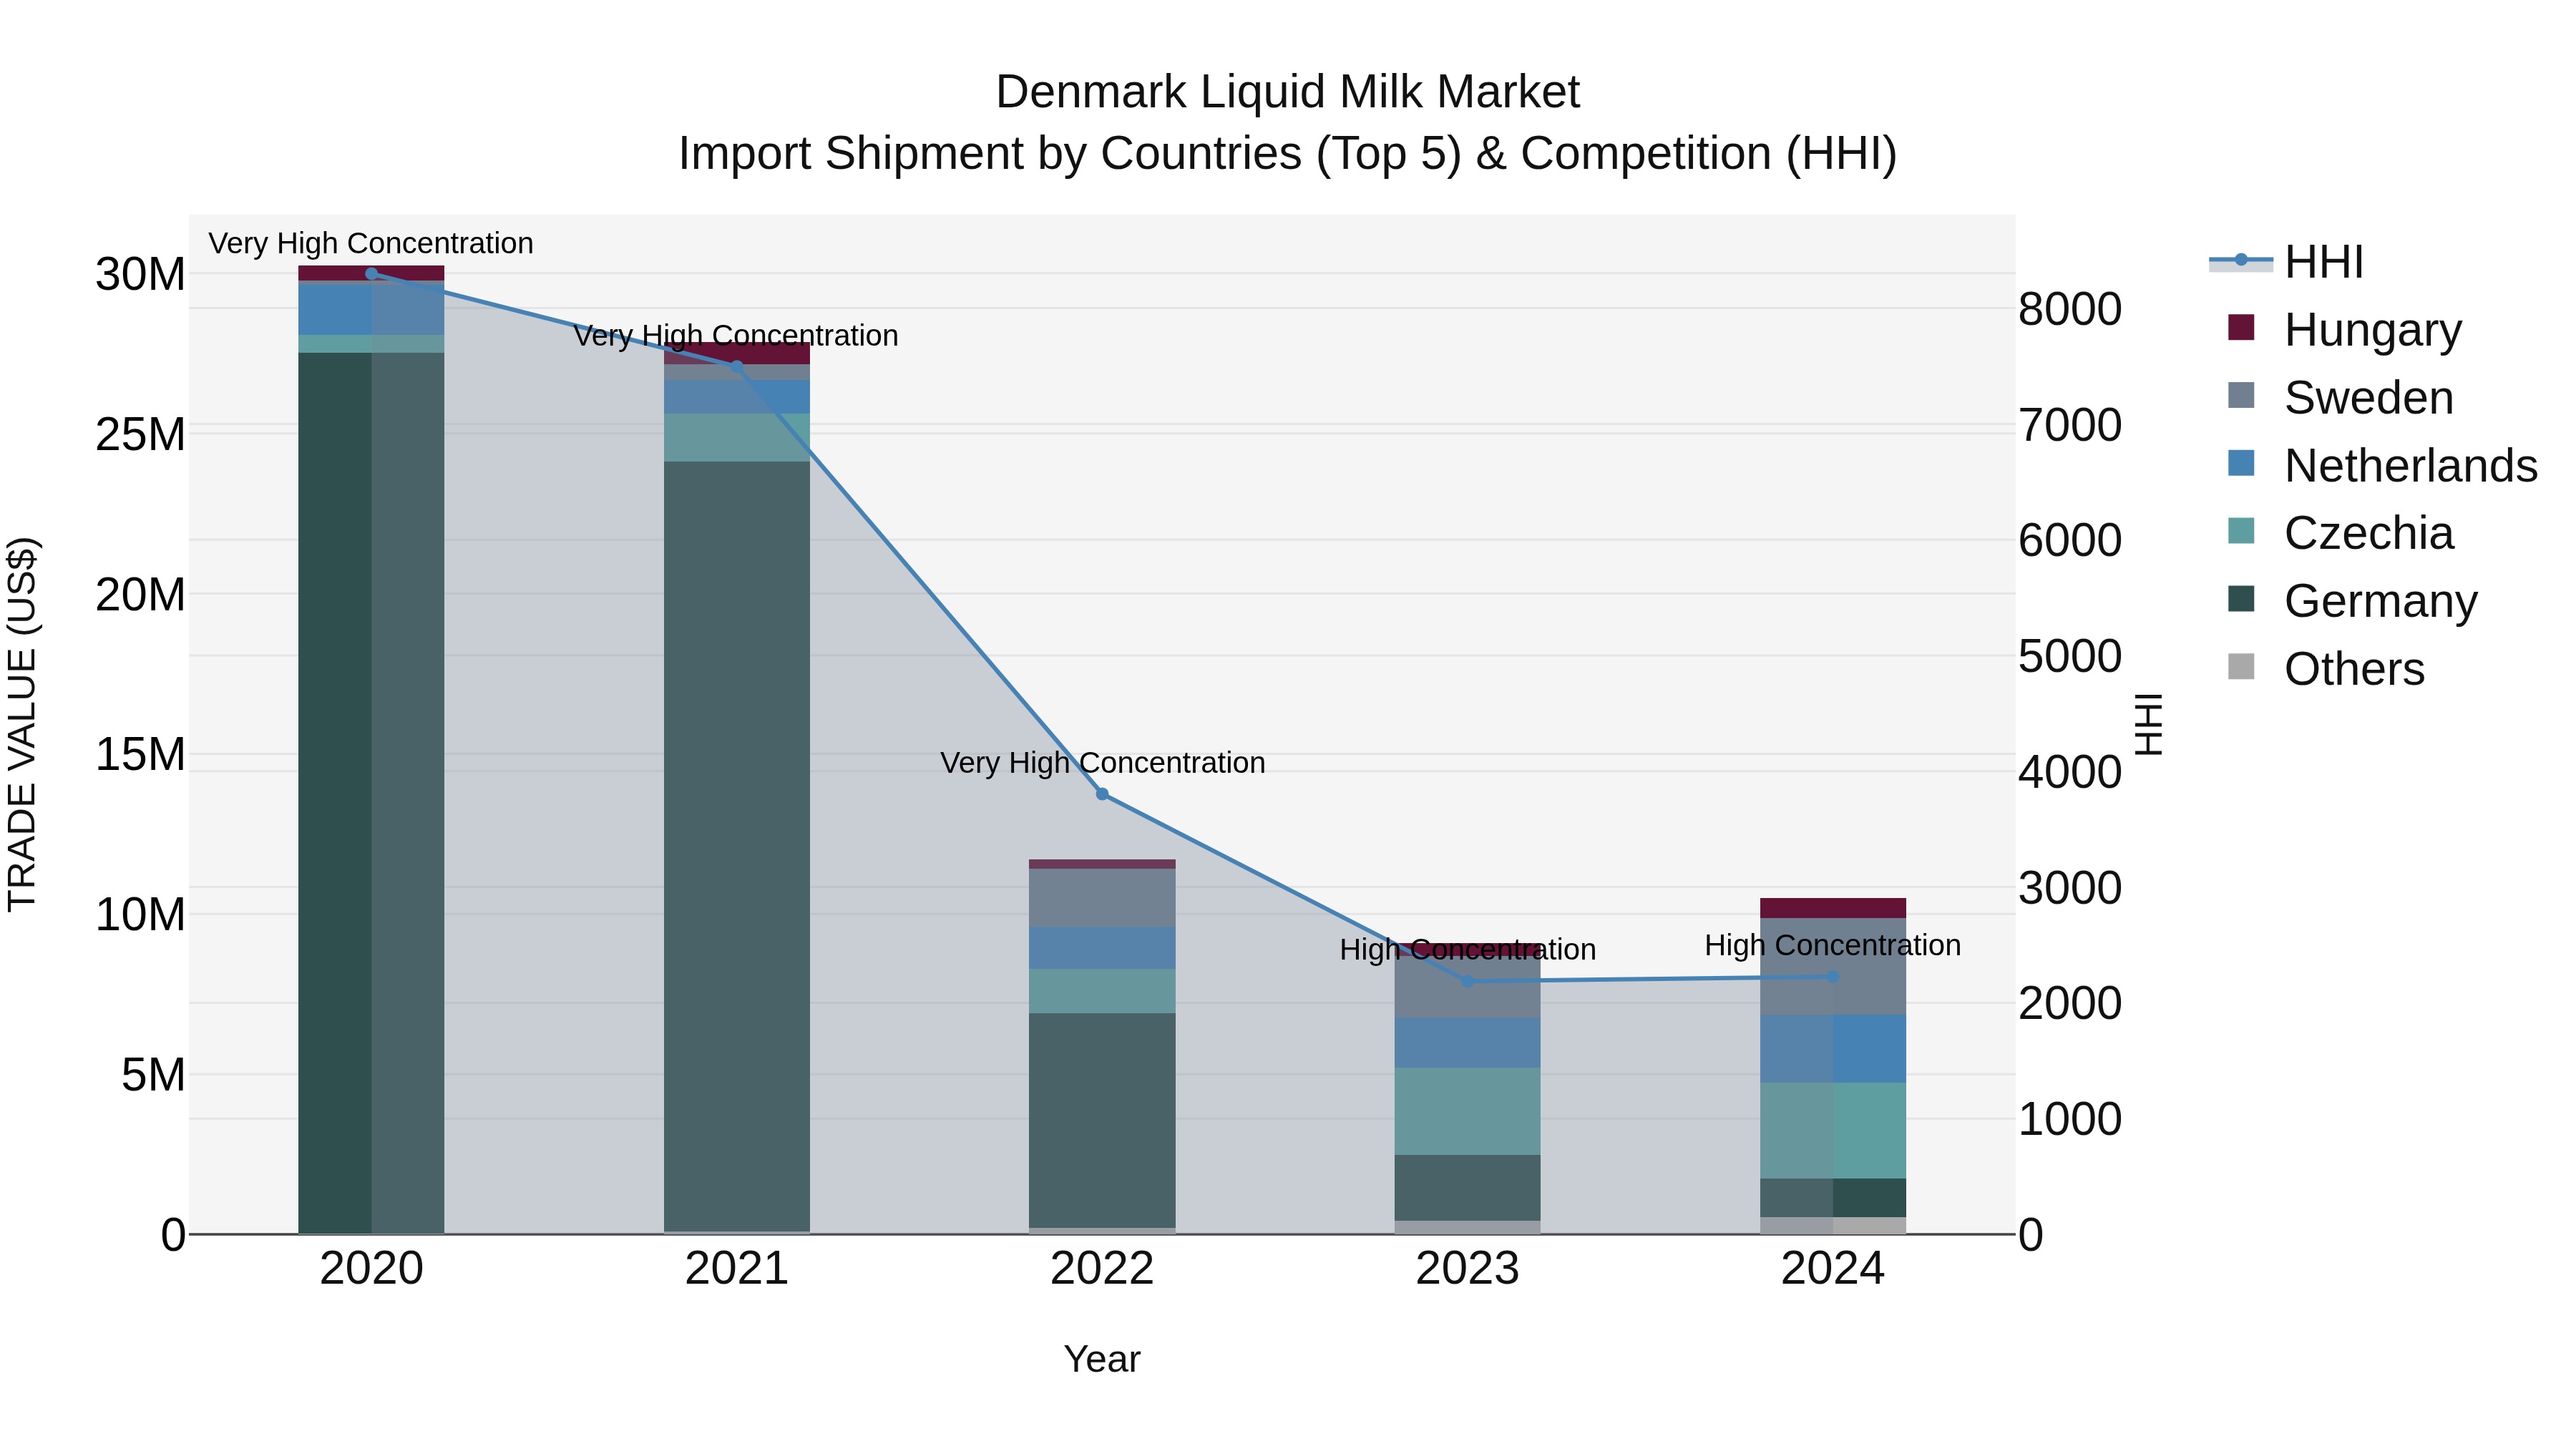
Denmark Liquid Milk Market Top 5 Importing Countries and Market Competition (HHI) Analysis
Denmark liquid milk import market in 2024 continued to be dominated by neighboring countries such as Sweden, Czechia, and the Netherlands, as well as Germany and Hungary. The high Herfindahl-Hirschman Index (HHI) indicates a concentrated market. Despite a negative compound annual growth rate (CAGR) from 2020 to 2024, there was a significant growth spurt in 2024 with a 15.7% increase from the previous year. This suggests that despite challenges in the past, the liquid milk import market in Denmark is showing signs of resilience and potential for growth.
Key Highlights of the Report:
- Denmark Liquid Milk Market Outlook
- Market Size of Denmark Liquid Milk Market, 2025
- Forecast of Denmark Liquid Milk Market, 2032
- Historical Data and Forecast of Denmark Liquid Milk Revenues & Volume for the Period 2022 - 2032
- Denmark Liquid Milk Market Trend Evolution
- Denmark Liquid Milk Market Drivers and Challenges
- Denmark Liquid Milk Price Trends
- Denmark Liquid Milk Porter's Five Forces
- Denmark Liquid Milk Industry Life Cycle
- Historical Data and Forecast of Denmark Liquid Milk Market Revenues & Volume By Type for the Period 2022 - 2032
- Historical Data and Forecast of Denmark Liquid Milk Market Revenues & Volume By Whole Milk for the Period 2022 - 2032
- Historical Data and Forecast of Denmark Liquid Milk Market Revenues & Volume By Low-Fat Milk (1%) for the Period 2022 - 2032
- Historical Data and Forecast of Denmark Liquid Milk Market Revenues & Volume By Reduced-Fat Milk (2%) for the Period 2022 - 2032
- Historical Data and Forecast of Denmark Liquid Milk Market Revenues & Volume By Skim-Milk for the Period 2022 - 2032
- Historical Data and Forecast of Denmark Liquid Milk Market Revenues & Volume By Cultured Buttermilk for the Period 2022 - 2032
- Historical Data and Forecast of Denmark Liquid Milk Market Revenues & Volume By Lactose-Free Milk for the Period 2022 - 2032
- Historical Data and Forecast of Denmark Liquid Milk Market Revenues & Volume By Others for the Period 2022 - 2032
- Historical Data and Forecast of Denmark Liquid Milk Market Revenues & Volume By Source for the Period 2022 - 2032
- Historical Data and Forecast of Denmark Liquid Milk Market Revenues & Volume By Cow Milk for the Period 2022 - 2032
- Historical Data and Forecast of Denmark Liquid Milk Market Revenues & Volume By Sheep Milk for the Period 2022 - 2032
- Historical Data and Forecast of Denmark Liquid Milk Market Revenues & Volume By Goat Milk for the Period 2022 - 2032
- Historical Data and Forecast of Denmark Liquid Milk Market Revenues & Volume By Buffalo Milk for the Period 2022 - 2032
- Historical Data and Forecast of Denmark Liquid Milk Market Revenues & Volume By Others for the Period 2022 - 2032
- Historical Data and Forecast of Denmark Liquid Milk Market Revenues & Volume By Application for the Period 2022 - 2032
- Historical Data and Forecast of Denmark Liquid Milk Market Revenues & Volume By Fortified Milk for the Period 2022 - 2032
- Historical Data and Forecast of Denmark Liquid Milk Market Revenues & Volume By Flavored Dairy Drinks for the Period 2022 - 2032
- Historical Data and Forecast of Denmark Liquid Milk Market Revenues & Volume By Yoghurts for the Period 2022 - 2032
- Historical Data and Forecast of Denmark Liquid Milk Market Revenues & Volume By Cheese for the Period 2022 - 2032
- Historical Data and Forecast of Denmark Liquid Milk Market Revenues & Volume By Creams for the Period 2022 - 2032
- Historical Data and Forecast of Denmark Liquid Milk Market Revenues & Volume By Frozen Desserts for the Period 2022 - 2032
- Historical Data and Forecast of Denmark Liquid Milk Market Revenues & Volume By Others for the Period 2022 - 2032
- Historical Data and Forecast of Denmark Liquid Milk Market Revenues & Volume By Distribution Channel for the Period 2022 - 2032
- Historical Data and Forecast of Denmark Liquid Milk Market Revenues & Volume By Supermarkets and Hypermarkets for the Period 2022 - 2032
- Historical Data and Forecast of Denmark Liquid Milk Market Revenues & Volume By Convenience Stores for the Period 2022 - 2032
- Historical Data and Forecast of Denmark Liquid Milk Market Revenues & Volume By Specialty Food Stores for the Period 2022 - 2032
- Historical Data and Forecast of Denmark Liquid Milk Market Revenues & Volume By Convenience Stores for the Period 2022 - 2032
- Historical Data and Forecast of Denmark Liquid Milk Market Revenues & Volume By Online Retail for the Period 2022 - 2032
- Historical Data and Forecast of Denmark Liquid Milk Market Revenues & Volume By Others for the Period 2022 - 2032
- Denmark Liquid Milk Import Export Trade Statistics
- Market Opportunity Assessment By Type
- Market Opportunity Assessment By Source
- Market Opportunity Assessment By Application
- Market Opportunity Assessment By Distribution Channel
- Denmark Liquid Milk Top Companies Market Share
- Denmark Liquid Milk Competitive Benchmarking By Technical and Operational Parameters
- Denmark Liquid Milk Company Profiles
- Denmark Liquid Milk Key Strategic Recommendations
Frequently Asked Questions About the Market Study (FAQs):
6Wresearch actively monitors the Denmark Liquid Milk Market and publishes its comprehensive annual report, highlighting emerging trends, growth drivers, revenue analysis, and forecast outlook. Our insights help businesses to make data-backed strategic decisions with ongoing market dynamics. Our analysts track relevent industries related to the Denmark Liquid Milk Market, allowing our clients with actionable intelligence and reliable forecasts tailored to emerging regional needs.
Yes, we provide customisation as per your requirements. To learn more, feel free to contact us on sales@6wresearch.com
1 Executive Summary |
2 Introduction |
2.1 Key Highlights of the Report |
2.2 Report Description |
2.3 Market Scope & Segmentation |
2.4 Research Methodology |
2.5 Assumptions |
3 Denmark Liquid Milk Market Overview |
3.1 Denmark Country Macro Economic Indicators |
3.2 Denmark Liquid Milk Market Revenues & Volume, 2022 & 2032F |
3.3 Denmark Liquid Milk Market - Industry Life Cycle |
3.4 Denmark Liquid Milk Market - Porter's Five Forces |
3.5 Denmark Liquid Milk Market Revenues & Volume Share, By Type, 2022 & 2032F |
3.6 Denmark Liquid Milk Market Revenues & Volume Share, By Source, 2022 & 2032F |
3.7 Denmark Liquid Milk Market Revenues & Volume Share, By Application, 2022 & 2032F |
3.8 Denmark Liquid Milk Market Revenues & Volume Share, By Distribution Channel, 2022 & 2032F |
4 Denmark Liquid Milk Market Dynamics |
4.1 Impact Analysis |
4.2 Market Drivers |
4.2.1 Increasing health consciousness among consumers leading to higher demand for nutritious dairy products like liquid milk. |
4.2.2 Growing population and urbanization in Denmark resulting in a larger consumer base for liquid milk products. |
4.2.3 Technological advancements in milk production, processing, and packaging, improving product quality and shelf life. |
4.3 Market Restraints |
4.3.1 Competition from plant-based milk alternatives impacting the market share of liquid milk. |
4.3.2 Fluctuating raw material prices affecting production costs and pricing of liquid milk products. |
4.3.3 Regulatory challenges related to dairy farming practices and environmental sustainability. |
5 Denmark Liquid Milk Market Trends |
6 Denmark Liquid Milk Market, By Types |
6.1 Denmark Liquid Milk Market, By Type |
6.1.1 Overview and Analysis |
6.1.2 Denmark Liquid Milk Market Revenues & Volume, By Type, 2022 - 2032F |
6.1.3 Denmark Liquid Milk Market Revenues & Volume, By Whole Milk, 2022 - 2032F |
6.1.4 Denmark Liquid Milk Market Revenues & Volume, By Low-Fat Milk (1%), 2022 - 2032F |
6.1.5 Denmark Liquid Milk Market Revenues & Volume, By Reduced-Fat Milk (2%), 2022 - 2032F |
6.1.6 Denmark Liquid Milk Market Revenues & Volume, By Skim-Milk, 2022 - 2032F |
6.1.7 Denmark Liquid Milk Market Revenues & Volume, By Cultured Buttermilk, 2022 - 2032F |
6.1.8 Denmark Liquid Milk Market Revenues & Volume, By Lactose-Free Milk, 2022 - 2032F |
6.2 Denmark Liquid Milk Market, By Source |
6.2.1 Overview and Analysis |
6.2.2 Denmark Liquid Milk Market Revenues & Volume, By Cow Milk, 2022 - 2032F |
6.2.3 Denmark Liquid Milk Market Revenues & Volume, By Sheep Milk, 2022 - 2032F |
6.2.4 Denmark Liquid Milk Market Revenues & Volume, By Goat Milk, 2022 - 2032F |
6.2.5 Denmark Liquid Milk Market Revenues & Volume, By Buffalo Milk, 2022 - 2032F |
6.2.6 Denmark Liquid Milk Market Revenues & Volume, By Others, 2022 - 2032F |
6.3 Denmark Liquid Milk Market, By Application |
6.3.1 Overview and Analysis |
6.3.2 Denmark Liquid Milk Market Revenues & Volume, By Fortified Milk, 2022 - 2032F |
6.3.3 Denmark Liquid Milk Market Revenues & Volume, By Flavored Dairy Drinks, 2022 - 2032F |
6.3.4 Denmark Liquid Milk Market Revenues & Volume, By Yoghurts, 2022 - 2032F |
6.3.5 Denmark Liquid Milk Market Revenues & Volume, By Cheese, 2022 - 2032F |
6.3.6 Denmark Liquid Milk Market Revenues & Volume, By Creams, 2022 - 2032F |
6.3.7 Denmark Liquid Milk Market Revenues & Volume, By Frozen Desserts, 2022 - 2032F |
6.4 Denmark Liquid Milk Market, By Distribution Channel |
6.4.1 Overview and Analysis |
6.4.2 Denmark Liquid Milk Market Revenues & Volume, By Supermarkets and Hypermarkets, 2022 - 2032F |
6.4.3 Denmark Liquid Milk Market Revenues & Volume, By Convenience Stores, 2022 - 2032F |
6.4.4 Denmark Liquid Milk Market Revenues & Volume, By Specialty Food Stores, 2022 - 2032F |
6.4.5 Denmark Liquid Milk Market Revenues & Volume, By Convenience Stores, 2022 - 2032F |
6.4.6 Denmark Liquid Milk Market Revenues & Volume, By Online Retail, 2022 - 2032F |
6.4.7 Denmark Liquid Milk Market Revenues & Volume, By Others, 2022 - 2032F |
7 Denmark Liquid Milk Market Import-Export Trade Statistics |
7.1 Denmark Liquid Milk Market Export to Major Countries |
7.2 Denmark Liquid Milk Market Imports from Major Countries |
8 Denmark Liquid Milk Market Key Performance Indicators |
8.1 Consumer perception and demand for organic or sustainable liquid milk products. |
8.2 Adoption rate of innovative packaging solutions for liquid milk. |
8.3 Percentage of repeat purchases or customer loyalty for different liquid milk brands. |
8.4 Environmental impact metrics such as carbon footprint and water usage in liquid milk production. |
8.5 Trends in per capita consumption of liquid milk in different demographics (e.g., age groups, regions). |
9 Denmark Liquid Milk Market - Opportunity Assessment |
9.1 Denmark Liquid Milk Market Opportunity Assessment, By Type, 2022 & 2032F |
9.2 Denmark Liquid Milk Market Opportunity Assessment, By Source, 2022 & 2032F |
9.3 Denmark Liquid Milk Market Opportunity Assessment, By Application, 2022 & 2032F |
9.4 Denmark Liquid Milk Market Opportunity Assessment, By Distribution Channel, 2022 & 2032F |
10 Denmark Liquid Milk Market - Competitive Landscape |
10.1 Denmark Liquid Milk Market Revenue Share, By Companies, 2025 |
10.2 Denmark Liquid Milk Market Competitive Benchmarking, By Operating and Technical Parameters |
11 Company Profiles |
12 Recommendations |
13 Disclaimer |
Global Go To Market Strategy - 2030
Export potential enables firms to identify high-growth global markets with greater confidence by combining advanced trade intelligence with a structured quantitative methodology. The framework analyzes emerging demand trends and country-level import patterns while integrating macroeconomic and trade datasets such as GDP and population forecasts, bilateral import–export flows, tariff structures, elasticity differentials between developed and developing economies, geographic distance, and import demand projections. Using weighted trade values from 2020–2024 as the base period to project country-to-country export potential for 2030, these inputs are operationalized through calculated drivers such as gravity model parameters, tariff impact factors, and projected GDP per-capita growth. Through an analysis of hidden potentials, demand hotspots, and market conditions that are most favorable to success, this method enables firms to focus on target countries, maximize returns, and global expansion with data, backed by accuracy.
By factoring in the projected importer demand gap that is currently unmet and could be potential opportunity, it identifies the potential for the Exporter (Country) among 190 countries, against the general trade analysis, which identifies the biggest importer or exporter.
To discover high-growth global markets and optimize your business strategy:
Click Here
Pricing
- Single User License$ 1,995
- Department License$ 2,400
- Site License$ 3,120
- Global License$ 3,795

Leadership Perspectives from Industry Events
Search
Thought Leadership and Analyst Meet


Our Clients
6WResearch In News
- Doha a strategic location for EV manufacturing hub: IPA Qatar
- Demand for luxury TVs surging in the GCC, says Samsung
- Empowering Growth: The Thriving Journey of Bangladesh’s Cable Industry
- Demand for luxury TVs surging in the GCC, says Samsung
- Video call with a traditional healer? Once unthinkable, it’s now common in South Africa
- Intelligent Buildings To Smooth GCC’s Path To Net Zero
Latest Reports
- Poland Fire Protection Systems Market (2026-2032)
- Cape Verde Portable Hand-Thrown Extinguisher Market (2026-2032)
- Canada Portable Hand-Thrown Extinguisher Market (2026-2032)
- Cameroon Portable Hand-Thrown Extinguisher Market (2026-2032)
- Burundi Portable Hand-Thrown Extinguisher Market (2026-2032)
- Burkina Faso Portable Hand-Thrown Extinguisher Market (2026-2032)
- Bulgaria Portable Hand-Thrown Extinguisher Market (2026-2032)
- Brunei Portable Hand-Thrown Extinguisher Market (2026-2032)
- Botswana Portable Hand-Thrown Extinguisher Market (2026-2032)
- Bosnia and Herzegovina Portable Hand-Thrown Extinguisher Market (2026-2032)
Industry Events and Analyst Meet

HIMTEX 2026

India Refining Summit 2026

India EV Show 2026

EV tech India Expo 2026

Auto Tech Asia 2026
Whitepaper
- Middle East & Africa Commercial Security Market Click here to view more.
- Middle East & Africa Fire Safety Systems & Equipment Market Click here to view more.
- GCC Drone Market Click here to view more.
- Middle East Lighting Fixture Market Click here to view more.
- GCC Physical & Perimeter Security Market Click here to view more.