Denmark Mica Market (2025-2031) | Growth, Revenue, Outlook, Share, Analysis, Industry, Size, Companies, Trends, Segmentation, Value & Forecast
Market Forecast By Type (Natural, Synthetic), By Grade (Ground Mica, Sheet Mica, Built-Up Mica), By End-user (Paints & Coatings, Electronics, Construction, Cosmetics, Others) And Competitive Landscape
| Product Code: ETC4815423 | Publication Date: Nov 2023 | Updated Date: Dec 2025 | Product Type: Market Research Report | |
| Publisher: 6Wresearch | Author: Sachin Kumar Rai | No. of Pages: 60 | No. of Figures: 30 | No. of Tables: 5 |
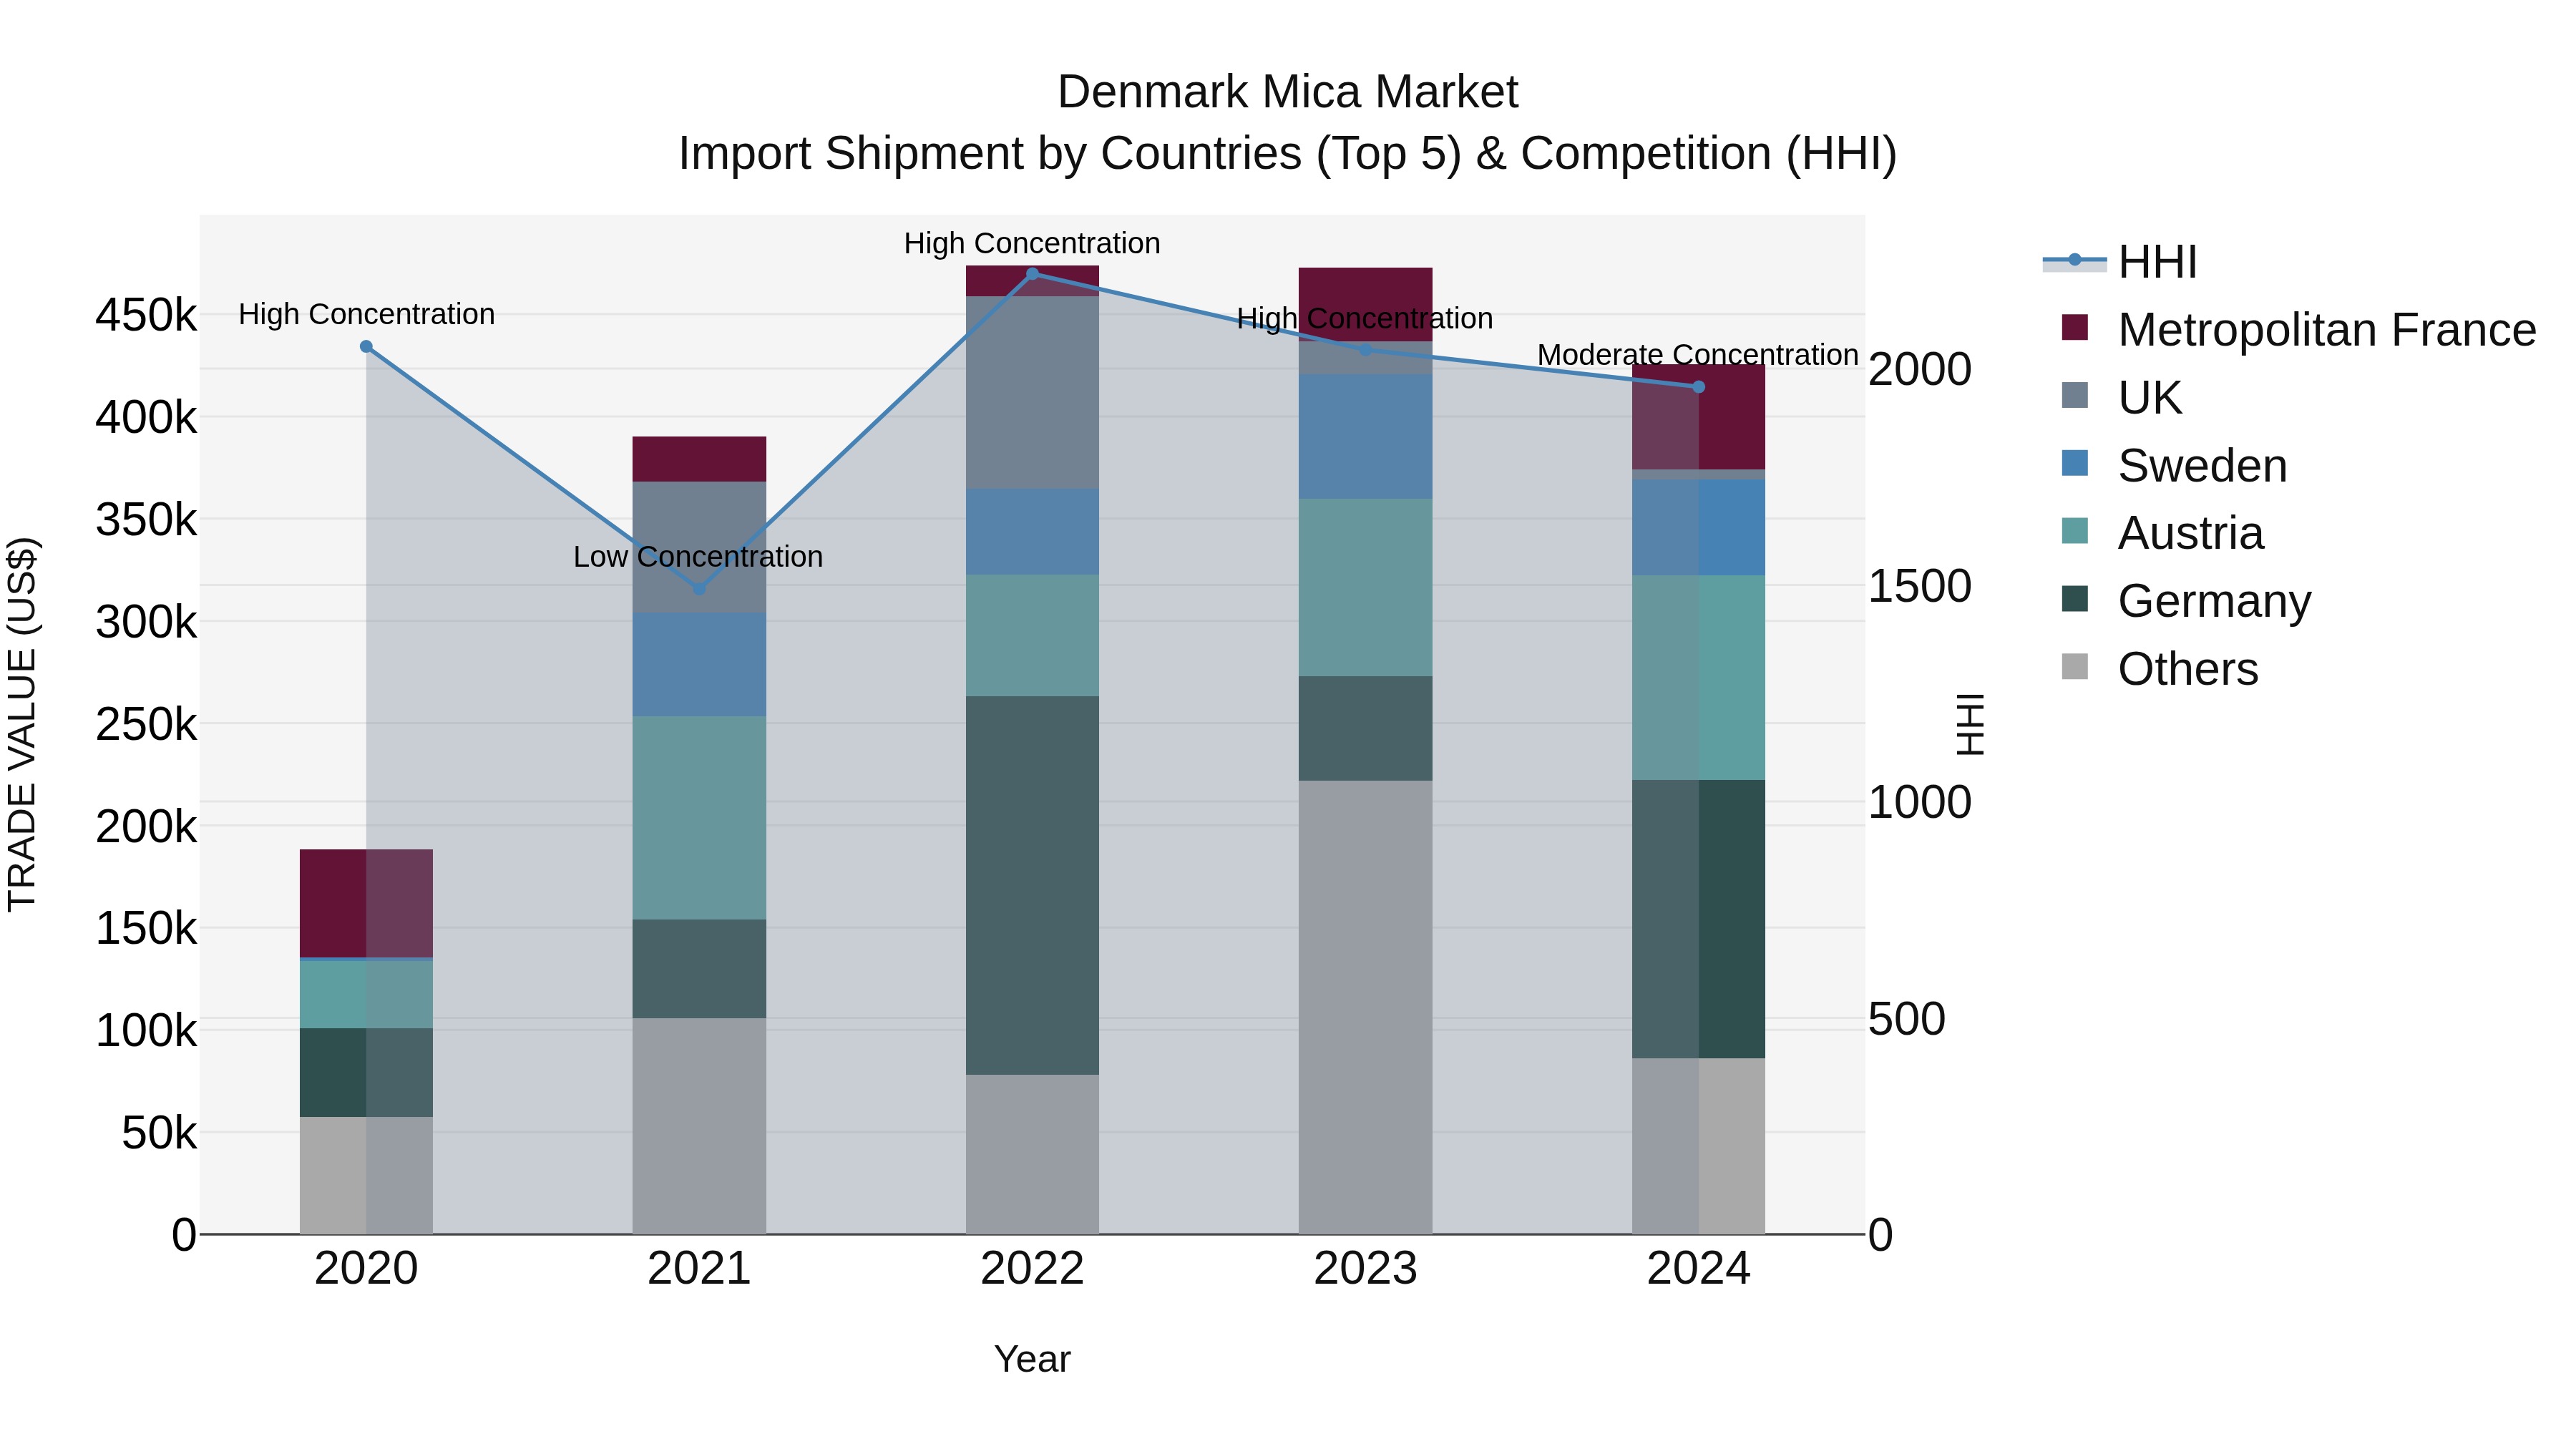
Denmark Mica Market Top 5 Importing Countries and Market Competition (HHI) Analysis
Denmark mica import market experienced a shift in concentration levels from high to moderate in 2024, with key exporting countries being Germany, Austria, Metropolitan France, Sweden, and Belgium. Despite a slight decline in growth rate from 2023 to 2024, the compound annual growth rate (CAGR) over the period 2020-2024 remained strong at 22.62%. This data reflects a dynamic market landscape and potential opportunities for market players to capitalize on the evolving trends in the mica import industry in Denmark.
Denmark Mica Market Overview
The mica market in Denmark is growing, driven by its use in electronics, paints, and plastics for its excellent thermal and electrical insulation properties. Micas versatile applications support demand across several industries.
Drivers of the market
The Mica Market in Denmark is influenced by the increasing demand for high-quality mica in cosmetics, electronics, and construction applications. As industries seek lightweight and durable materials, the use of mica becomes essential. Additionally, the growing trend towards natural and organic products in the cosmetics sector drives market expansion.
Challenges of the market
The mica market in Denmark faces challenges related to fluctuating raw material prices and the need for consistent product quality. Regulatory compliance regarding environmental impact and safe mining practices further complicates the market. Additionally, competition from synthetic alternatives puts pressure on companies to innovate and reduce costs while maintaining sustainability.
Government Policy of the market
The mica market in Denmark benefits from its application in cosmetics and electronics. Government policies promoting sustainable sourcing and ethical practices in mineral extraction are driving change in the market. The emphasis on transparency in supply chains is becoming increasingly important as consumers demand responsibly sourced materials.
Key Highlights of the Report:
- Denmark Mica Market Outlook
- Market Size of Denmark Mica Market, 2024
- Forecast of Denmark Mica Market, 2031
- Historical Data and Forecast of Denmark Mica Revenues & Volume for the Period 2021-2031
- Denmark Mica Market Trend Evolution
- Denmark Mica Market Drivers and Challenges
- Denmark Mica Price Trends
- Denmark Mica Porter`s Five Forces
- Denmark Mica Industry Life Cycle
- Historical Data and Forecast of Denmark Mica Market Revenues & Volume By Type for the Period 2021-2031
- Historical Data and Forecast of Denmark Mica Market Revenues & Volume By Natural for the Period 2021-2031
- Historical Data and Forecast of Denmark Mica Market Revenues & Volume By Synthetic for the Period 2021-2031
- Historical Data and Forecast of Denmark Mica Market Revenues & Volume By Grade for the Period 2021-2031
- Historical Data and Forecast of Denmark Mica Market Revenues & Volume By Ground Mica for the Period 2021-2031
- Historical Data and Forecast of Denmark Mica Market Revenues & Volume By Sheet Mica for the Period 2021-2031
- Historical Data and Forecast of Denmark Mica Market Revenues & Volume By Built-Up Mica for the Period 2021-2031
- Historical Data and Forecast of Denmark Mica Market Revenues & Volume By End-user for the Period 2021-2031
- Historical Data and Forecast of Denmark Mica Market Revenues & Volume By Paints & Coatings for the Period 2021-2031
- Historical Data and Forecast of Denmark Mica Market Revenues & Volume By Electronics for the Period 2021-2031
- Historical Data and Forecast of Denmark Mica Market Revenues & Volume By Construction for the Period 2021-2031
- Historical Data and Forecast of Denmark Mica Market Revenues & Volume By Cosmetics for the Period 2021-2031
- Historical Data and Forecast of Denmark Mica Market Revenues & Volume By Others for the Period 2021-2031
- Denmark Mica Import Export Trade Statistics
- Market Opportunity Assessment By Type
- Market Opportunity Assessment By Grade
- Market Opportunity Assessment By End-user
- Denmark Mica Top Companies Market Share
- Denmark Mica Competitive Benchmarking By Technical and Operational Parameters
- Denmark Mica Company Profiles
- Denmark Mica Key Strategic Recommendations
Frequently Asked Questions About the Market Study (FAQs):
6Wresearch actively monitors the Denmark Mica Market and publishes its comprehensive annual report, highlighting emerging trends, growth drivers, revenue analysis, and forecast outlook. Our insights help businesses to make data-backed strategic decisions with ongoing market dynamics. Our analysts track relevent industries related to the Denmark Mica Market, allowing our clients with actionable intelligence and reliable forecasts tailored to emerging regional needs.
Yes, we provide customisation as per your requirements. To learn more, feel free to contact us on sales@6wresearch.com
1 Executive Summary |
2 Introduction |
2.1 Key Highlights of the Report |
2.2 Report Description |
2.3 Market Scope & Segmentation |
2.4 Research Methodology |
2.5 Assumptions |
3 Denmark Mica Market Overview |
3.1 Denmark Country Macro Economic Indicators |
3.2 Denmark Mica Market Revenues & Volume, 2021 & 2031F |
3.3 Denmark Mica Market - Industry Life Cycle |
3.4 Denmark Mica Market - Porter's Five Forces |
3.5 Denmark Mica Market Revenues & Volume Share, By Type, 2021 & 2031F |
3.6 Denmark Mica Market Revenues & Volume Share, By Grade, 2021 & 2031F |
3.7 Denmark Mica Market Revenues & Volume Share, By End-user, 2021 & 2031F |
4 Denmark Mica Market Dynamics |
4.1 Impact Analysis |
4.2 Market Drivers |
4.2.1 Increasing demand for cosmetics and personal care products containing mica due to its natural and eco-friendly properties. |
4.2.2 Growth in the construction industry, where mica is used in paints, coatings, and insulation materials. |
4.2.3 Rising awareness about the benefits of mica in electronics and automotive sectors for thermal and electrical insulation. |
4.3 Market Restraints |
4.3.1 Fluctuating prices of mica due to supply chain disruptions and geopolitical factors. |
4.3.2 Concerns regarding unethical mining practices and child labor in some mica-producing regions. |
4.3.3 Stringent regulations related to environmental impact and labor practices in the mica mining industry. |
5 Denmark Mica Market Trends |
6 Denmark Mica Market Segmentations |
6.1 Denmark Mica Market, By Type |
6.1.1 Overview and Analysis |
6.1.2 Denmark Mica Market Revenues & Volume, By Natural, 2021-2031F |
6.1.3 Denmark Mica Market Revenues & Volume, By Synthetic, 2021-2031F |
6.2 Denmark Mica Market, By Grade |
6.2.1 Overview and Analysis |
6.2.2 Denmark Mica Market Revenues & Volume, By Ground Mica, 2021-2031F |
6.2.3 Denmark Mica Market Revenues & Volume, By Sheet Mica, 2021-2031F |
6.2.4 Denmark Mica Market Revenues & Volume, By Built-Up Mica, 2021-2031F |
6.3 Denmark Mica Market, By End-user |
6.3.1 Overview and Analysis |
6.3.2 Denmark Mica Market Revenues & Volume, By Paints & Coatings, 2021-2031F |
6.3.3 Denmark Mica Market Revenues & Volume, By Electronics, 2021-2031F |
6.3.4 Denmark Mica Market Revenues & Volume, By Construction, 2021-2031F |
6.3.5 Denmark Mica Market Revenues & Volume, By Cosmetics, 2021-2031F |
6.3.6 Denmark Mica Market Revenues & Volume, By Others, 2021-2031F |
7 Denmark Mica Market Import-Export Trade Statistics |
7.1 Denmark Mica Market Export to Major Countries |
7.2 Denmark Mica Market Imports from Major Countries |
8 Denmark Mica Market Key Performance Indicators |
8.1 Percentage of mica sourced from ethically responsible and sustainable suppliers. |
8.2 Innovation rate in mica processing technologies for enhanced quality and cost-effectiveness. |
8.3 Adoption rate of mica substitutes or alternative materials in key industries to reduce dependency on mica supply. |
9 Denmark Mica Market - Opportunity Assessment |
9.1 Denmark Mica Market Opportunity Assessment, By Type, 2021 & 2031F |
9.2 Denmark Mica Market Opportunity Assessment, By Grade, 2021 & 2031F |
9.3 Denmark Mica Market Opportunity Assessment, By End-user, 2021 & 2031F |
10 Denmark Mica Market - Competitive Landscape |
10.1 Denmark Mica Market Revenue Share, By Companies, 2024 |
10.2 Denmark Mica Market Competitive Benchmarking, By Operating and Technical Parameters |
11 Company Profiles |
12 Recommendations | 13 Disclaimer |
Global Go To Market Strategy - 2030
Export potential enables firms to identify high-growth global markets with greater confidence by combining advanced trade intelligence with a structured quantitative methodology. The framework analyzes emerging demand trends and country-level import patterns while integrating macroeconomic and trade datasets such as GDP and population forecasts, bilateral import–export flows, tariff structures, elasticity differentials between developed and developing economies, geographic distance, and import demand projections. Using weighted trade values from 2020–2024 as the base period to project country-to-country export potential for 2030, these inputs are operationalized through calculated drivers such as gravity model parameters, tariff impact factors, and projected GDP per-capita growth. Through an analysis of hidden potentials, demand hotspots, and market conditions that are most favorable to success, this method enables firms to focus on target countries, maximize returns, and global expansion with data, backed by accuracy.
By factoring in the projected importer demand gap that is currently unmet and could be potential opportunity, it identifies the potential for the Exporter (Country) among 190 countries, against the general trade analysis, which identifies the biggest importer or exporter.
To discover high-growth global markets and optimize your business strategy:
Click Here
Pricing
- Single User License$ 1,995
- Department License$ 2,400
- Site License$ 3,120
- Global License$ 3,795

Leadership Perspectives from Industry Events
Search
Thought Leadership and Analyst Meet


Our Clients
6WResearch In News
- Doha a strategic location for EV manufacturing hub: IPA Qatar
- Demand for luxury TVs surging in the GCC, says Samsung
- Empowering Growth: The Thriving Journey of Bangladesh’s Cable Industry
- Demand for luxury TVs surging in the GCC, says Samsung
- Video call with a traditional healer? Once unthinkable, it’s now common in South Africa
- Intelligent Buildings To Smooth GCC’s Path To Net Zero
Latest Reports
- Taiwan Airport Wireless Infrastructure Market (2026-2032)
- Vietnam Airport Wireless Infrastructure Market (2026-2032)
- Thailand Airport Wireless Infrastructure Market (2026-2032)
- South Korea Airport Wireless Infrastructure Market (2026-2032)
- Romania Airport Wireless Infrastructure Market (2026-2032)
- Qatar Airport Wireless Infrastructure Market (2026-2032)
- Philippines Airport Wireless Infrastructure Market (2026-2032)
- Japan Airport Wireless Infrastructure Market (2026-2032)
- Taiwan Airport Winter Services Market (2026-2032)
- Vietnam Airport Winter Services Market (2026-2032)
Industry Events and Analyst Meet

HIMTEX 2026

India Refining Summit 2026

India EV Show 2026

EV tech India Expo 2026

Auto Tech Asia 2026
Whitepaper
- Middle East & Africa Commercial Security Market Click here to view more.
- Middle East & Africa Fire Safety Systems & Equipment Market Click here to view more.
- GCC Drone Market Click here to view more.
- Middle East Lighting Fixture Market Click here to view more.
- GCC Physical & Perimeter Security Market Click here to view more.