Denmark Nitrobenzene Market (2026-2032) | Trends, Analysis, Companies, Outlook, Competitive Landscape, Share, Segmentation, Value, Forecast, Growth, Industry, Size & Revenue
Market Forecast By Form (Liquid, Powder), By Grade (Agricultural, Industrial, Pharmaceutical), By Application (Aniline Production, Lubricating Oils, Dyes & Pigments, Synthetic Rubber, Pesticides, Others (fertilizers, drugs, etc.)), By End-use (Pharmaceuticals, Automotive, Leather, Agriculture, Others) And Competitive Landscape
| Product Code: ETC6964936 | Publication Date: Sep 2024 | Updated Date: Apr 2026 | Product Type: Market Research Report | |
| Publisher: 6Wresearch | Author: Shubham Padhi | No. of Pages: 75 | No. of Figures: 35 | No. of Tables: 20 |
Denmark Nitrobenzene Market Size (2020-2030)
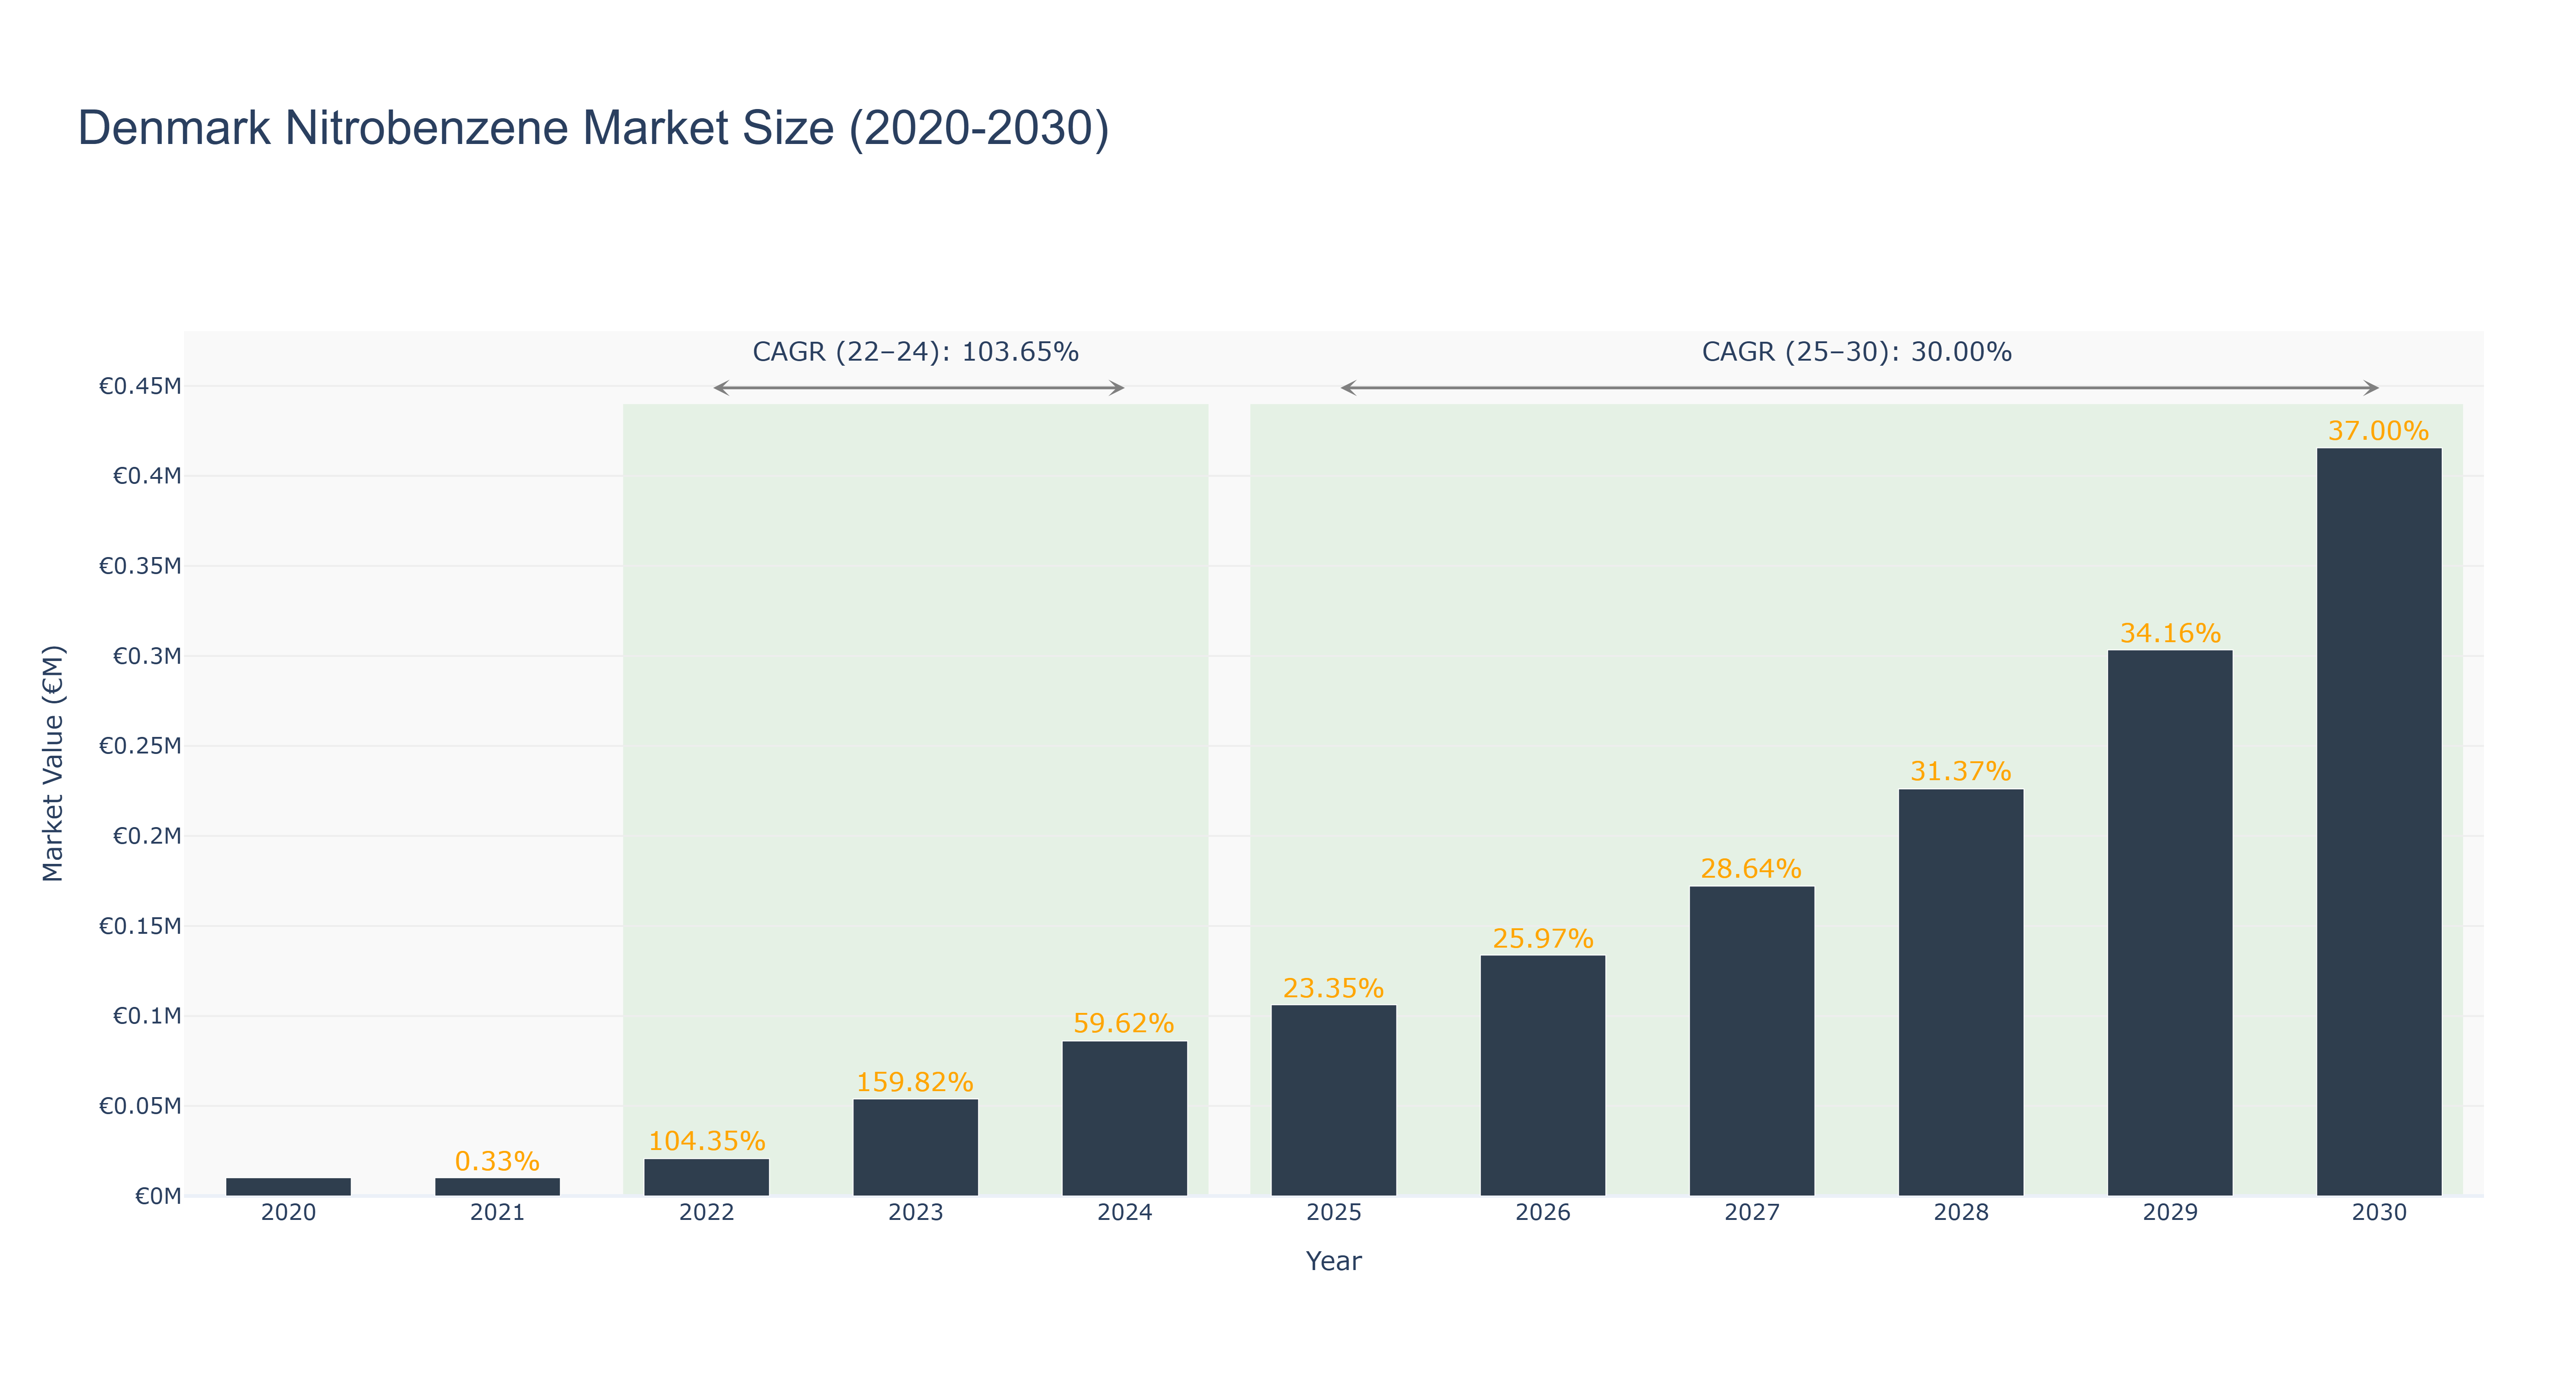
The Denmark Nitrobenzene Market has experienced remarkable growth, with the market size soaring from €10.13 thousand in 2020 to a peak of €86.11 thousand in 2024, reflecting a staggering CAGR of 103.65% from 2022 to 2024. This surge can be attributed to increased demand in chemical manufacturing and a shift towards more sustainable production processes. Looking ahead, the market is projected to continue its upward trajectory, with forecasted sizes reaching €106.22 thousand in 2025 and €415.62 thousand by 2030, demonstrating a robust CAGR of 30.00% during the 2025-2030 period. Key drivers for this growth include advancements in industrial applications and regulatory support for chemical innovations. As Denmark focuses on sustainability and clean technologies, the Nitrobenzene market is poised for significant transformations, supported by ongoing research and development initiatives aimed at enhancing production efficiency and environmental compliance.
Denmark Nitrobenzene Market: Production & Trade Performance (2019-2025)
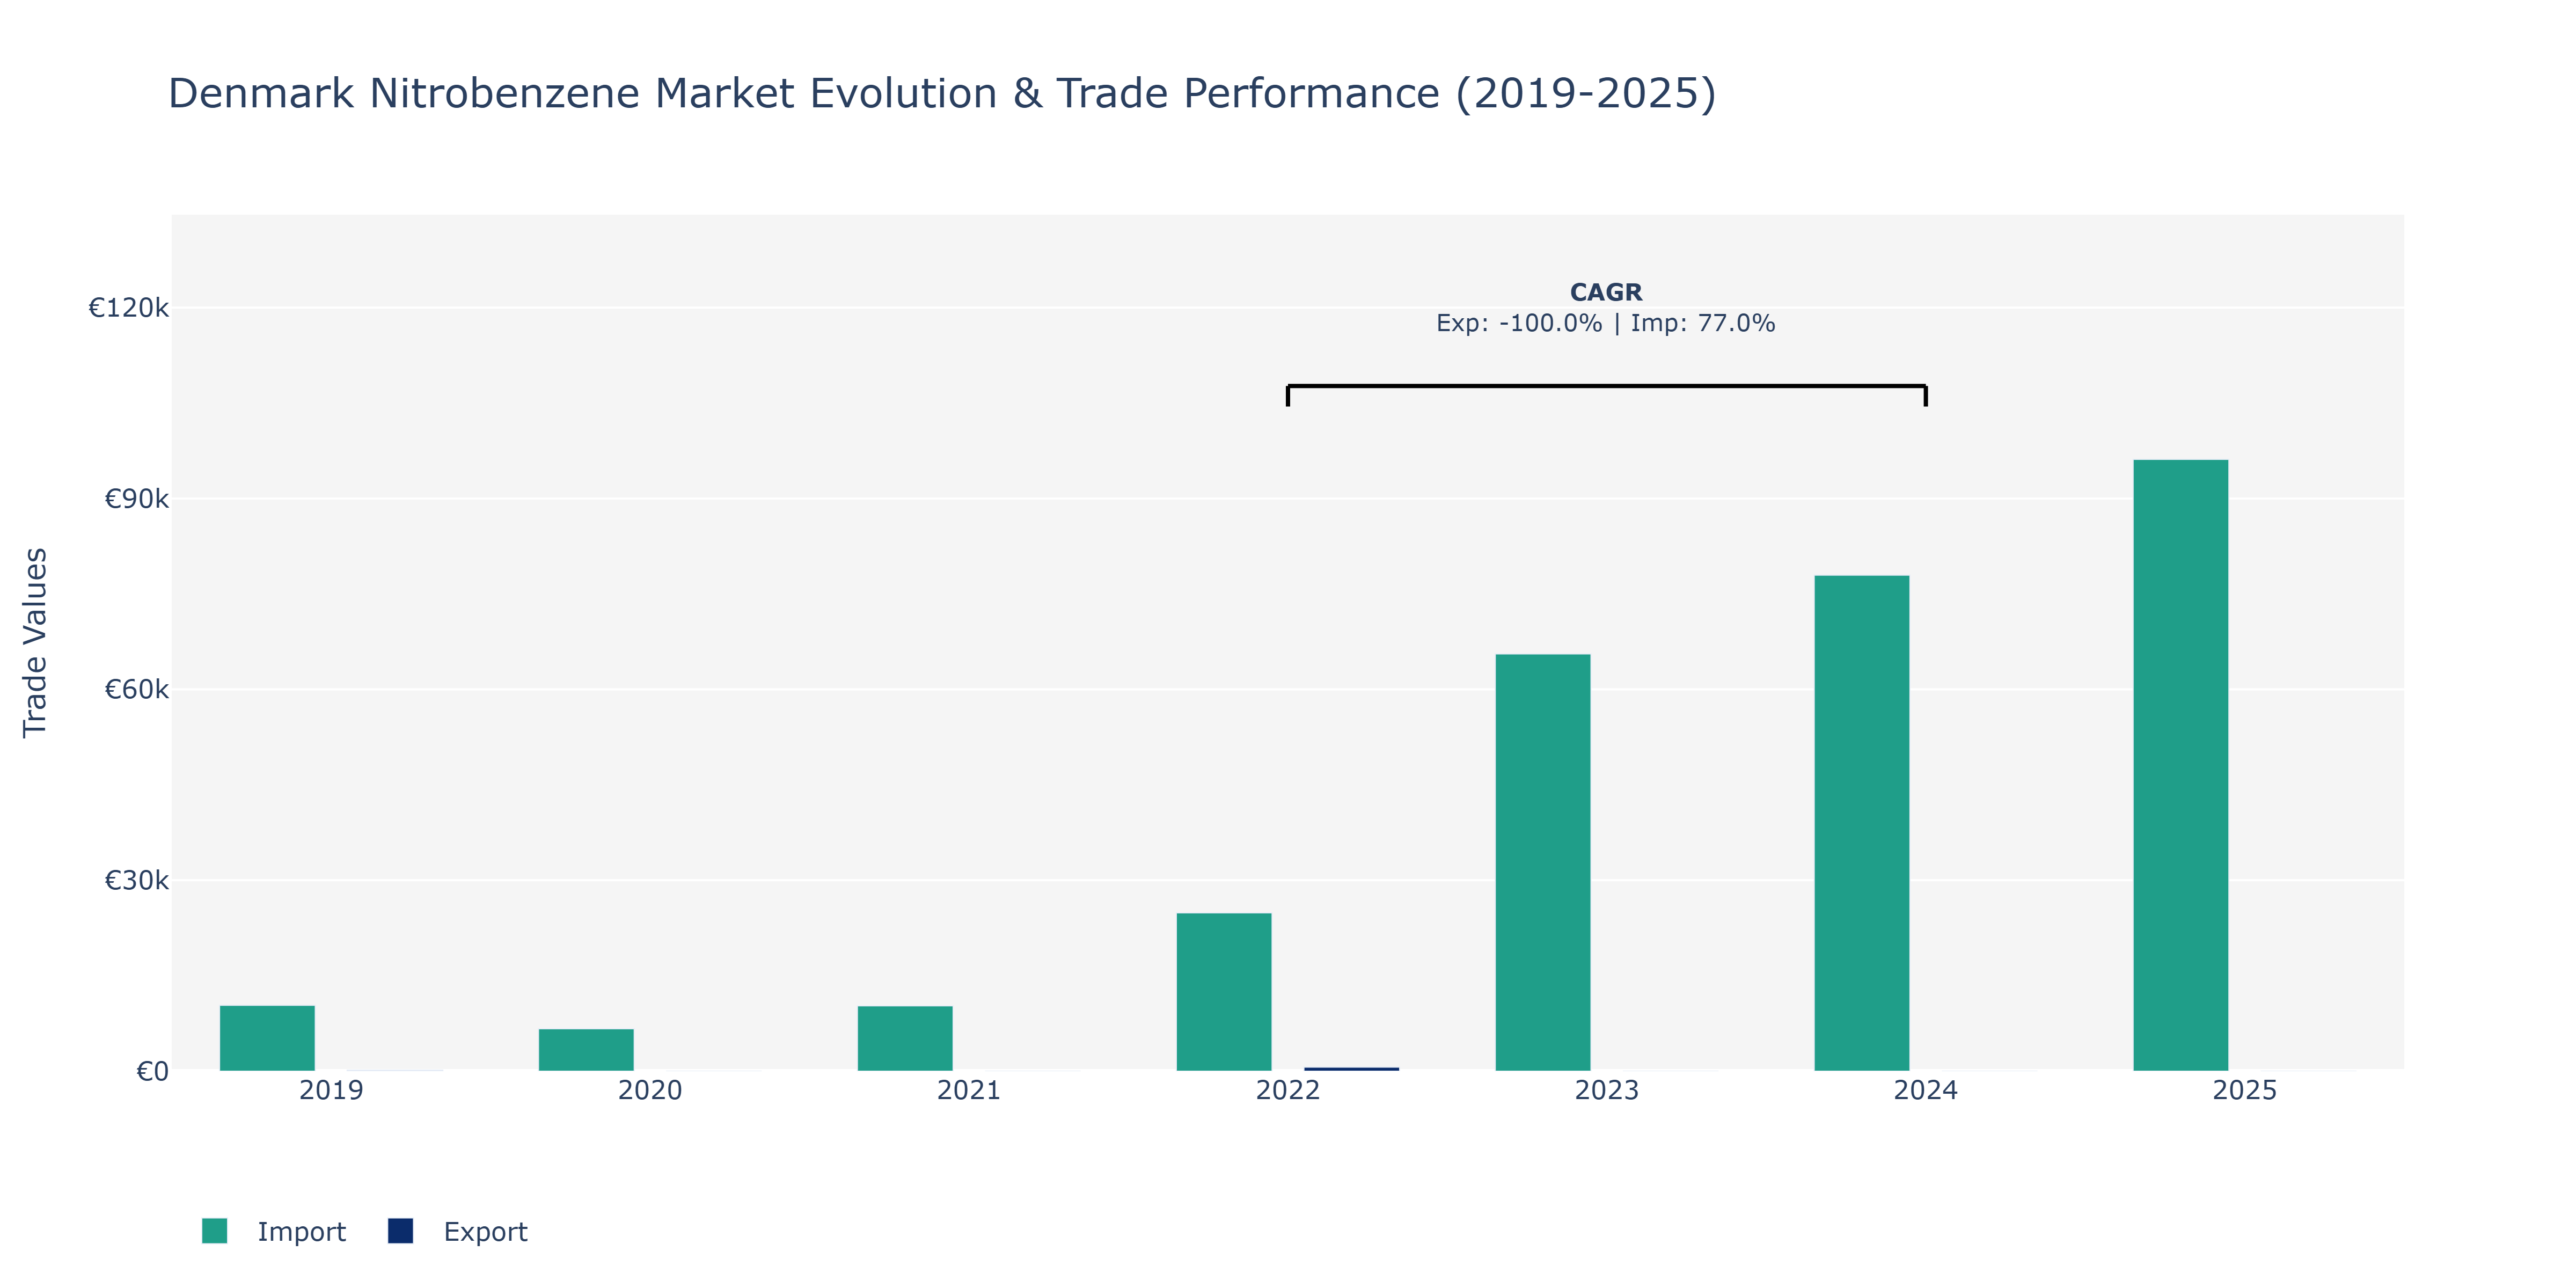
Between 2019 and 2025, Denmark's Nitrobenzene Market showcased notable shifts in its exports and imports. In 2019, exports stood at €170 million, contrasting starkly with 2022 when a substantial decline was witnessed to €633 million. Imports surged from €10.35 thousand in 2019 to peak at €96.14 thousand in 2025, indicating a consistent upward trajectory. Notably, 2022 marked the apex for imports at €24.87 thousand, followed by consistent growth in the subsequent years. The influx of imports can be attributed to the increasing demand for nitrobenzene in various industries, particularly in the production of aniline, rubber chemicals, and pesticides, aligning with the global trend of growing chemical consumption. However, the fluctuation in exports may be due to shifting market dynamics, changing global demand patterns, and competitive pressures within the industry. As Denmark's chemical sector continues to evolve, strategies focusing on enhancing production efficiency and exploring diverse export markets could help stabilize Export value in the coming years.
Key Highlights of the Report:
- Denmark Nitrobenzene Market Outlook
- Market Size of Denmark Nitrobenzene Market, 2025
- Forecast of Denmark Nitrobenzene Market, 2032
- Historical Data and Forecast of Denmark Nitrobenzene Revenues & Volume for the Period 2022 - 2032
- Denmark Nitrobenzene Market Trend Evolution
- Denmark Nitrobenzene Market Drivers and Challenges
- Denmark Nitrobenzene Price Trends
- Denmark Nitrobenzene Porter's Five Forces
- Denmark Nitrobenzene Industry Life Cycle
- Historical Data and Forecast of Denmark Nitrobenzene Market Revenues & Volume By Form for the Period 2022 - 2032
- Historical Data and Forecast of Denmark Nitrobenzene Market Revenues & Volume By Liquid for the Period 2022 - 2032
- Historical Data and Forecast of Denmark Nitrobenzene Market Revenues & Volume By Powder for the Period 2022 - 2032
- Historical Data and Forecast of Denmark Nitrobenzene Market Revenues & Volume By Grade for the Period 2022 - 2032
- Historical Data and Forecast of Denmark Nitrobenzene Market Revenues & Volume By Agricultural for the Period 2022 - 2032
- Historical Data and Forecast of Denmark Nitrobenzene Market Revenues & Volume By Industrial for the Period 2022 - 2032
- Historical Data and Forecast of Denmark Nitrobenzene Market Revenues & Volume By Pharmaceutical for the Period 2022 - 2032
- Historical Data and Forecast of Denmark Nitrobenzene Market Revenues & Volume By Application for the Period 2022 - 2032
- Historical Data and Forecast of Denmark Nitrobenzene Market Revenues & Volume By Aniline Production for the Period 2022 - 2032
- Historical Data and Forecast of Denmark Nitrobenzene Market Revenues & Volume By Lubricating Oils for the Period 2022 - 2032
- Historical Data and Forecast of Denmark Nitrobenzene Market Revenues & Volume By Dyes & Pigments for the Period 2022 - 2032
- Historical Data and Forecast of Denmark Nitrobenzene Market Revenues & Volume By Synthetic Rubber for the Period 2022 - 2032
- Historical Data and Forecast of Denmark Nitrobenzene Market Revenues & Volume By Pesticides for the Period 2022 - 2032
- Historical Data and Forecast of Denmark Nitrobenzene Market Revenues & Volume By Others (fertilizers, drugs, etc.) for the Period 2022 - 2032
- Historical Data and Forecast of Denmark Nitrobenzene Market Revenues & Volume By End-use for the Period 2022 - 2032
- Historical Data and Forecast of Denmark Nitrobenzene Market Revenues & Volume By Pharmaceuticals for the Period 2022 - 2032
- Historical Data and Forecast of Denmark Nitrobenzene Market Revenues & Volume By Automotive for the Period 2022 - 2032
- Historical Data and Forecast of Denmark Nitrobenzene Market Revenues & Volume By Leather for the Period 2022 - 2032
- Historical Data and Forecast of Denmark Nitrobenzene Market Revenues & Volume By Agriculture for the Period 2022 - 2032
- Historical Data and Forecast of Denmark Nitrobenzene Market Revenues & Volume By Others for the Period 2022 - 2032
- Denmark Nitrobenzene Import Export Trade Statistics
- Market Opportunity Assessment By Form
- Market Opportunity Assessment By Grade
- Market Opportunity Assessment By Application
- Market Opportunity Assessment By End-use
- Denmark Nitrobenzene Top Companies Market Share
- Denmark Nitrobenzene Competitive Benchmarking By Technical and Operational Parameters
- Denmark Nitrobenzene Company Profiles
- Denmark Nitrobenzene Key Strategic Recommendations
Frequently Asked Questions About the Market Study (FAQs):
6Wresearch actively monitors the Denmark Nitrobenzene Market and publishes its comprehensive annual report, highlighting emerging trends, growth drivers, revenue analysis, and forecast outlook. Our insights help businesses to make data-backed strategic decisions with ongoing market dynamics. Our analysts track relevent industries related to the Denmark Nitrobenzene Market, allowing our clients with actionable intelligence and reliable forecasts tailored to emerging regional needs.
Yes, we provide customisation as per your requirements. To learn more, feel free to contact us on sales@6wresearch.com
1 Executive Summary |
2 Introduction |
2.1 Key Highlights of the Report |
2.2 Report Description |
2.3 Market Scope & Segmentation |
2.4 Research Methodology |
2.5 Assumptions |
3 Denmark Nitrobenzene Market Overview |
3.1 Denmark Country Macro Economic Indicators |
3.2 Denmark Nitrobenzene Market Revenues & Volume, 2022 & 2032F |
3.3 Denmark Nitrobenzene Market - Industry Life Cycle |
3.4 Denmark Nitrobenzene Market - Porter's Five Forces |
3.5 Denmark Nitrobenzene Market Revenues & Volume Share, By Form, 2022 & 2032F |
3.6 Denmark Nitrobenzene Market Revenues & Volume Share, By Grade, 2022 & 2032F |
3.7 Denmark Nitrobenzene Market Revenues & Volume Share, By Application, 2022 & 2032F |
3.8 Denmark Nitrobenzene Market Revenues & Volume Share, By End-use, 2022 & 2032F |
4 Denmark Nitrobenzene Market Dynamics |
4.1 Impact Analysis |
4.2 Market Drivers |
4.2.1 Increasing demand for nitrobenzene in the chemical industry for the production of aniline, which is used in the manufacturing of various products such as dyes, pharmaceuticals, and rubber chemicals. |
4.2.2 Growing focus on sustainable practices and green chemistry, leading to the adoption of nitrobenzene as a raw material in eco-friendly processes. |
4.2.3 Technological advancements in nitrobenzene production processes, leading to cost efficiencies and improved product quality. |
4.3 Market Restraints |
4.3.1 Fluctuating prices of raw materials used in nitrobenzene production, such as benzene and nitric acid, impacting the overall production costs. |
4.3.2 Stringent regulations and compliance requirements related to the usage and disposal of nitrobenzene, leading to increased operational challenges for manufacturers. |
4.3.3 Competition from alternative chemicals and substitutes that offer similar properties to nitrobenzene, affecting market demand and pricing. |
5 Denmark Nitrobenzene Market Trends |
6 Denmark Nitrobenzene Market, By Types |
6.1 Denmark Nitrobenzene Market, By Form |
6.1.1 Overview and Analysis |
6.1.2 Denmark Nitrobenzene Market Revenues & Volume, By Form, 2022 - 2032F |
6.1.3 Denmark Nitrobenzene Market Revenues & Volume, By Liquid, 2022 - 2032F |
6.1.4 Denmark Nitrobenzene Market Revenues & Volume, By Powder, 2022 - 2032F |
6.2 Denmark Nitrobenzene Market, By Grade |
6.2.1 Overview and Analysis |
6.2.2 Denmark Nitrobenzene Market Revenues & Volume, By Agricultural, 2022 - 2032F |
6.2.3 Denmark Nitrobenzene Market Revenues & Volume, By Industrial, 2022 - 2032F |
6.2.4 Denmark Nitrobenzene Market Revenues & Volume, By Pharmaceutical, 2022 - 2032F |
6.3 Denmark Nitrobenzene Market, By Application |
6.3.1 Overview and Analysis |
6.3.2 Denmark Nitrobenzene Market Revenues & Volume, By Aniline Production, 2022 - 2032F |
6.3.3 Denmark Nitrobenzene Market Revenues & Volume, By Lubricating Oils, 2022 - 2032F |
6.3.4 Denmark Nitrobenzene Market Revenues & Volume, By Dyes & Pigments, 2022 - 2032F |
6.3.5 Denmark Nitrobenzene Market Revenues & Volume, By Synthetic Rubber, 2022 - 2032F |
6.3.6 Denmark Nitrobenzene Market Revenues & Volume, By Pesticides, 2022 - 2032F |
6.3.7 Denmark Nitrobenzene Market Revenues & Volume, By Others (fertilizers, drugs, etc.), 2022 - 2032F |
6.4 Denmark Nitrobenzene Market, By End-use |
6.4.1 Overview and Analysis |
6.4.2 Denmark Nitrobenzene Market Revenues & Volume, By Pharmaceuticals, 2022 - 2032F |
6.4.3 Denmark Nitrobenzene Market Revenues & Volume, By Automotive, 2022 - 2032F |
6.4.4 Denmark Nitrobenzene Market Revenues & Volume, By Leather, 2022 - 2032F |
6.4.5 Denmark Nitrobenzene Market Revenues & Volume, By Agriculture, 2022 - 2032F |
6.4.6 Denmark Nitrobenzene Market Revenues & Volume, By Others, 2022 - 2032F |
7 Denmark Nitrobenzene Market Import-Export Trade Statistics |
7.1 Denmark Nitrobenzene Market Export to Major Countries |
7.2 Denmark Nitrobenzene Market Imports from Major Countries |
8 Denmark Nitrobenzene Market Key Performance Indicators |
8.1 Environmental impact metrics, such as carbon footprint reduction initiatives and waste management practices, to measure the sustainability efforts within the nitrobenzene market. |
8.2 Research and development investments in new nitrobenzene production technologies and process improvements to track innovation and competitiveness. |
8.3 Consumer perception and awareness surveys regarding the usage of nitrobenzene in end products, reflecting market acceptance and demand trends. |
9 Denmark Nitrobenzene Market - Opportunity Assessment |
9.1 Denmark Nitrobenzene Market Opportunity Assessment, By Form, 2022 & 2032F |
9.2 Denmark Nitrobenzene Market Opportunity Assessment, By Grade, 2022 & 2032F |
9.3 Denmark Nitrobenzene Market Opportunity Assessment, By Application, 2022 & 2032F |
9.4 Denmark Nitrobenzene Market Opportunity Assessment, By End-use, 2022 & 2032F |
10 Denmark Nitrobenzene Market - Competitive Landscape |
10.1 Denmark Nitrobenzene Market Revenue Share, By Companies, 2025 |
10.2 Denmark Nitrobenzene Market Competitive Benchmarking, By Operating and Technical Parameters |
11 Company Profiles |
12 Recommendations |
13 Disclaimer |
Export potential assessment - trade Analytics for 2030
Export potential enables firms to identify high-growth global markets with greater confidence by combining advanced trade intelligence with a structured quantitative methodology. The framework analyzes emerging demand trends and country-level import patterns while integrating macroeconomic and trade datasets such as GDP and population forecasts, bilateral import–export flows, tariff structures, elasticity differentials between developed and developing economies, geographic distance, and import demand projections. Using weighted trade values from 2020–2024 as the base period to project country-to-country export potential for 2030, these inputs are operationalized through calculated drivers such as gravity model parameters, tariff impact factors, and projected GDP per-capita growth. Through an analysis of hidden potentials, demand hotspots, and market conditions that are most favorable to success, this method enables firms to focus on target countries, maximize returns, and global expansion with data, backed by accuracy.
By factoring in the projected importer demand gap that is currently unmet and could be potential opportunity, it identifies the potential for the Exporter (Country) among 190 countries, against the general trade analysis, which identifies the biggest importer or exporter.
To discover high-growth global markets and optimize your business strategy:
Click Here
Pricing
- Single User License$ 1,995
- Department License$ 2,400
- Site License$ 3,120
- Global License$ 3,795

Search
Thought Leadership and Analyst Meet


Our Clients
Latest Reports
- Philippines Polyhydroxybutyrate-co-Hydroxyvalerate Market (2026-2032) | Trends, Insights, Challenges, Restraints, Competition, Size, Value, Forecast, Pricing, Share, Outlook, Revenue, Investment Opportunities, Strategy, Drivers, Demand, Growth, segmentation, Analysis, Companies
- Peru Polyhydroxybutyrate-co-Hydroxyvalerate Market (2026-2032) | Growth, Demand, Challenges, Share, Trends, Analysis, Pricing, Investment Opportunities, Drivers, Value, Forecast, Competition, Size, Companies, Insights, Outlook, Restraints, segmentation, Revenue, Strategy
- Pakistan Polyhydroxybutyrate-co-Hydroxyvalerate Market (2026-2032) | Restraints, segmentation, Pricing, Forecast, Share, Strategy, Competition, Trends, Insights, Drivers, Challenges, Growth, Revenue, Outlook, Value, Investment Opportunities, Companies, Size, Analysis, Demand
- Oman Polyhydroxybutyrate-co-Hydroxyvalerate Market (2026-2032) | Drivers, segmentation, Insights, Competition, Pricing, Outlook, Size, Revenue, Challenges, Forecast, Analysis, Growth, Value, Share, Trends, Investment Opportunities, Strategy, Restraints, Companies, Demand
- Nigeria Polyhydroxybutyrate-co-Hydroxyvalerate Market (2026-2032) | Value, Investment Opportunities, Analysis, Revenue, Restraints, Pricing, Outlook, Competition, Demand, Growth, Forecast, Companies, Trends, Challenges, segmentation, Drivers, Insights, Share, Size, Strategy
- Nepal Polyhydroxybutyrate-co-Hydroxyvalerate Market (2026-2032) | Insights, Analysis, Drivers, Share, Revenue, Demand, segmentation, Investment Opportunities, Competition, Forecast, Growth, Pricing, Companies, Strategy, Trends, Restraints, Challenges, Outlook, Size, Value
- Myanmar Polyhydroxybutyrate-co-Hydroxyvalerate Market (2026-2032) | Outlook, Revenue, Strategy, Restraints, Drivers, segmentation, Share, Forecast, Competition, Insights, Growth, Pricing, Size, Demand, Value, Companies, Trends, Challenges, Investment Opportunities, Analysis
- Morocco Polyhydroxybutyrate-co-Hydroxyvalerate Market (2026-2032) | Outlook, Investment Opportunities, Restraints, Strategy, Forecast, Challenges, Drivers, Growth, Companies, segmentation, Trends, Size, Competition, Revenue, Demand, Insights, Share, Analysis, Value, Pricing
- Mexico Polyhydroxybutyrate-co-Hydroxyvalerate Market (2026-2032) | Size, Drivers, Outlook, Share, Strategy, Growth, Pricing, Challenges, Companies, Demand, Value, Investment Opportunities, Restraints, Trends, Forecast, segmentation, Analysis, Insights, Competition, Revenue
- Malaysia Polyhydroxybutyrate-co-Hydroxyvalerate Market (2026-2032) | Share, segmentation, Size, Companies, Analysis, Insights, Forecast, Value, Revenue, Drivers, Restraints, Challenges, Investment Opportunities, Trends, Competition, Strategy, Demand, Growth, Outlook, Pricing
Industry Events and Analyst Meet

HIMTEX 2026

India Refining Summit 2026

India EV Show 2026

EV tech India Expo 2026

Auto Tech Asia 2026
Whitepaper
- Middle East & Africa Commercial Security Market Click here to view more.
- Middle East & Africa Fire Safety Systems & Equipment Market Click here to view more.
- GCC Drone Market Click here to view more.
- Middle East Lighting Fixture Market Click here to view more.
- GCC Physical & Perimeter Security Market Click here to view more.
6WResearch In News
- Doha a strategic location for EV manufacturing hub: IPA Qatar
- Demand for luxury TVs surging in the GCC, says Samsung
- Empowering Growth: The Thriving Journey of Bangladesh’s Cable Industry
- Demand for luxury TVs surging in the GCC, says Samsung
- Video call with a traditional healer? Once unthinkable, it’s now common in South Africa
- Intelligent Buildings To Smooth GCC’s Path To Net Zero