Denmark Triacetin Market (2026-2032) | Segmentation, Share, Revenue, Size, Outlook, Value, Trends, Analysis, Growth, Industry, Forecast & Companies
Market Forecast By Grade (Tobacco, Food, Industrial), By Product Type (Plasticizer, Solvent, Humectant), By End Use Industry (Tobacco, Food & Beverage, Pharmaceutical, Cosmetic, Chemical) And Competitive Landscape
| Product Code: ETC5651841 | Publication Date: Nov 2023 | Updated Date: Apr 2026 | Product Type: Market Research Report | |
| Publisher: 6Wresearch | Author: Ravi Bhandari | No. of Pages: 60 | No. of Figures: 30 | No. of Tables: 5 |
Denmark Triacetin Market Size (2020-2030)
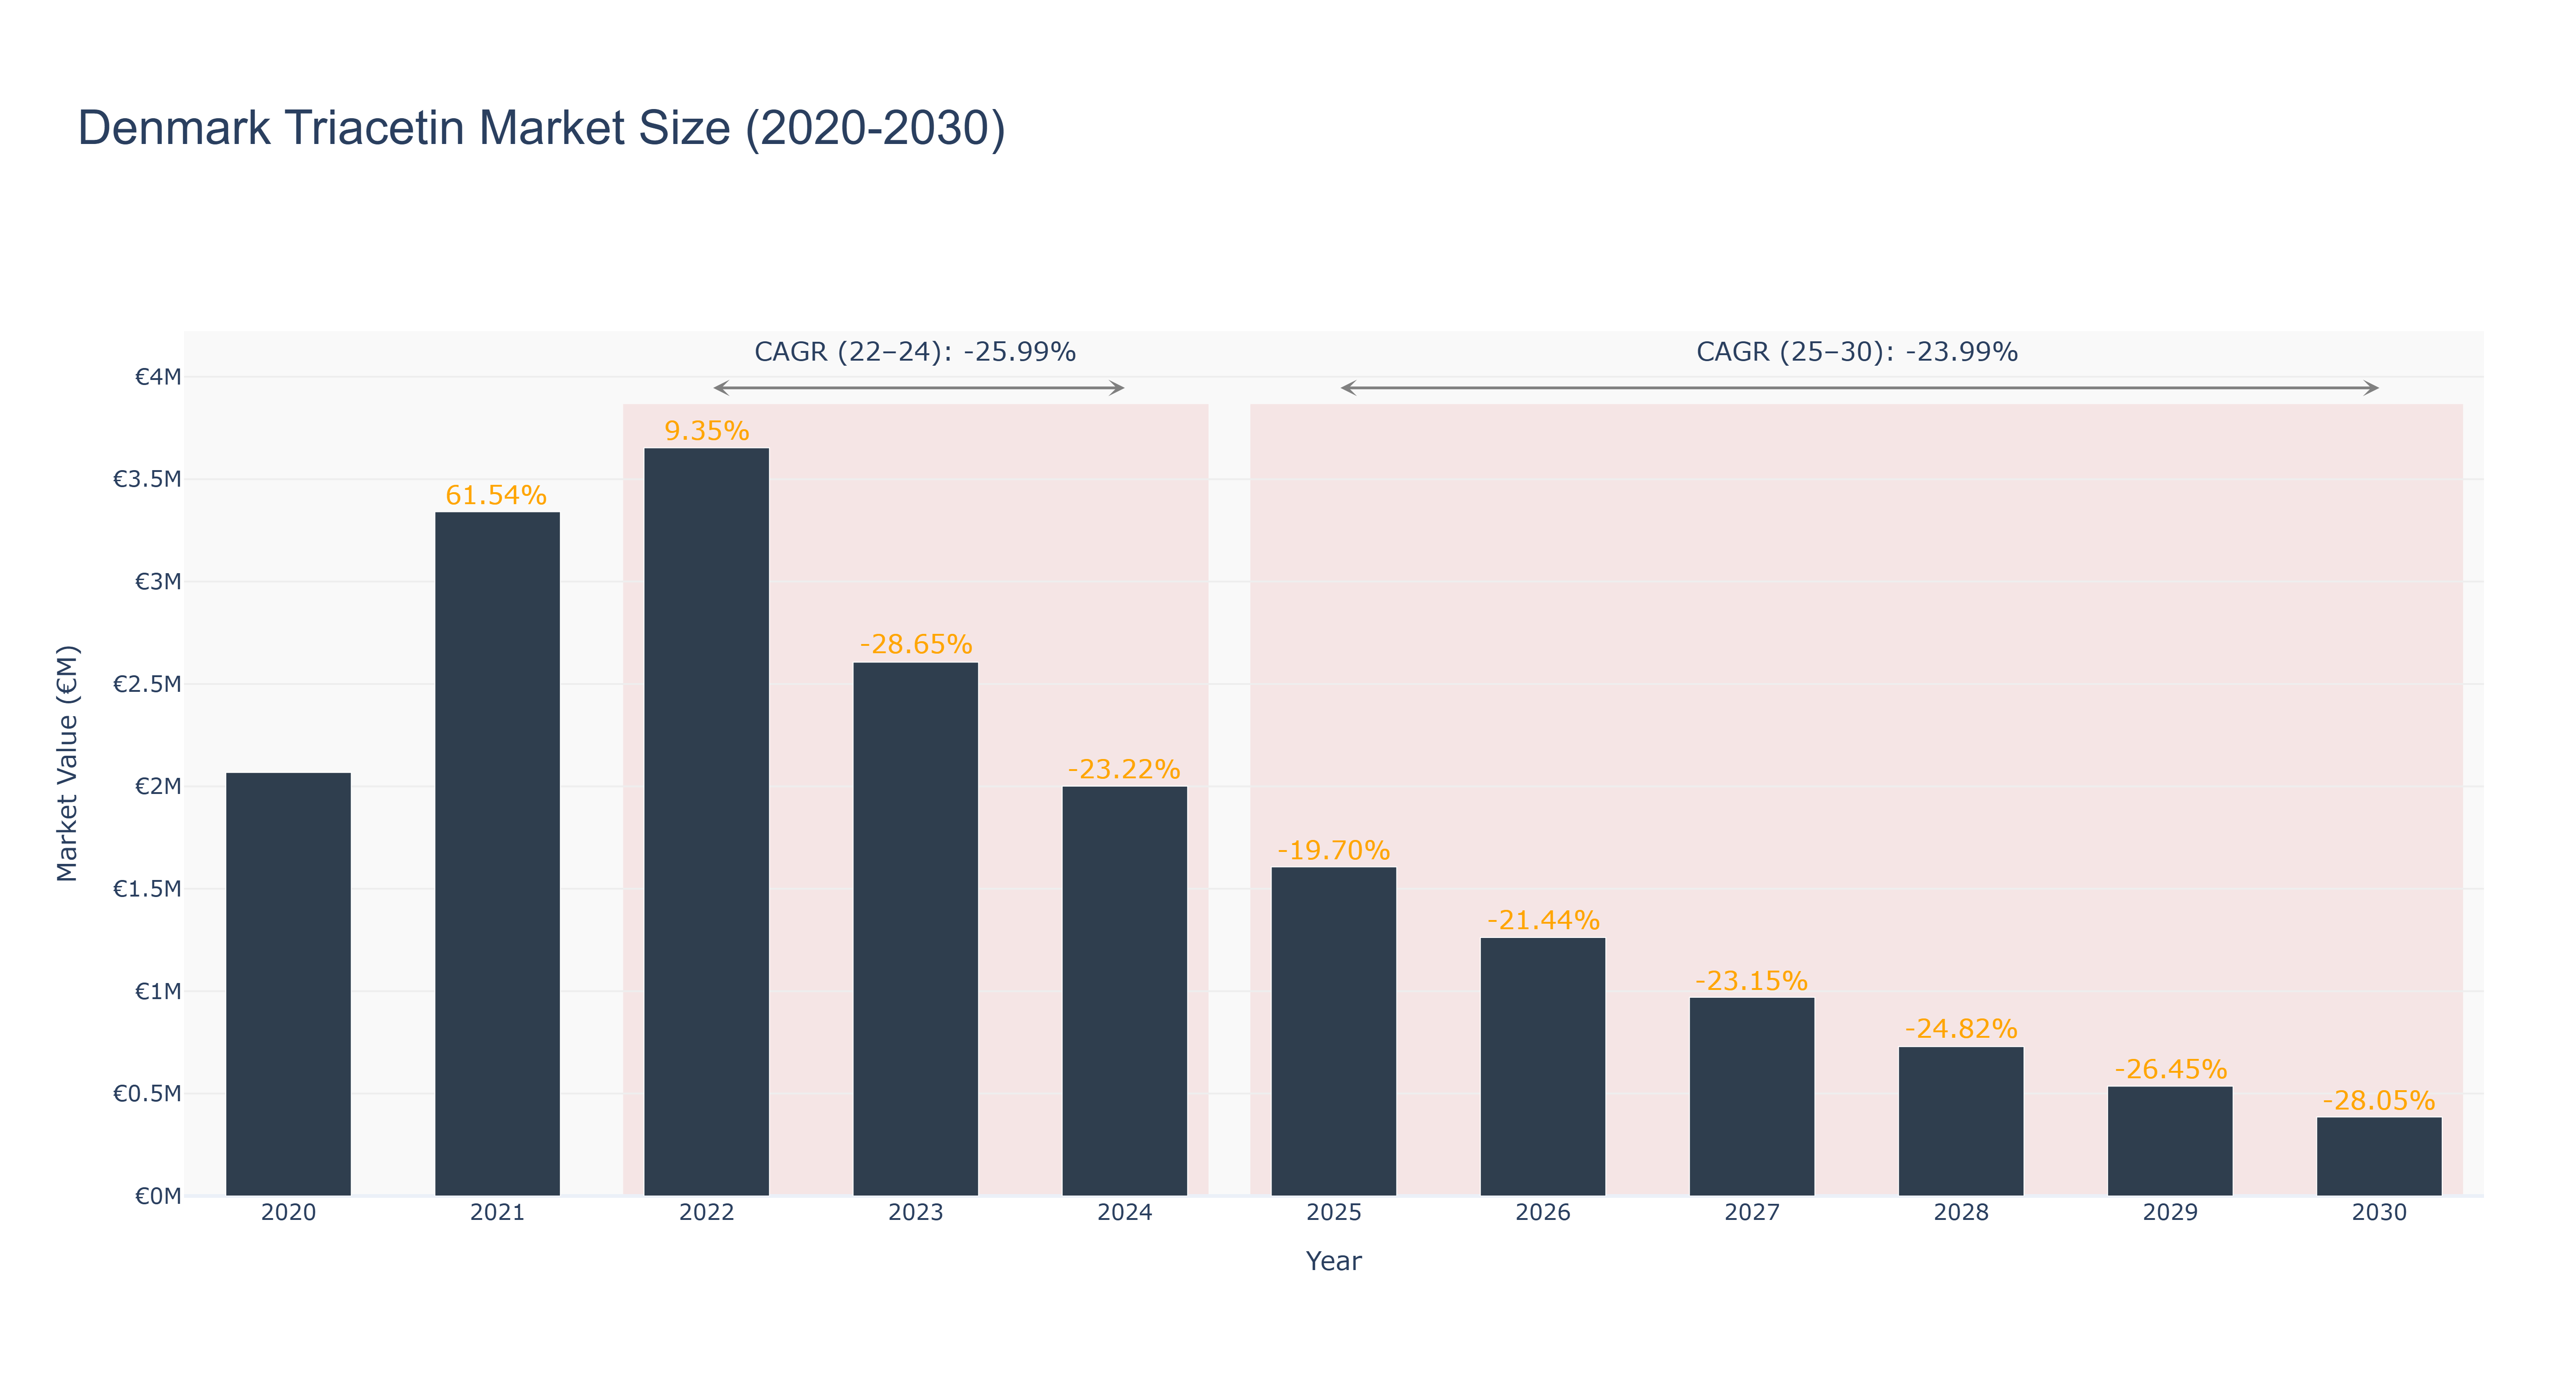
The Denmark Triacetin Market experienced a peak market size of €3.65 million in 2022, followed by a gradual decline to €1.26 million in 2026. The market is forecasted to continue shrinking to €0.39 million by 2030, with a CAGR of -23.99% from 2025 to 2030. The decline in market size can be attributed to factors such as regulatory changes impacting production costs and a shift towards alternative products in the chemical industry. Looking ahead, Denmark is set to witness a surge in renewable energy projects, leading to increased demand for sustainable chemicals like triacetin. This shift aligns with the country's focus on environmental sustainability and innovation in the chemical sector, indicating potential growth opportunities in the market. Industry drivers for the Denmark Triacetin Market include evolving consumer preferences towards eco-friendly products, stringent regulations promoting sustainable practices, and technological advancements enhancing production efficiency.
Denmark Triacetin Market: Production & Trade Performance (2019-2025)
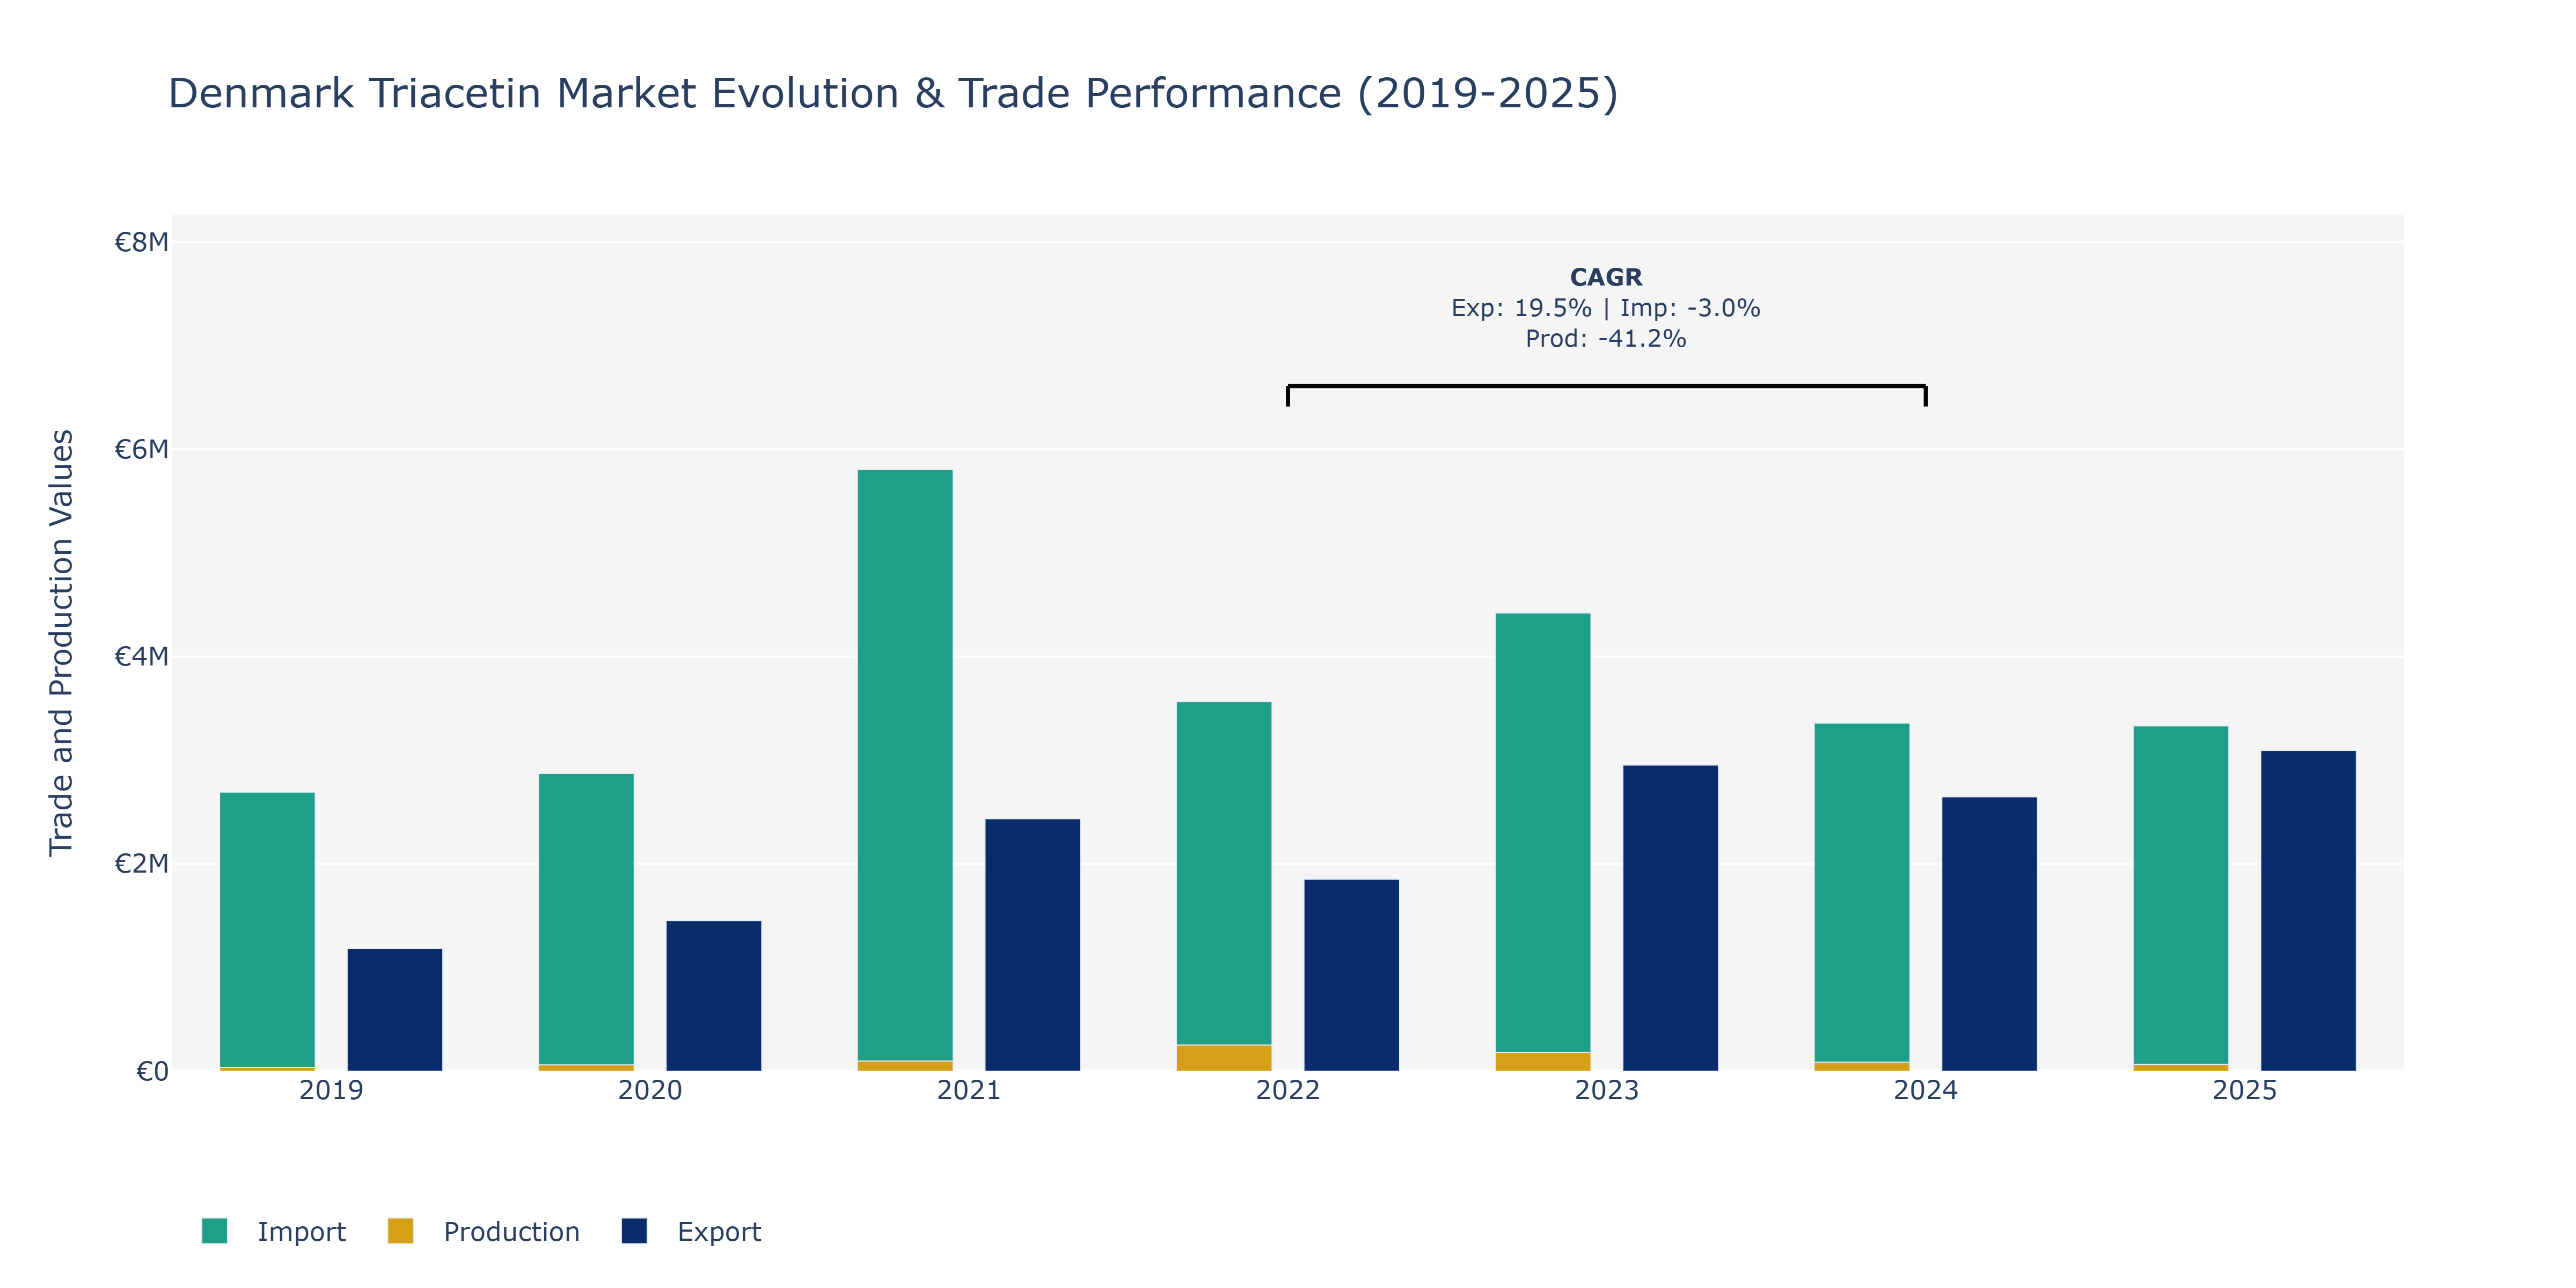
In the Denmark Triacetin Market, exports witnessed a notable increase from €1.19 million in 2019 to €2.95 million in 2023, with a peak value of €3.09 million in 2025. This growth can be attributed to the rising global demand for Triacetin due to its versatile applications in industries such as food, pharmaceuticals, and cosmetics. On the contrary, imports experienced fluctuations, reaching €3.57 million in 2022 before declining to €3.35 million in 2025. These variations may be influenced by changes in international trade agreements and domestic production capacities impacting the need for imports. Production levels surged from €36.7 million in 2019 to €98.8 million in 2021 before declining to €65.6 million in 2025, reflecting fluctuations in manufacturing processes, technological advancements, and market demand dynamics. This decline in production could be linked to factors such as operational challenges, regulatory changes, or shifts in consumer preferences, necessitating manufacturers to adapt to evolving market conditions.
Key Highlights of the Report:
- Denmark Triacetin Market Outlook
- Market Size of Denmark Triacetin Market, 2025
- Forecast of Denmark Triacetin Market, 2032
- Historical Data and Forecast of Denmark Triacetin Revenues & Volume for the Period 2022 - 2032F
- Denmark Triacetin Market Trend Evolution
- Denmark Triacetin Market Drivers and Challenges
- Denmark Triacetin Price Trends
- Denmark Triacetin Porter`s Five Forces
- Denmark Triacetin Industry Life Cycle
- Historical Data and Forecast of Denmark Triacetin Market Revenues & Volume By Grade for the Period 2022 - 2032F
- Historical Data and Forecast of Denmark Triacetin Market Revenues & Volume By Tobacco for the Period 2022 - 2032F
- Historical Data and Forecast of Denmark Triacetin Market Revenues & Volume By Food for the Period 2022 - 2032F
- Historical Data and Forecast of Denmark Triacetin Market Revenues & Volume By Industrial for the Period 2022 - 2032F
- Historical Data and Forecast of Denmark Triacetin Market Revenues & Volume By Product Type for the Period 2022 - 2032F
- Historical Data and Forecast of Denmark Triacetin Market Revenues & Volume By Plasticizer for the Period 2022 - 2032F
- Historical Data and Forecast of Denmark Triacetin Market Revenues & Volume By Solvent for the Period 2022 - 2032F
- Historical Data and Forecast of Denmark Triacetin Market Revenues & Volume By Humectant for the Period 2022 - 2032F
- Historical Data and Forecast of Denmark Triacetin Market Revenues & Volume By End Use Industry for the Period 2022 - 2032F
- Historical Data and Forecast of Denmark Triacetin Market Revenues & Volume By Tobacco for the Period 2022 - 2032F
- Historical Data and Forecast of Denmark Triacetin Market Revenues & Volume By Food & Beverage for the Period 2022 - 2032F
- Historical Data and Forecast of Denmark Triacetin Market Revenues & Volume By Pharmaceutical for the Period 2022 - 2032F
- Historical Data and Forecast of Denmark Triacetin Market Revenues & Volume By Cosmetic for the Period 2022 - 2032F
- Historical Data and Forecast of Denmark Triacetin Market Revenues & Volume By Chemical for the Period 2022 - 2032F
- Denmark Triacetin Import Export Trade Statistics
- Market Opportunity Assessment By Grade
- Market Opportunity Assessment By Product Type
- Market Opportunity Assessment By End Use Industry
- Denmark Triacetin Top Companies Market Share
- Denmark Triacetin Competitive Benchmarking By Technical and Operational Parameters
- Denmark Triacetin Company Profiles
- Denmark Triacetin Key Strategic Recommendations
Frequently Asked Questions About the Market Study (FAQs):
6Wresearch actively monitors the Denmark Triacetin Market and publishes its comprehensive annual report, highlighting emerging trends, growth drivers, revenue analysis, and forecast outlook. Our insights help businesses to make data-backed strategic decisions with ongoing market dynamics. Our analysts track relevent industries related to the Denmark Triacetin Market, allowing our clients with actionable intelligence and reliable forecasts tailored to emerging regional needs.
Yes, we provide customisation as per your requirements. To learn more, feel free to contact us on sales@6wresearch.com
1 Executive Summary |
2 Introduction |
2.1 Key Highlights of the Report |
2.2 Report Description |
2.3 Market Scope & Segmentation |
2.4 Research Methodology |
2.5 Assumptions |
3 Denmark Triacetin Market Overview |
3.1 Denmark Country Macro Economic Indicators |
3.2 Denmark Triacetin Market Revenues & Volume, 2022 & 2032F |
3.3 Denmark Triacetin Market - Industry Life Cycle |
3.4 Denmark Triacetin Market - Porter's Five Forces |
3.5 Denmark Triacetin Market Revenues & Volume Share, By Grade, 2022 & 2032F |
3.6 Denmark Triacetin Market Revenues & Volume Share, By Product Type, 2022 & 2032F |
3.7 Denmark Triacetin Market Revenues & Volume Share, By End Use Industry, 2022 & 2032F |
4 Denmark Triacetin Market Dynamics |
4.1 Impact Analysis |
4.2 Market Drivers |
4.2.1 Increasing demand for food additives and flavorings in the food and beverage industry |
4.2.2 Growing use of triacetin in pharmaceuticals as an excipient and plasticizer |
4.2.3 Rising awareness about the benefits of triacetin in various industrial applications |
4.3 Market Restraints |
4.3.1 Stringent regulations regarding the usage of triacetin in certain applications |
4.3.2 Fluctuating prices of raw materials for triacetin production |
4.3.3 Competition from alternative chemicals with similar functionalities |
5 Denmark Triacetin Market Trends |
6 Denmark Triacetin Market Segmentations |
6.1 Denmark Triacetin Market, By Grade |
6.1.1 Overview and Analysis |
6.1.2 Denmark Triacetin Market Revenues & Volume, By Tobacco, 2022 - 2032F |
6.1.3 Denmark Triacetin Market Revenues & Volume, By Food, 2022 - 2032F |
6.1.4 Denmark Triacetin Market Revenues & Volume, By Industrial, 2022 - 2032F |
6.2 Denmark Triacetin Market, By Product Type |
6.2.1 Overview and Analysis |
6.2.2 Denmark Triacetin Market Revenues & Volume, By Plasticizer, 2022 - 2032F |
6.2.3 Denmark Triacetin Market Revenues & Volume, By Solvent, 2022 - 2032F |
6.2.4 Denmark Triacetin Market Revenues & Volume, By Humectant, 2022 - 2032F |
6.3 Denmark Triacetin Market, By End Use Industry |
6.3.1 Overview and Analysis |
6.3.2 Denmark Triacetin Market Revenues & Volume, By Tobacco, 2022 - 2032F |
6.3.3 Denmark Triacetin Market Revenues & Volume, By Food & Beverage, 2022 - 2032F |
6.3.4 Denmark Triacetin Market Revenues & Volume, By Pharmaceutical, 2022 - 2032F |
6.3.5 Denmark Triacetin Market Revenues & Volume, By Cosmetic, 2022 - 2032F |
6.3.6 Denmark Triacetin Market Revenues & Volume, By Chemical, 2022 - 2032F |
7 Denmark Triacetin Market Import-Export Trade Statistics |
7.1 Denmark Triacetin Market Export to Major Countries |
7.2 Denmark Triacetin Market Imports from Major Countries |
8 Denmark Triacetin Market Key Performance Indicators |
8.1 Adoption rate of triacetin in new food and beverage products |
8.2 Number of pharmaceutical formulations incorporating triacetin |
8.3 Research and development investments in triacetin applications and technologies |
8.4 Sustainability initiatives in the production of triacetin |
9 Denmark Triacetin Market - Opportunity Assessment |
9.1 Denmark Triacetin Market Opportunity Assessment, By Grade, 2022 & 2032F |
9.2 Denmark Triacetin Market Opportunity Assessment, By Product Type, 2022 & 2032F |
9.3 Denmark Triacetin Market Opportunity Assessment, By End Use Industry, 2022 & 2032F |
10 Denmark Triacetin Market - Competitive Landscape |
10.1 Denmark Triacetin Market Revenue Share, By Companies, 2025 |
10.2 Denmark Triacetin Market Competitive Benchmarking, By Operating and Technical Parameters |
11 Company Profiles |
12 Recommendations | 13 Disclaimer |
Export potential assessment - trade Analytics for 2030
Export potential enables firms to identify high-growth global markets with greater confidence by combining advanced trade intelligence with a structured quantitative methodology. The framework analyzes emerging demand trends and country-level import patterns while integrating macroeconomic and trade datasets such as GDP and population forecasts, bilateral import–export flows, tariff structures, elasticity differentials between developed and developing economies, geographic distance, and import demand projections. Using weighted trade values from 2020–2024 as the base period to project country-to-country export potential for 2030, these inputs are operationalized through calculated drivers such as gravity model parameters, tariff impact factors, and projected GDP per-capita growth. Through an analysis of hidden potentials, demand hotspots, and market conditions that are most favorable to success, this method enables firms to focus on target countries, maximize returns, and global expansion with data, backed by accuracy.
By factoring in the projected importer demand gap that is currently unmet and could be potential opportunity, it identifies the potential for the Exporter (Country) among 190 countries, against the general trade analysis, which identifies the biggest importer or exporter.
To discover high-growth global markets and optimize your business strategy:
Click Here
Pricing
- Single User License$ 1,995
- Department License$ 2,400
- Site License$ 3,120
- Global License$ 3,795

Search
Thought Leadership and Analyst Meet


Our Clients
Latest Reports
- Philippines Polyhydroxybutyrate-co-Hydroxyvalerate Market (2026-2032) | Trends, Insights, Challenges, Restraints, Competition, Size, Value, Forecast, Pricing, Share, Outlook, Revenue, Investment Opportunities, Strategy, Drivers, Demand, Growth, segmentation, Analysis, Companies
- Peru Polyhydroxybutyrate-co-Hydroxyvalerate Market (2026-2032) | Growth, Demand, Challenges, Share, Trends, Analysis, Pricing, Investment Opportunities, Drivers, Value, Forecast, Competition, Size, Companies, Insights, Outlook, Restraints, segmentation, Revenue, Strategy
- Pakistan Polyhydroxybutyrate-co-Hydroxyvalerate Market (2026-2032) | Restraints, segmentation, Pricing, Forecast, Share, Strategy, Competition, Trends, Insights, Drivers, Challenges, Growth, Revenue, Outlook, Value, Investment Opportunities, Companies, Size, Analysis, Demand
- Oman Polyhydroxybutyrate-co-Hydroxyvalerate Market (2026-2032) | Drivers, segmentation, Insights, Competition, Pricing, Outlook, Size, Revenue, Challenges, Forecast, Analysis, Growth, Value, Share, Trends, Investment Opportunities, Strategy, Restraints, Companies, Demand
- Nigeria Polyhydroxybutyrate-co-Hydroxyvalerate Market (2026-2032) | Value, Investment Opportunities, Analysis, Revenue, Restraints, Pricing, Outlook, Competition, Demand, Growth, Forecast, Companies, Trends, Challenges, segmentation, Drivers, Insights, Share, Size, Strategy
- Nepal Polyhydroxybutyrate-co-Hydroxyvalerate Market (2026-2032) | Insights, Analysis, Drivers, Share, Revenue, Demand, segmentation, Investment Opportunities, Competition, Forecast, Growth, Pricing, Companies, Strategy, Trends, Restraints, Challenges, Outlook, Size, Value
- Myanmar Polyhydroxybutyrate-co-Hydroxyvalerate Market (2026-2032) | Outlook, Revenue, Strategy, Restraints, Drivers, segmentation, Share, Forecast, Competition, Insights, Growth, Pricing, Size, Demand, Value, Companies, Trends, Challenges, Investment Opportunities, Analysis
- Morocco Polyhydroxybutyrate-co-Hydroxyvalerate Market (2026-2032) | Outlook, Investment Opportunities, Restraints, Strategy, Forecast, Challenges, Drivers, Growth, Companies, segmentation, Trends, Size, Competition, Revenue, Demand, Insights, Share, Analysis, Value, Pricing
- Mexico Polyhydroxybutyrate-co-Hydroxyvalerate Market (2026-2032) | Size, Drivers, Outlook, Share, Strategy, Growth, Pricing, Challenges, Companies, Demand, Value, Investment Opportunities, Restraints, Trends, Forecast, segmentation, Analysis, Insights, Competition, Revenue
- Malaysia Polyhydroxybutyrate-co-Hydroxyvalerate Market (2026-2032) | Share, segmentation, Size, Companies, Analysis, Insights, Forecast, Value, Revenue, Drivers, Restraints, Challenges, Investment Opportunities, Trends, Competition, Strategy, Demand, Growth, Outlook, Pricing
Industry Events and Analyst Meet

HIMTEX 2026

India Refining Summit 2026

India EV Show 2026

EV tech India Expo 2026

Auto Tech Asia 2026
Whitepaper
- Middle East & Africa Commercial Security Market Click here to view more.
- Middle East & Africa Fire Safety Systems & Equipment Market Click here to view more.
- GCC Drone Market Click here to view more.
- Middle East Lighting Fixture Market Click here to view more.
- GCC Physical & Perimeter Security Market Click here to view more.
6WResearch In News
- Doha a strategic location for EV manufacturing hub: IPA Qatar
- Demand for luxury TVs surging in the GCC, says Samsung
- Empowering Growth: The Thriving Journey of Bangladesh’s Cable Industry
- Demand for luxury TVs surging in the GCC, says Samsung
- Video call with a traditional healer? Once unthinkable, it’s now common in South Africa
- Intelligent Buildings To Smooth GCC’s Path To Net Zero