Denmark Varnish Market (2026-2032) | Share, Outlook, Industry, Trends, Value, Size & Revenue, Companies, Competitive Landscape, Segmentation, Forecast, Growth, Analysis
Market Forecast By Type (UV Curable Overprint Varnishes, Water Based Overprint Varnish), By Application (Commercial prints, Food Industry, Pharmaceuticals, Others) And Competitive Landscape
| Product Code: ETC6972218 | Publication Date: Sep 2024 | Updated Date: Apr 2026 | Product Type: Market Research Report | |
| Publisher: 6Wresearch | Author: Sumit Sagar | No. of Pages: 75 | No. of Figures: 35 | No. of Tables: 20 |
Denmark Varnish Market Size (2020-2030)
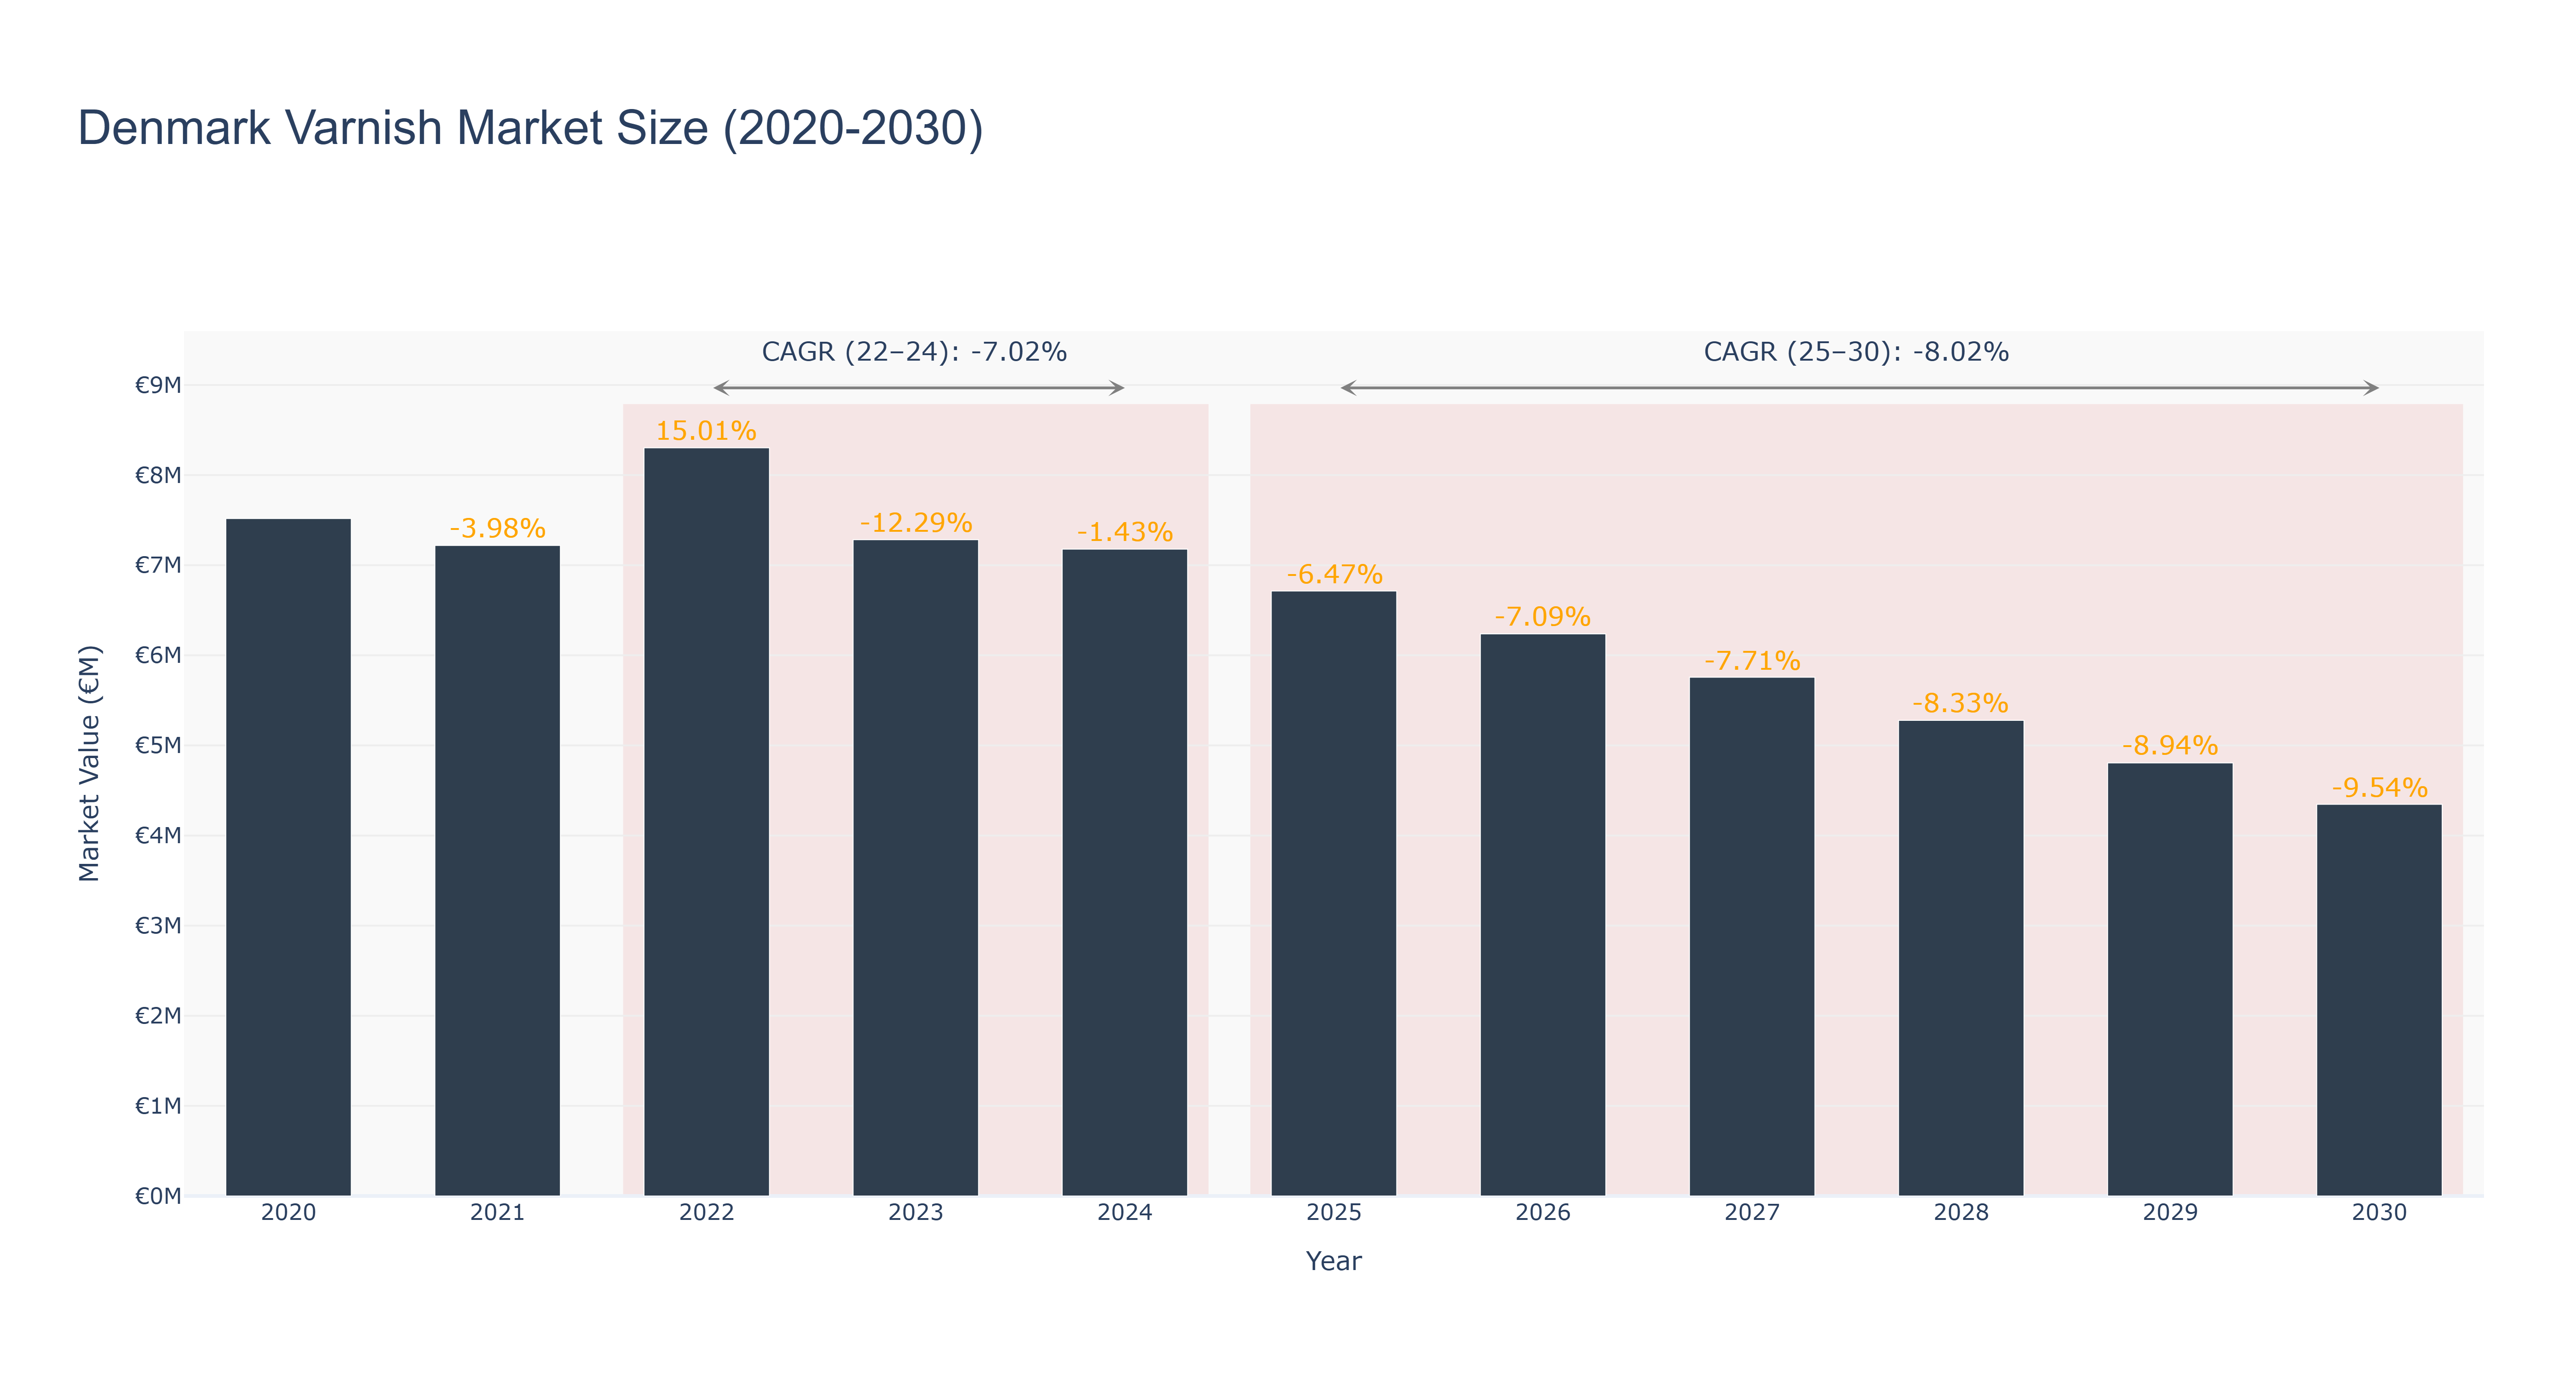
Denmark Varnish Market has experienced a fluctuating trend in recent years. The peak market size of €8.30 million was recorded in 2022, followed by a decline to €4.35 million forecasted for 2030. The actual market size saw a gradual decrease from 2020 to 2024, with a compound annual growth rate (CAGR) of -7.02%. The forecasted CAGR for the period 2025-30 is -8.02%. The downward trend can be attributed to various factors such as economic downturns, changing consumer preferences, and increased competition. Looking ahead, the market is expected to focus on innovation and sustainability initiatives to regain growth momentum. Recent developments in eco-friendly varnish products and collaborations with key industry players are anticipated to drive future market expansion in Denmark.
Denmark Varnish Market: Production & Trade Performance (2019-2025)
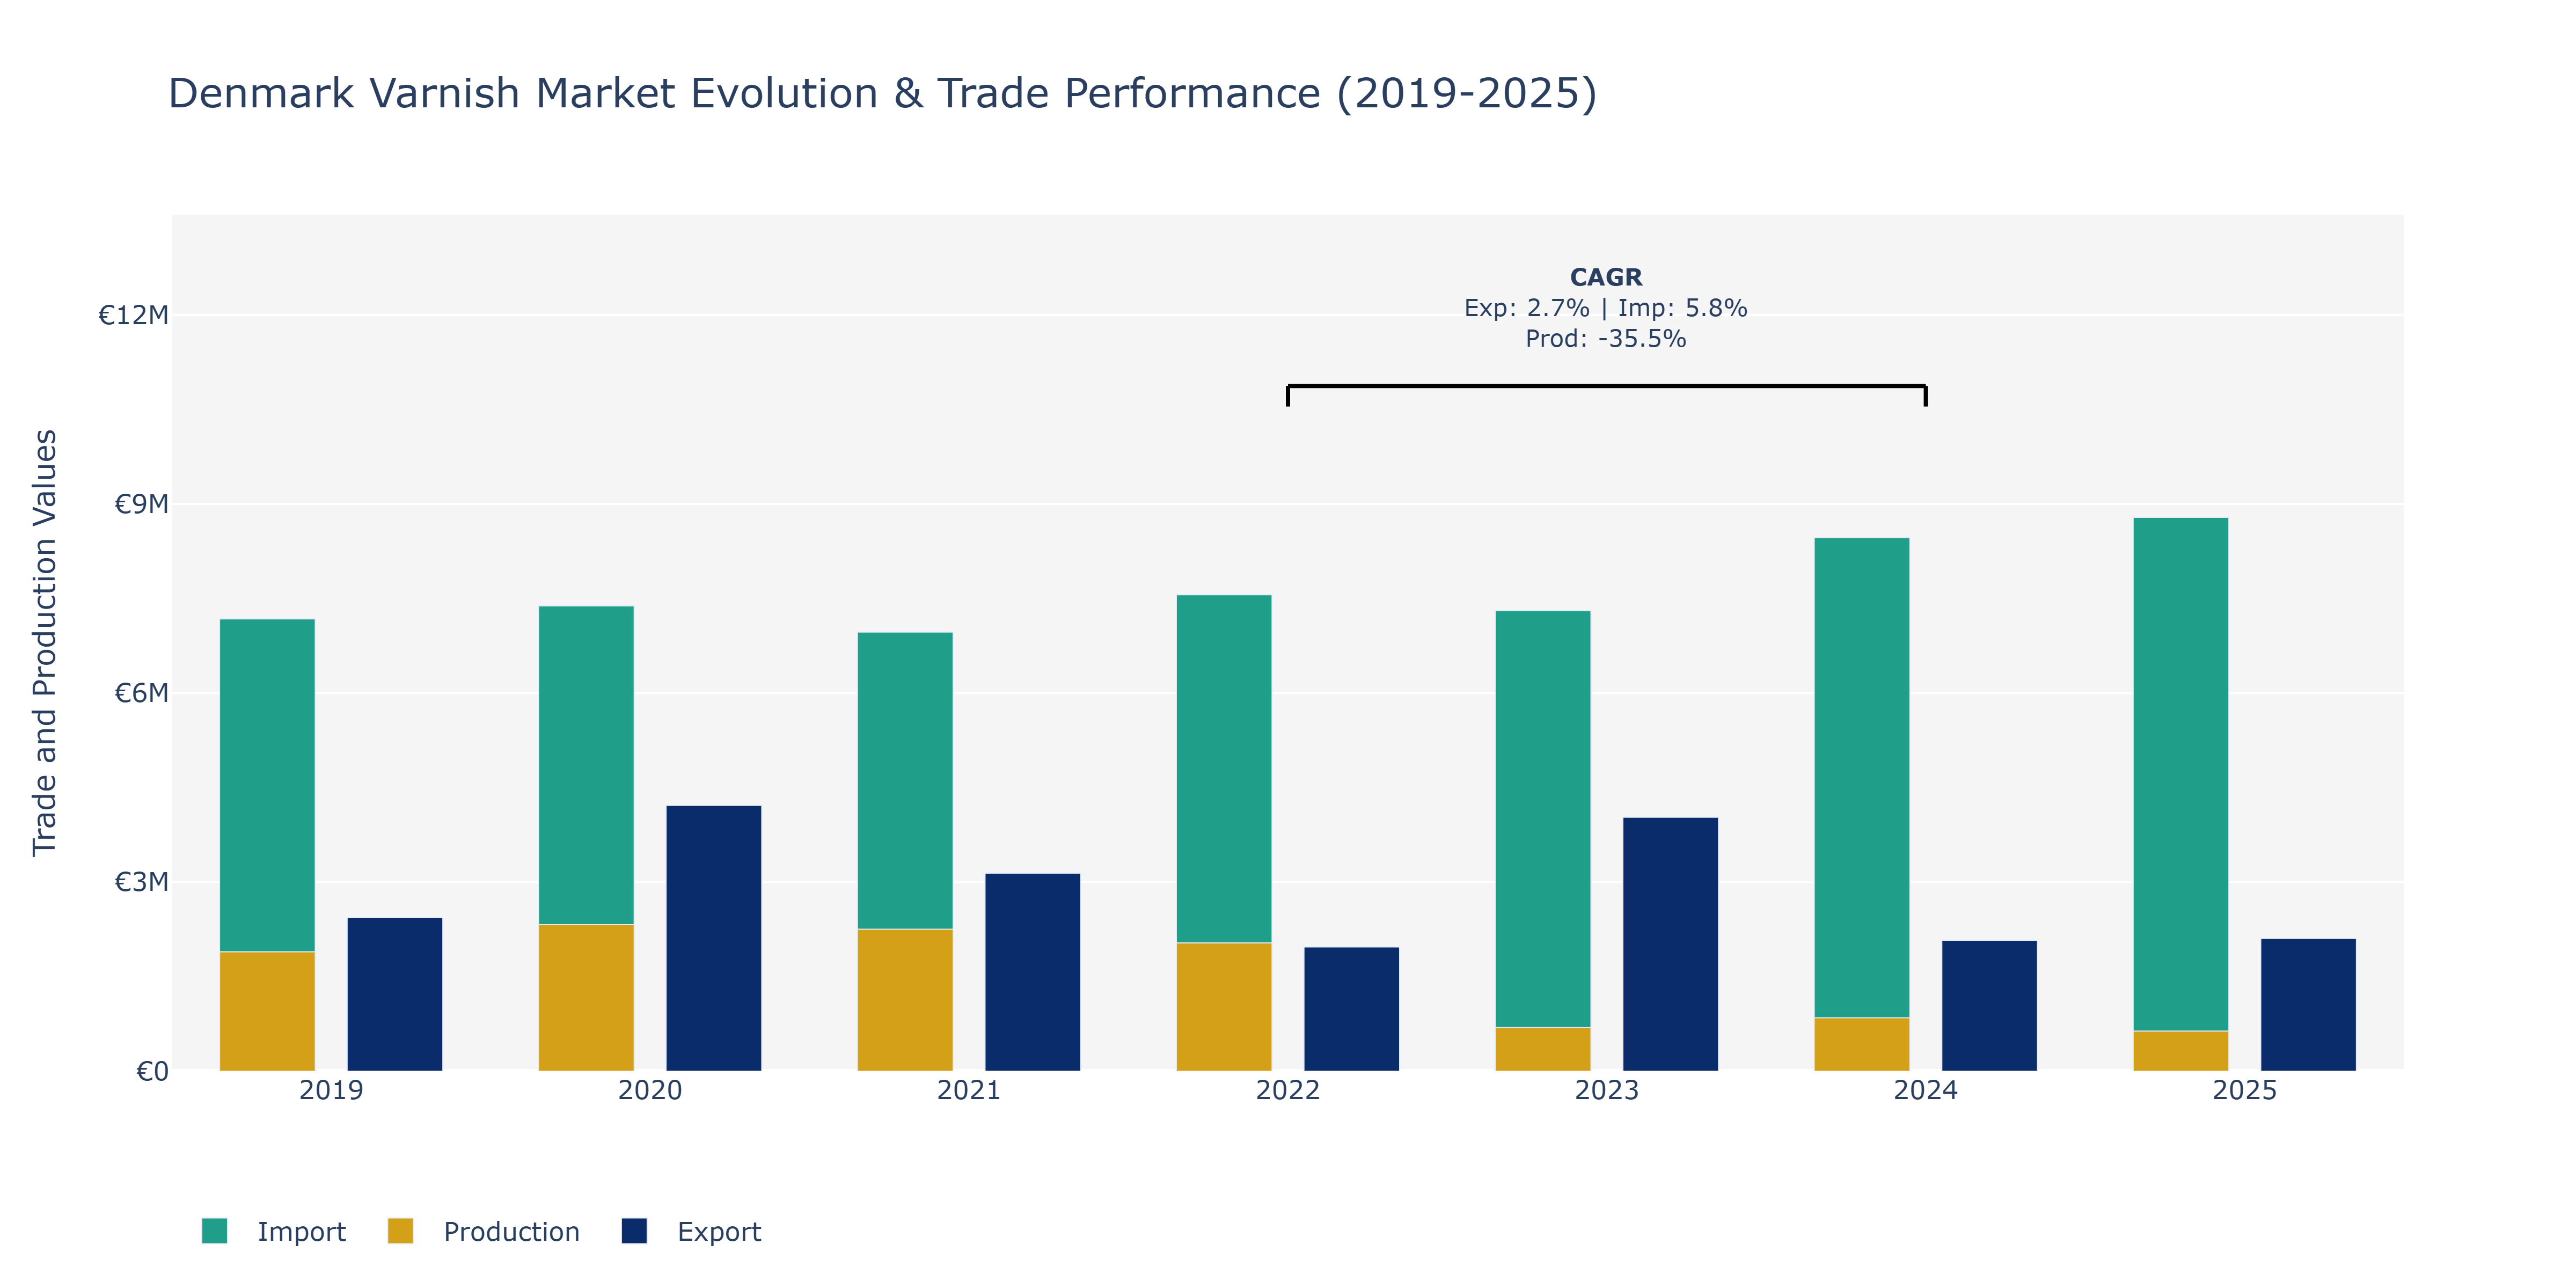
In the Denmark Varnish Market, exports experienced fluctuations over the years, peaking at €4.03 million in 2023 before decreasing to €2.08 million in 2024 and then slightly recovering to €2.11 million in 2025. Imports consistently rose from €7.17 million in 2019 to €8.79 million in 2025, showing a steady upward trend. Production, however, saw a significant decline from €1.89 million in 2019 to €0.64 million in 2025, with a notable drop between 2022 and 2024. The decrease in production could be attributed to shifts in consumer preferences towards more eco-friendly or cost-effective alternatives in the varnish market, impacting domestic manufacturing. On the other hand, the consistent rise in imports suggests a growing demand for varnish products in Denmark, possibly due to increased construction activities or the expansion of the furniture industry, leading to higher import volumes.
Key Highlights of the Report:
- Denmark Varnish Market Outlook
- Market Size of Denmark Varnish Market, 2025
- Forecast of Denmark Varnish Market, 2032
- Historical Data and Forecast of Denmark Varnish Revenues & Volume for the Period 2022 - 2032
- Denmark Varnish Market Trend Evolution
- Denmark Varnish Market Drivers and Challenges
- Denmark Varnish Price Trends
- Denmark Varnish Porter's Five Forces
- Denmark Varnish Industry Life Cycle
- Historical Data and Forecast of Denmark Varnish Market Revenues & Volume By Type for the Period 2022 - 2032
- Historical Data and Forecast of Denmark Varnish Market Revenues & Volume By UV Curable Overprint Varnishes for the Period 2022 - 2032
- Historical Data and Forecast of Denmark Varnish Market Revenues & Volume By Water Based Overprint Varnish for the Period 2022 - 2032
- Historical Data and Forecast of Denmark Varnish Market Revenues & Volume By Application for the Period 2022 - 2032
- Historical Data and Forecast of Denmark Varnish Market Revenues & Volume By Commercial prints for the Period 2022 - 2032
- Historical Data and Forecast of Denmark Varnish Market Revenues & Volume By Food Industry for the Period 2022 - 2032
- Historical Data and Forecast of Denmark Varnish Market Revenues & Volume By Pharmaceuticals for the Period 2022 - 2032
- Historical Data and Forecast of Denmark Varnish Market Revenues & Volume By Others for the Period 2022 - 2032
- Denmark Varnish Import Export Trade Statistics
- Market Opportunity Assessment By Type
- Market Opportunity Assessment By Application
- Denmark Varnish Top Companies Market Share
- Denmark Varnish Competitive Benchmarking By Technical and Operational Parameters
- Denmark Varnish Company Profiles
- Denmark Varnish Key Strategic Recommendations
Frequently Asked Questions About the Market Study (FAQs):
6Wresearch actively monitors the Denmark Varnish Market and publishes its comprehensive annual report, highlighting emerging trends, growth drivers, revenue analysis, and forecast outlook. Our insights help businesses to make data-backed strategic decisions with ongoing market dynamics. Our analysts track relevent industries related to the Denmark Varnish Market, allowing our clients with actionable intelligence and reliable forecasts tailored to emerging regional needs.
Yes, we provide customisation as per your requirements. To learn more, feel free to contact us on sales@6wresearch.com
1 Executive Summary |
2 Introduction |
2.1 Key Highlights of the Report |
2.2 Report Description |
2.3 Market Scope & Segmentation |
2.4 Research Methodology |
2.5 Assumptions |
3 Denmark Varnish Market Overview |
3.1 Denmark Country Macro Economic Indicators |
3.2 Denmark Varnish Market Revenues & Volume, 2022 & 2032F |
3.3 Denmark Varnish Market - Industry Life Cycle |
3.4 Denmark Varnish Market - Porter's Five Forces |
3.5 Denmark Varnish Market Revenues & Volume Share, By Type, 2022 & 2032F |
3.6 Denmark Varnish Market Revenues & Volume Share, By Application, 2022 & 2032F |
4 Denmark Varnish Market Dynamics |
4.1 Impact Analysis |
4.2 Market Drivers |
4.2.1 Growing demand for eco-friendly and sustainable varnish products due to increasing environmental awareness in Denmark. |
4.2.2 Expansion of the construction industry in Denmark, leading to higher demand for varnishes for wood protection and finishing. |
4.2.3 Innovation in varnish technology, such as low-VOC formulations and enhanced durability, driving product development and market growth. |
4.3 Market Restraints |
4.3.1 Fluctuating raw material prices affecting production costs and pricing of varnish products. |
4.3.2 Stringent regulations and standards related to chemicals and emissions impacting the manufacturing and marketing of varnishes in Denmark. |
5 Denmark Varnish Market Trends |
6 Denmark Varnish Market, By Types |
6.1 Denmark Varnish Market, By Type |
6.1.1 Overview and Analysis |
6.1.2 Denmark Varnish Market Revenues & Volume, By Type, 2022 - 2032F |
6.1.3 Denmark Varnish Market Revenues & Volume, By UV Curable Overprint Varnishes, 2022 - 2032F |
6.1.4 Denmark Varnish Market Revenues & Volume, By Water Based Overprint Varnish, 2022 - 2032F |
6.2 Denmark Varnish Market, By Application |
6.2.1 Overview and Analysis |
6.2.2 Denmark Varnish Market Revenues & Volume, By Commercial prints, 2022 - 2032F |
6.2.3 Denmark Varnish Market Revenues & Volume, By Food Industry, 2022 - 2032F |
6.2.4 Denmark Varnish Market Revenues & Volume, By Pharmaceuticals, 2022 - 2032F |
6.2.5 Denmark Varnish Market Revenues & Volume, By Others, 2022 - 2032F |
7 Denmark Varnish Market Import-Export Trade Statistics |
7.1 Denmark Varnish Market Export to Major Countries |
7.2 Denmark Varnish Market Imports from Major Countries |
8 Denmark Varnish Market Key Performance Indicators |
8.1 Percentage of sales attributed to eco-friendly varnish products. |
8.2 Number of new construction projects using varnish products in Denmark. |
8.3 Research and development investment in varnish technology. |
8.4 Customer satisfaction ratings for varnish products in terms of quality and performance. |
8.5 Compliance rate with environmental regulations and standards for varnish manufacturing. |
9 Denmark Varnish Market - Opportunity Assessment |
9.1 Denmark Varnish Market Opportunity Assessment, By Type, 2022 & 2032F |
9.2 Denmark Varnish Market Opportunity Assessment, By Application, 2022 & 2032F |
10 Denmark Varnish Market - Competitive Landscape |
10.1 Denmark Varnish Market Revenue Share, By Companies, 2025 |
10.2 Denmark Varnish Market Competitive Benchmarking, By Operating and Technical Parameters |
11 Company Profiles |
12 Recommendations |
13 Disclaimer |
Export potential assessment - trade Analytics for 2030
Export potential enables firms to identify high-growth global markets with greater confidence by combining advanced trade intelligence with a structured quantitative methodology. The framework analyzes emerging demand trends and country-level import patterns while integrating macroeconomic and trade datasets such as GDP and population forecasts, bilateral import–export flows, tariff structures, elasticity differentials between developed and developing economies, geographic distance, and import demand projections. Using weighted trade values from 2020–2024 as the base period to project country-to-country export potential for 2030, these inputs are operationalized through calculated drivers such as gravity model parameters, tariff impact factors, and projected GDP per-capita growth. Through an analysis of hidden potentials, demand hotspots, and market conditions that are most favorable to success, this method enables firms to focus on target countries, maximize returns, and global expansion with data, backed by accuracy.
By factoring in the projected importer demand gap that is currently unmet and could be potential opportunity, it identifies the potential for the Exporter (Country) among 190 countries, against the general trade analysis, which identifies the biggest importer or exporter.
To discover high-growth global markets and optimize your business strategy:
Click Here
Pricing
- Single User License$ 1,995
- Department License$ 2,400
- Site License$ 3,120
- Global License$ 3,795

Search
Thought Leadership and Analyst Meet


Our Clients
Latest Reports
- France Thermally Conductive Filler Dispersants Market (2026-2032) | Challenges, Restraints, Value, Share, Size, segmentation, Analysis, Trends, Investment Opportunities, Outlook, Pricing, Demand, Forecast, Revenue, Companies, Growth, Drivers, Strategy, Insights, Competition
- Egypt Thermally Conductive Filler Dispersants Market (2026-2032) | Competition, Forecast, Strategy, Value, Insights, Outlook, Investment Opportunities, Pricing, Demand, Share, segmentation, Drivers, Size, Companies, Restraints, Growth, Trends, Revenue, Challenges, Analysis
- Czech Republic Thermally Conductive Filler Dispersants Market (2026-2032) | Forecast, Pricing, Analysis, Drivers, Insights, Size, Demand, Growth, Challenges, segmentation, Competition, Outlook, Trends, Investment Opportunities, Companies, Strategy, Revenue, Share, Value, Restraints
- Colombia Thermally Conductive Filler Dispersants Market (2026-2032) | segmentation, Trends, Share, Drivers, Strategy, Companies, Demand, Insights, Size, Challenges, Value, Competition, Analysis, Growth, Revenue, Restraints, Forecast, Pricing, Outlook, Investment Opportunities
- China Thermally Conductive Filler Dispersants Market (2026-2032) | Restraints, Investment Opportunities, Pricing, Companies, Share, Size, Challenges, Trends, Outlook, Value, Analysis, Competition, Revenue, Drivers, Forecast, Demand, Insights, Growth, Strategy, segmentation
- Chile Thermally Conductive Filler Dispersants Market (2026-2032) | Investment Opportunities, Trends, Value, Restraints, Share, Companies, Forecast, segmentation, Pricing, Challenges, Demand, Size, Analysis, Drivers, Outlook, Growth, Competition, Strategy, Revenue, Insights
- Cambodia Thermally Conductive Filler Dispersants Market (2026-2032) | Analysis, Share, Outlook, Strategy, Pricing, Demand, Size, Growth, segmentation, Insights, Revenue, Forecast, Challenges, Competition, Companies, Investment Opportunities, Trends, Restraints, Value, Drivers
- Brazil Thermally Conductive Filler Dispersants Market (2026-2032) | Restraints, Forecast, Competition, Size, Revenue, Value, Investment Opportunities, Trends, Insights, Outlook, Growth, Analysis, Drivers, segmentation, Pricing, Challenges, Strategy, Share, Companies, Demand
- Bangladesh Thermally Conductive Filler Dispersants Market (2026-2032) | Restraints, Trends, Analysis, Competition, Insights, Forecast, Value, Investment Opportunities, Pricing, Share, Demand, Outlook, Revenue, segmentation, Companies, Drivers, Growth, Size, Challenges, Strategy
- Bahrain Thermally Conductive Filler Dispersants Market (2026-2032) | Trends, Outlook, Pricing, Demand, Value, Competition, Forecast, Growth, segmentation, Revenue, Companies, Analysis, Insights, Size, Drivers, Challenges, Strategy, Investment Opportunities, Share, Restraints
Industry Events and Analyst Meet

HIMTEX 2026

India Refining Summit 2026

India EV Show 2026

EV tech India Expo 2026

Auto Tech Asia 2026
Whitepaper
- Middle East & Africa Commercial Security Market Click here to view more.
- Middle East & Africa Fire Safety Systems & Equipment Market Click here to view more.
- GCC Drone Market Click here to view more.
- Middle East Lighting Fixture Market Click here to view more.
- GCC Physical & Perimeter Security Market Click here to view more.
6WResearch In News
- Doha a strategic location for EV manufacturing hub: IPA Qatar
- Demand for luxury TVs surging in the GCC, says Samsung
- Empowering Growth: The Thriving Journey of Bangladesh’s Cable Industry
- Demand for luxury TVs surging in the GCC, says Samsung
- Video call with a traditional healer? Once unthinkable, it’s now common in South Africa
- Intelligent Buildings To Smooth GCC’s Path To Net Zero