Ecuador Mica Market (2025-2031) | Segmentation, Value, Share, Outlook, Revenue, Size, Trends, Forecast, Analysis, Industry, Companies & Growth
Market Forecast By Type (Natural, Synthetic), By Grade (Ground Mica, Sheet Mica, Built-Up Mica), By End-user (Paints & Coatings, Electronics, Construction, Cosmetics, Others) And Competitive Landscape
| Product Code: ETC4815426 | Publication Date: Nov 2023 | Updated Date: Oct 2025 | Product Type: Market Research Report | |
| Publisher: 6Wresearch | Author: Sachin Kumar Rai | No. of Pages: 60 | No. of Figures: 30 | No. of Tables: 5 |
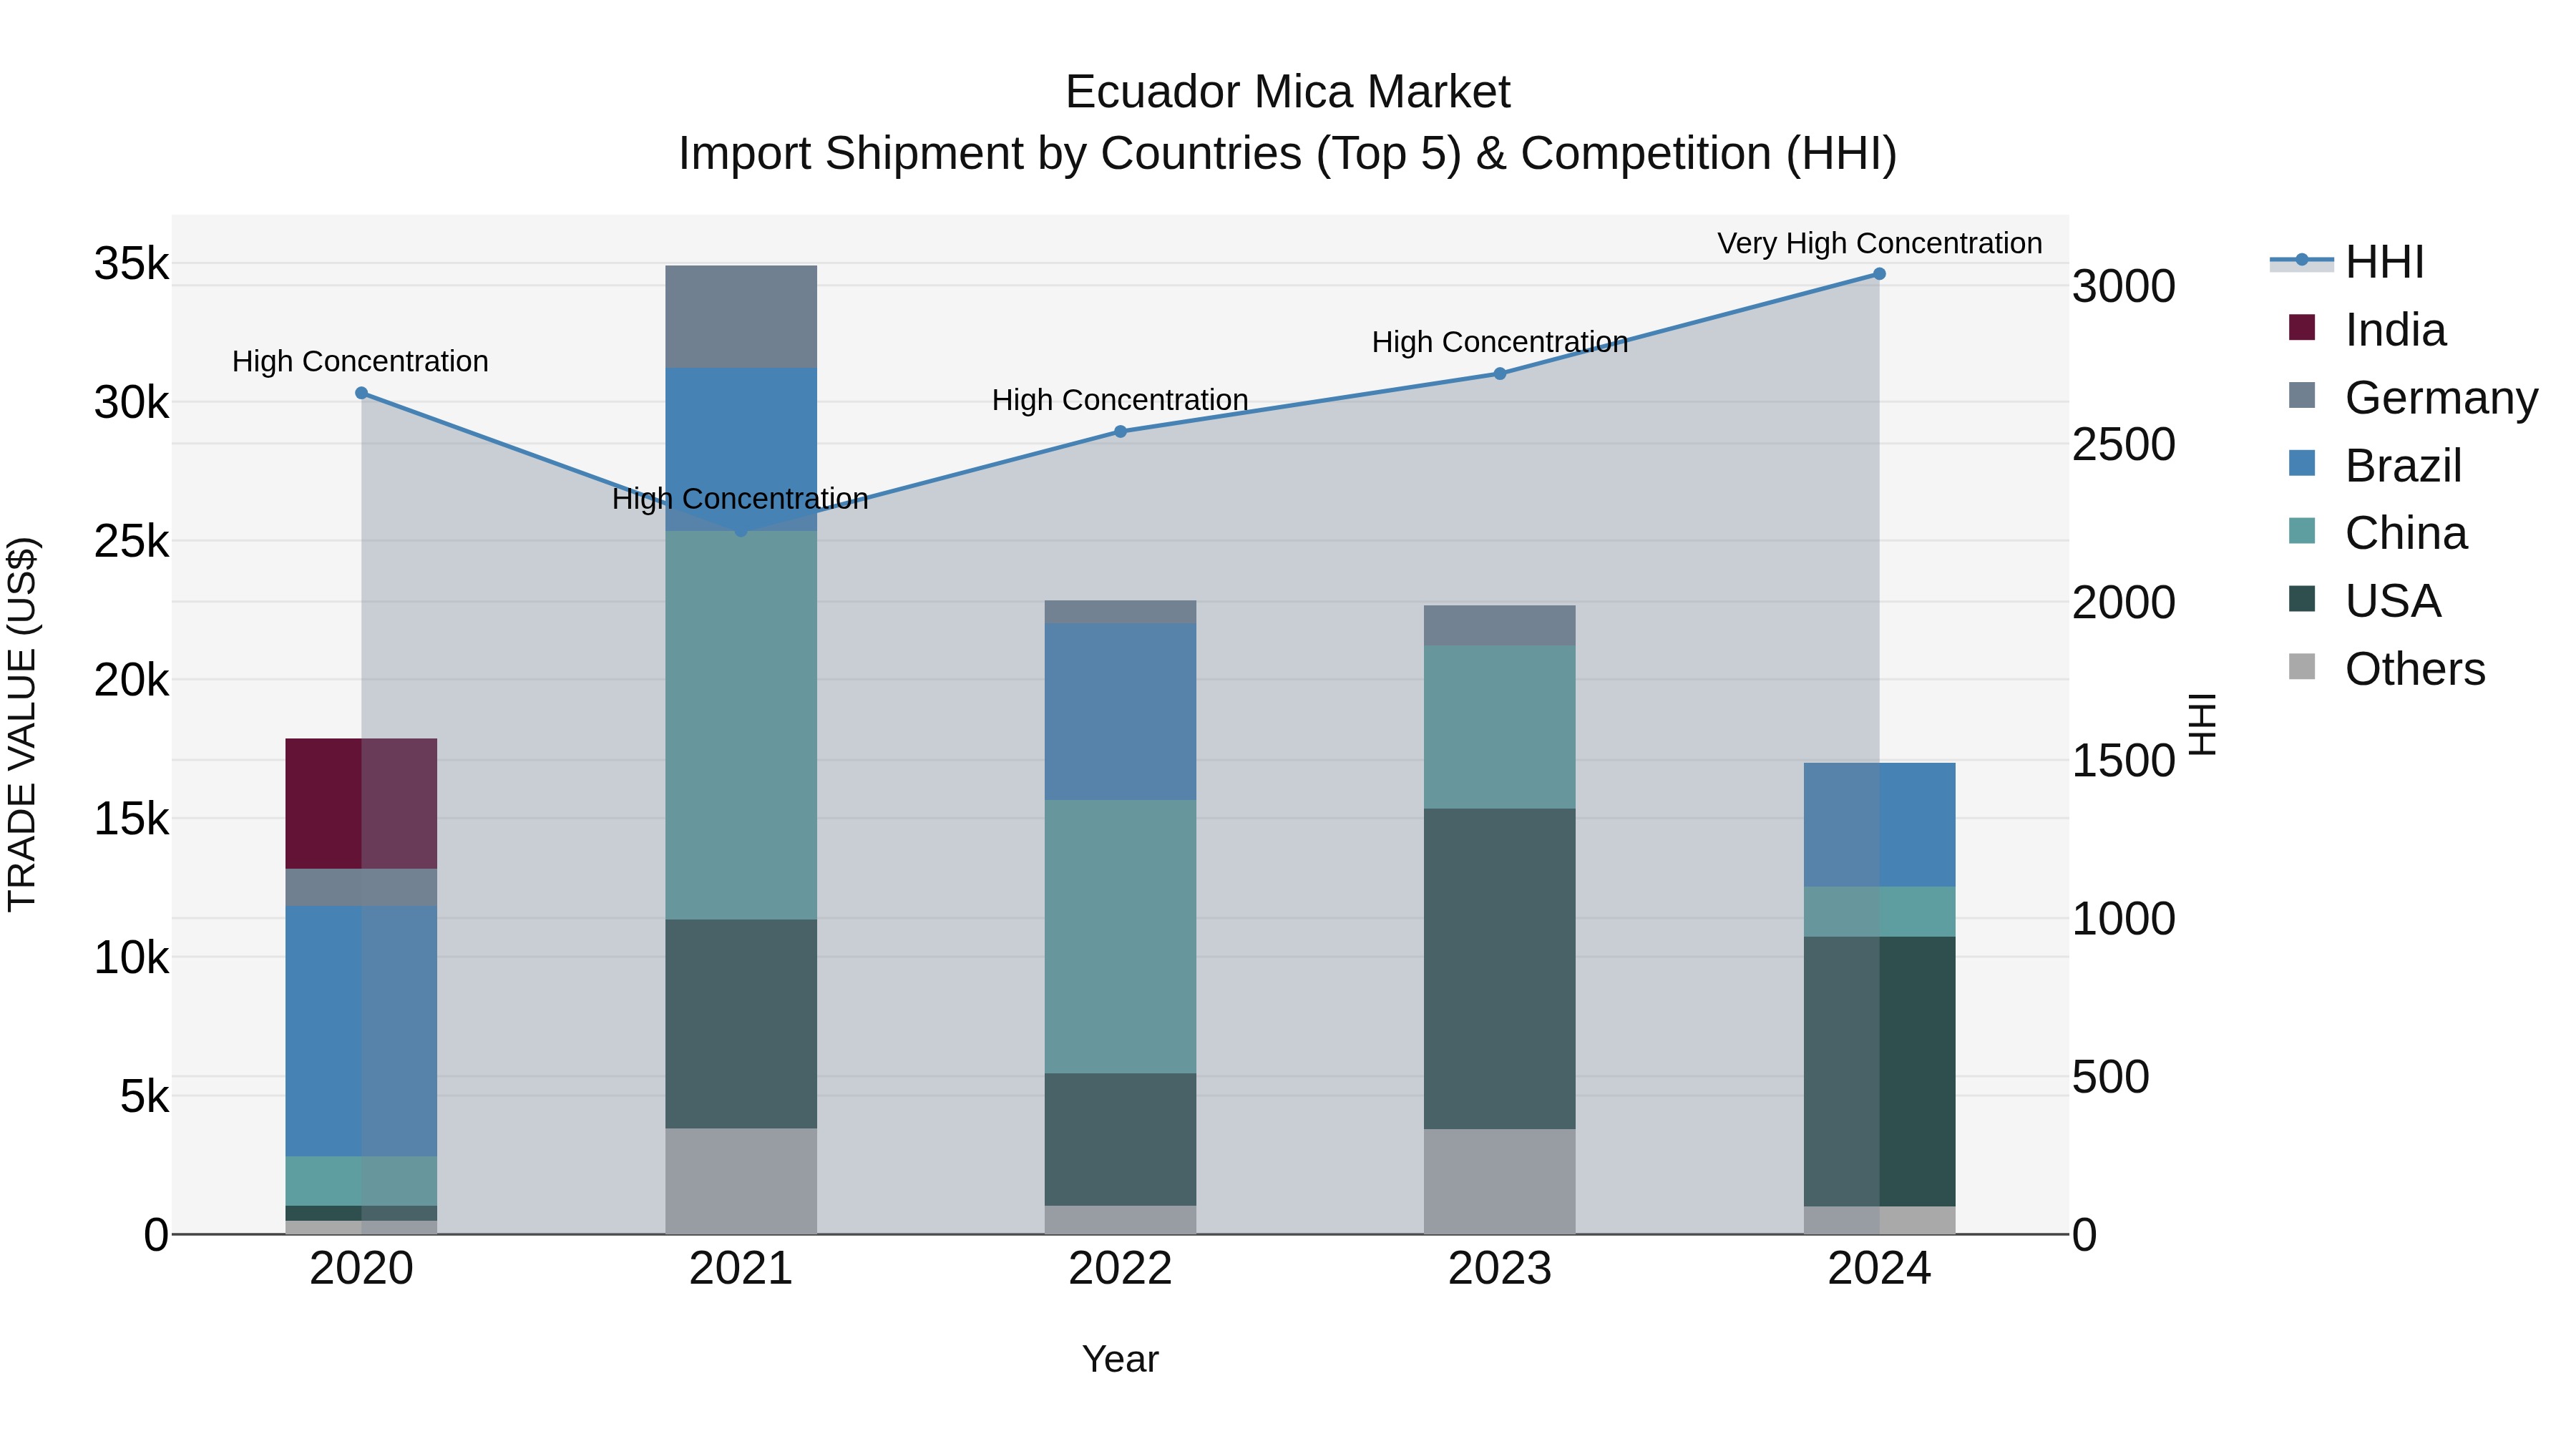
Ecuador Mica Market Top 5 Importing Countries and Market Competition (HHI) Analysis
Ecuador`s mica import shipments in 2024 continued to be dominated by top exporting countries such as USA, Brazil, China, Colombia, and Hong Kong. Despite a consistently high concentration level indicated by the HHI, the industry experienced a slight decline with a CAGR of -1.24% from 2020 to 2024. Notably, the growth rate from 2023 to 2024 saw a significant drop of -25.0%, reflecting potential challenges faced by the Market Top 5 Importing Countries and Market Competition (HHI) Analysis during this period. It will be interesting to monitor how these trends evolve in the coming years.
Ecuador Mica Market Overview
The mica market in Ecuador provides materials used in electronics, cosmetics, and construction. Micas heat resistance and electrical insulation properties make it valuable in applications like insulation materials and makeup products.
Drivers of the market
The mica market in Ecuador is driven by the growing demand for this mineral in cosmetics, electronics, and construction applications. As industries seek high-quality, natural materials for their products, the use of mica becomes essential for enhancing aesthetics and performance. The increasing focus on sustainability and the trend towards natural ingredients in cosmetics further support market growth, as manufacturers innovate to develop mica-based formulations that meet consumer preferences.
Challenges of the market
The mica market in Ecuador encounters challenges related to supply chain transparency and ethical sourcing, as concerns over child labor and unsafe mining practices have come to the forefront. Regulatory pressures to ensure sustainable and responsible sourcing practices can increase operational costs for producers. Additionally, competition from synthetic alternatives and fluctuating demand from industries such as cosmetics and electronics complicate market dynamics.
Government Policy of the market
The mica market in Ecuador benefits from government initiatives that promote sustainable mining practices and the use of natural minerals in cosmetics and industrial applications. Policies encouraging responsible sourcing and ethical production drive demand for mica as a key ingredient. The government supports local mining operations while implementing regulations to ensure environmental protection and community welfare.
Key Highlights of the Report:
- Ecuador Mica Market Outlook
- Market Size of Ecuador Mica Market, 2024
- Forecast of Ecuador Mica Market, 2031
- Historical Data and Forecast of Ecuador Mica Revenues & Volume for the Period 2021-2031
- Ecuador Mica Market Trend Evolution
- Ecuador Mica Market Drivers and Challenges
- Ecuador Mica Price Trends
- Ecuador Mica Porter`s Five Forces
- Ecuador Mica Industry Life Cycle
- Historical Data and Forecast of Ecuador Mica Market Revenues & Volume By Type for the Period 2021-2031
- Historical Data and Forecast of Ecuador Mica Market Revenues & Volume By Natural for the Period 2021-2031
- Historical Data and Forecast of Ecuador Mica Market Revenues & Volume By Synthetic for the Period 2021-2031
- Historical Data and Forecast of Ecuador Mica Market Revenues & Volume By Grade for the Period 2021-2031
- Historical Data and Forecast of Ecuador Mica Market Revenues & Volume By Ground Mica for the Period 2021-2031
- Historical Data and Forecast of Ecuador Mica Market Revenues & Volume By Sheet Mica for the Period 2021-2031
- Historical Data and Forecast of Ecuador Mica Market Revenues & Volume By Built-Up Mica for the Period 2021-2031
- Historical Data and Forecast of Ecuador Mica Market Revenues & Volume By End-user for the Period 2021-2031
- Historical Data and Forecast of Ecuador Mica Market Revenues & Volume By Paints & Coatings for the Period 2021-2031
- Historical Data and Forecast of Ecuador Mica Market Revenues & Volume By Electronics for the Period 2021-2031
- Historical Data and Forecast of Ecuador Mica Market Revenues & Volume By Construction for the Period 2021-2031
- Historical Data and Forecast of Ecuador Mica Market Revenues & Volume By Cosmetics for the Period 2021-2031
- Historical Data and Forecast of Ecuador Mica Market Revenues & Volume By Others for the Period 2021-2031
- Ecuador Mica Import Export Trade Statistics
- Market Opportunity Assessment By Type
- Market Opportunity Assessment By Grade
- Market Opportunity Assessment By End-user
- Ecuador Mica Top Companies Market Share
- Ecuador Mica Competitive Benchmarking By Technical and Operational Parameters
- Ecuador Mica Company Profiles
- Ecuador Mica Key Strategic Recommendations
Frequently Asked Questions About the Market Study (FAQs):
6Wresearch actively monitors the Ecuador Mica Market and publishes its comprehensive annual report, highlighting emerging trends, growth drivers, revenue analysis, and forecast outlook. Our insights help businesses to make data-backed strategic decisions with ongoing market dynamics. Our analysts track relevent industries related to the Ecuador Mica Market, allowing our clients with actionable intelligence and reliable forecasts tailored to emerging regional needs.
Yes, we provide customisation as per your requirements. To learn more, feel free to contact us on sales@6wresearch.com
1 Executive Summary |
2 Introduction |
2.1 Key Highlights of the Report |
2.2 Report Description |
2.3 Market Scope & Segmentation |
2.4 Research Methodology |
2.5 Assumptions |
3 Ecuador Mica Market Overview |
3.1 Ecuador Country Macro Economic Indicators |
3.2 Ecuador Mica Market Revenues & Volume, 2021 & 2031F |
3.3 Ecuador Mica Market - Industry Life Cycle |
3.4 Ecuador Mica Market - Porter's Five Forces |
3.5 Ecuador Mica Market Revenues & Volume Share, By Type, 2021 & 2031F |
3.6 Ecuador Mica Market Revenues & Volume Share, By Grade, 2021 & 2031F |
3.7 Ecuador Mica Market Revenues & Volume Share, By End-user, 2021 & 2031F |
4 Ecuador Mica Market Dynamics |
4.1 Impact Analysis |
4.2 Market Drivers |
4.2.1 Growing demand for cosmetics and personal care products containing mica |
4.2.2 Increasing use of mica in the electronics industry for insulating materials |
4.2.3 Rising awareness about the benefits of natural mica over synthetic alternatives |
4.3 Market Restraints |
4.3.1 Fluctuating prices of raw mica due to supply chain disruptions |
4.3.2 Environmental concerns related to mica mining practices |
4.3.3 Competition from alternative materials like synthetic mica substitutes |
5 Ecuador Mica Market Trends |
6 Ecuador Mica Market Segmentations |
6.1 Ecuador Mica Market, By Type |
6.1.1 Overview and Analysis |
6.1.2 Ecuador Mica Market Revenues & Volume, By Natural, 2021-2031F |
6.1.3 Ecuador Mica Market Revenues & Volume, By Synthetic, 2021-2031F |
6.2 Ecuador Mica Market, By Grade |
6.2.1 Overview and Analysis |
6.2.2 Ecuador Mica Market Revenues & Volume, By Ground Mica, 2021-2031F |
6.2.3 Ecuador Mica Market Revenues & Volume, By Sheet Mica, 2021-2031F |
6.2.4 Ecuador Mica Market Revenues & Volume, By Built-Up Mica, 2021-2031F |
6.3 Ecuador Mica Market, By End-user |
6.3.1 Overview and Analysis |
6.3.2 Ecuador Mica Market Revenues & Volume, By Paints & Coatings, 2021-2031F |
6.3.3 Ecuador Mica Market Revenues & Volume, By Electronics, 2021-2031F |
6.3.4 Ecuador Mica Market Revenues & Volume, By Construction, 2021-2031F |
6.3.5 Ecuador Mica Market Revenues & Volume, By Cosmetics, 2021-2031F |
6.3.6 Ecuador Mica Market Revenues & Volume, By Others, 2021-2031F |
7 Ecuador Mica Market Import-Export Trade Statistics |
7.1 Ecuador Mica Market Export to Major Countries |
7.2 Ecuador Mica Market Imports from Major Countries |
8 Ecuador Mica Market Key Performance Indicators |
8.1 Number of new product launches in the cosmetics and personal care sector using mica |
8.2 Percentage of electronics manufacturers using mica in their products |
8.3 Adoption rate of sustainable mica sourcing practices by mica mining companies |
9 Ecuador Mica Market - Opportunity Assessment |
9.1 Ecuador Mica Market Opportunity Assessment, By Type, 2021 & 2031F |
9.2 Ecuador Mica Market Opportunity Assessment, By Grade, 2021 & 2031F |
9.3 Ecuador Mica Market Opportunity Assessment, By End-user, 2021 & 2031F |
10 Ecuador Mica Market - Competitive Landscape |
10.1 Ecuador Mica Market Revenue Share, By Companies, 2024 |
10.2 Ecuador Mica Market Competitive Benchmarking, By Operating and Technical Parameters |
11 Company Profiles |
12 Recommendations | 13 Disclaimer |
Global Go To Market Strategy - 2030
Export potential enables firms to identify high-growth global markets with greater confidence by combining advanced trade intelligence with a structured quantitative methodology. The framework analyzes emerging demand trends and country-level import patterns while integrating macroeconomic and trade datasets such as GDP and population forecasts, bilateral import–export flows, tariff structures, elasticity differentials between developed and developing economies, geographic distance, and import demand projections. Using weighted trade values from 2020–2024 as the base period to project country-to-country export potential for 2030, these inputs are operationalized through calculated drivers such as gravity model parameters, tariff impact factors, and projected GDP per-capita growth. Through an analysis of hidden potentials, demand hotspots, and market conditions that are most favorable to success, this method enables firms to focus on target countries, maximize returns, and global expansion with data, backed by accuracy.
By factoring in the projected importer demand gap that is currently unmet and could be potential opportunity, it identifies the potential for the Exporter (Country) among 190 countries, against the general trade analysis, which identifies the biggest importer or exporter.
To discover high-growth global markets and optimize your business strategy:
Click Here
Pricing
- Single User License$ 1,995
- Department License$ 2,400
- Site License$ 3,120
- Global License$ 3,795

Leadership Perspectives from Industry Events
Search
Thought Leadership and Analyst Meet


Our Clients
6WResearch In News
- Doha a strategic location for EV manufacturing hub: IPA Qatar
- Demand for luxury TVs surging in the GCC, says Samsung
- Empowering Growth: The Thriving Journey of Bangladesh’s Cable Industry
- Demand for luxury TVs surging in the GCC, says Samsung
- Video call with a traditional healer? Once unthinkable, it’s now common in South Africa
- Intelligent Buildings To Smooth GCC’s Path To Net Zero
Latest Reports
- Taiwan Airport Wireless Infrastructure Market (2026-2032)
- Vietnam Airport Wireless Infrastructure Market (2026-2032)
- Thailand Airport Wireless Infrastructure Market (2026-2032)
- South Korea Airport Wireless Infrastructure Market (2026-2032)
- Romania Airport Wireless Infrastructure Market (2026-2032)
- Qatar Airport Wireless Infrastructure Market (2026-2032)
- Philippines Airport Wireless Infrastructure Market (2026-2032)
- Japan Airport Wireless Infrastructure Market (2026-2032)
- Taiwan Airport Winter Services Market (2026-2032)
- Vietnam Airport Winter Services Market (2026-2032)
Industry Events and Analyst Meet

HIMTEX 2026

India Refining Summit 2026

India EV Show 2026

EV tech India Expo 2026

Auto Tech Asia 2026
Whitepaper
- Middle East & Africa Commercial Security Market Click here to view more.
- Middle East & Africa Fire Safety Systems & Equipment Market Click here to view more.
- GCC Drone Market Click here to view more.
- Middle East Lighting Fixture Market Click here to view more.
- GCC Physical & Perimeter Security Market Click here to view more.