El Salvador Friction Materials Market (2026-2032) | Segmentation, Growth, Value, Forecast, Trends, Revenue, Companies, Share, Outlook, Analysis, Size & Industry
Market Forecast By Product (Lining, Pads, Blocks, Discs, Others), By Business Type (OE, Aftersales), By Application (Brakes, Clutches, Industrial Brake & Transmission Systems), By End-Use Industry (Automotive, Railway, Construction, Aerospace & Marine, Others) And Competitive Landscape
| Product Code: ETC5146331 | Publication Date: Nov 2023 | Updated Date: Apr 2026 | Product Type: Market Research Report | |
| Publisher: 6Wresearch | Author: Shubham Padhi | No. of Pages: 60 | No. of Figures: 30 | No. of Tables: 5 |
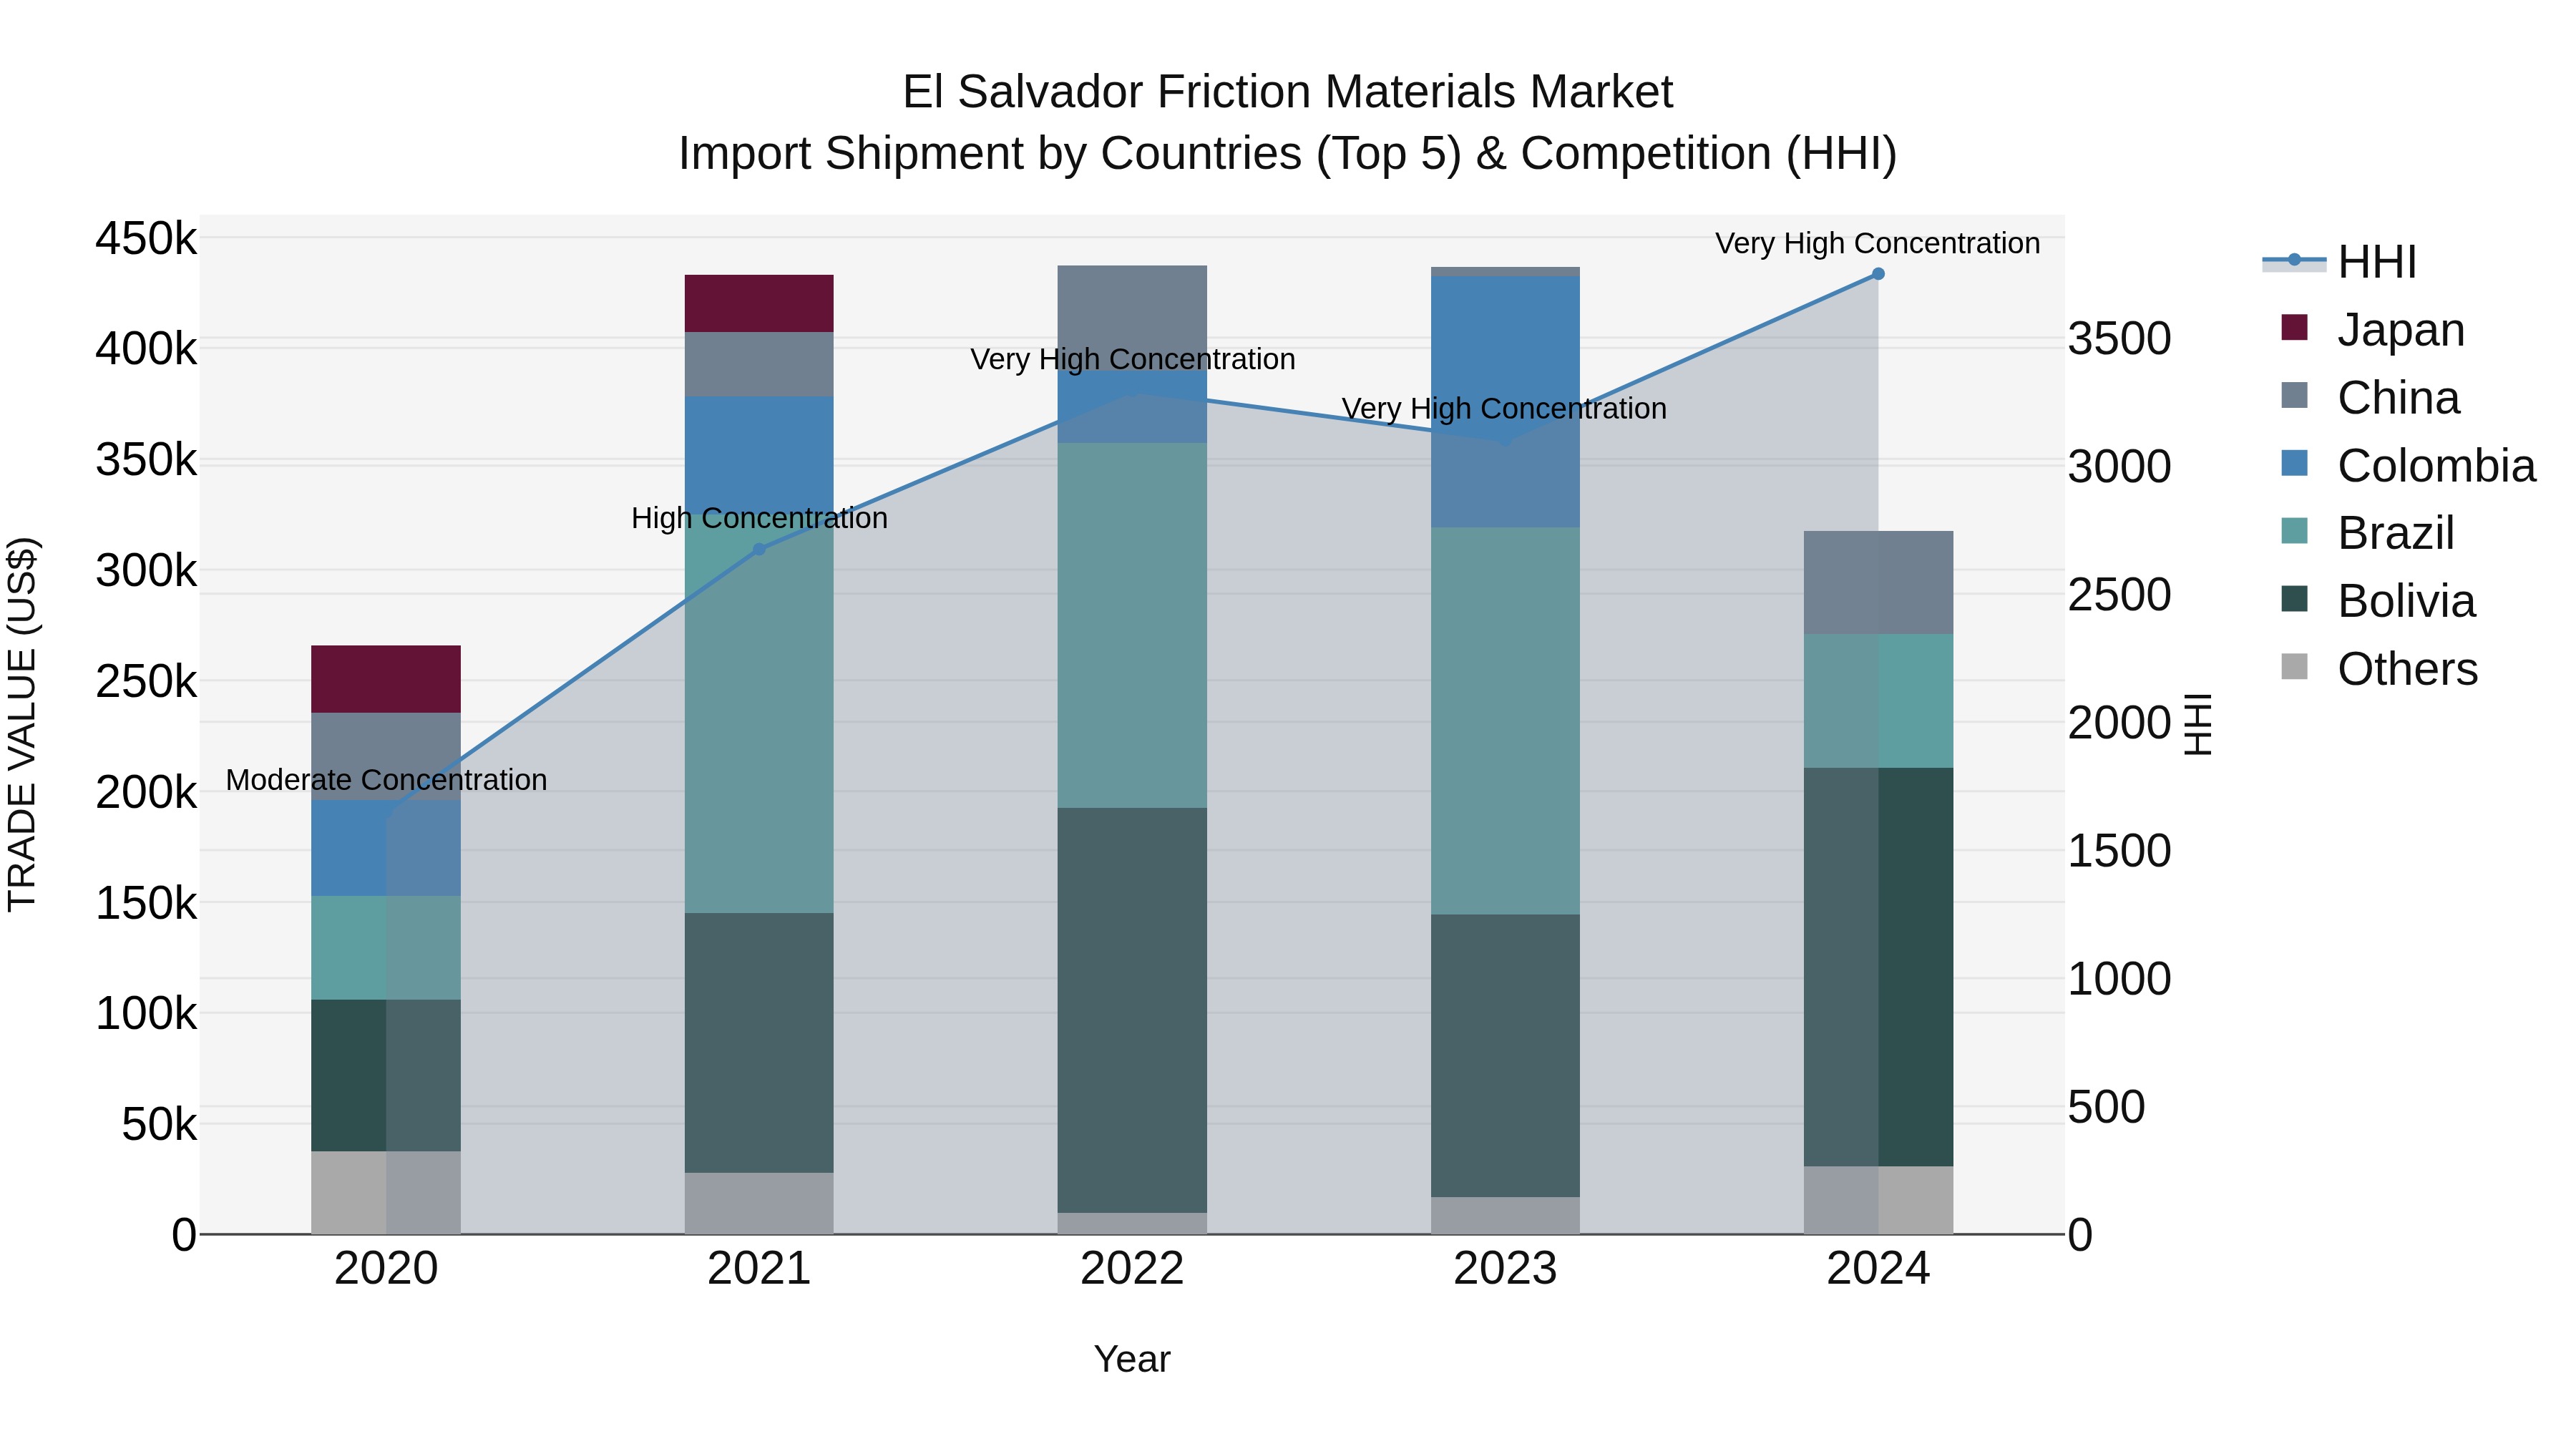
El Salvador Friction Materials Market Top 5 Importing Countries and Market Competition (HHI) Analysis
Despite a significant drop in growth rate from 2023 to 2024, the market for friction materials imports in El Salvador continues to be dominated by a few key exporting countries. The High Herfindahl-Hirschman Index (HHI) indicates a high concentration of imports from top players like Bolivia, Brazil, China, Indonesia, and the USA. With a moderate compound annual growth rate (CAGR) of 4.53% from 2020 to 2024, it suggests a steady but competitive market landscape for friction materials in El Salvador.
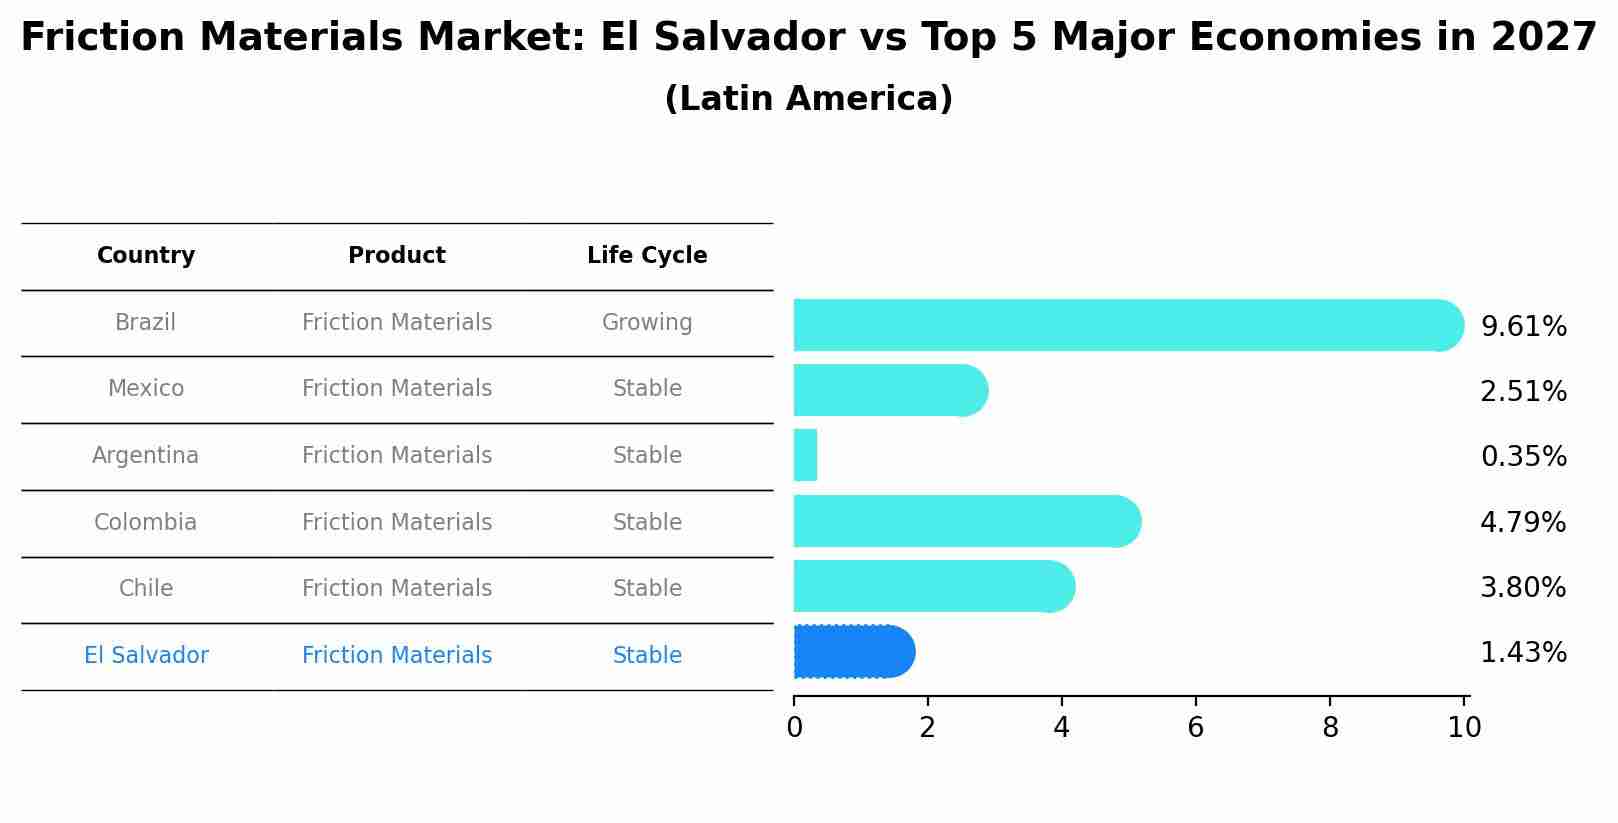
Friction Materials Market: El Salvador vs Top 5 Major Economies in 2027 (Latin America)
El Salvador's Friction Materials market is anticipated to experience a stable growth rate of 1.43% by 2027, reflecting trends observed in the largest economy Brazil, followed by Mexico, Argentina, Colombia and Chile.
Key Highlights of the Report:
- El Salvador Friction Materials Market Outlook
- Market Size of El Salvador Friction Materials Market, 2025
- Forecast of El Salvador Friction Materials Market, 2032
- Historical Data and Forecast of El Salvador Friction Materials Revenues & Volume for the Period 2022 - 2032F
- El Salvador Friction Materials Market Trend Evolution
- El Salvador Friction Materials Market Drivers and Challenges
- El Salvador Friction Materials Price Trends
- El Salvador Friction Materials Porter`s Five Forces
- El Salvador Friction Materials Industry Life Cycle
- Historical Data and Forecast of El Salvador Friction Materials Market Revenues & Volume By Product for the Period 2022 - 2032F
- Historical Data and Forecast of El Salvador Friction Materials Market Revenues & Volume By Lining for the Period 2022 - 2032F
- Historical Data and Forecast of El Salvador Friction Materials Market Revenues & Volume By Pads for the Period 2022 - 2032F
- Historical Data and Forecast of El Salvador Friction Materials Market Revenues & Volume By Blocks for the Period 2022 - 2032F
- Historical Data and Forecast of El Salvador Friction Materials Market Revenues & Volume By Discs for the Period 2022 - 2032F
- Historical Data and Forecast of El Salvador Friction Materials Market Revenues & Volume By Others for the Period 2022 - 2032F
- Historical Data and Forecast of El Salvador Friction Materials Market Revenues & Volume By Business Type for the Period 2022 - 2032F
- Historical Data and Forecast of El Salvador Friction Materials Market Revenues & Volume By OE for the Period 2022 - 2032F
- Historical Data and Forecast of El Salvador Friction Materials Market Revenues & Volume By Aftersales for the Period 2022 - 2032F
- Historical Data and Forecast of El Salvador Friction Materials Market Revenues & Volume By Application for the Period 2022 - 2032F
- Historical Data and Forecast of El Salvador Friction Materials Market Revenues & Volume By Brakes for the Period 2022 - 2032F
- Historical Data and Forecast of El Salvador Friction Materials Market Revenues & Volume By Clutches for the Period 2022 - 2032F
- Historical Data and Forecast of El Salvador Friction Materials Market Revenues & Volume By Industrial Brake & Transmission Systems for the Period 2022 - 2032F
- Historical Data and Forecast of El Salvador Friction Materials Market Revenues & Volume By End-Use Industry for the Period 2022 - 2032F
- Historical Data and Forecast of El Salvador Friction Materials Market Revenues & Volume By Automotive for the Period 2022 - 2032F
- Historical Data and Forecast of El Salvador Friction Materials Market Revenues & Volume By Railway for the Period 2022 - 2032F
- Historical Data and Forecast of El Salvador Friction Materials Market Revenues & Volume By Construction for the Period 2022 - 2032F
- Historical Data and Forecast of El Salvador Friction Materials Market Revenues & Volume By Aerospace & Marine for the Period 2022 - 2032F
- Historical Data and Forecast of El Salvador Friction Materials Market Revenues & Volume By Others for the Period 2022 - 2032F
- El Salvador Friction Materials Import Export Trade Statistics
- Market Opportunity Assessment By Product
- Market Opportunity Assessment By Business Type
- Market Opportunity Assessment By Application
- Market Opportunity Assessment By End-Use Industry
- El Salvador Friction Materials Top Companies Market Share
- El Salvador Friction Materials Competitive Benchmarking By Technical and Operational Parameters
- El Salvador Friction Materials Company Profiles
- El Salvador Friction Materials Key Strategic Recommendations
Frequently Asked Questions About the Market Study (FAQs):
6Wresearch actively monitors the El Salvador Friction Materials Market and publishes its comprehensive annual report, highlighting emerging trends, growth drivers, revenue analysis, and forecast outlook. Our insights help businesses to make data-backed strategic decisions with ongoing market dynamics. Our analysts track relevent industries related to the El Salvador Friction Materials Market, allowing our clients with actionable intelligence and reliable forecasts tailored to emerging regional needs.
Yes, we provide customisation as per your requirements. To learn more, feel free to contact us on sales@6wresearch.com
1 Executive Summary |
2 Introduction |
2.1 Key Highlights of the Report |
2.2 Report Description |
2.3 Market Scope & Segmentation |
2.4 Research Methodology |
2.5 Assumptions |
3 El Salvador Friction Materials Market Overview |
3.1 El Salvador Country Macro Economic Indicators |
3.2 El Salvador Friction Materials Market Revenues & Volume, 2022 & 2032F |
3.3 El Salvador Friction Materials Market - Industry Life Cycle |
3.4 El Salvador Friction Materials Market - Porter's Five Forces |
3.5 El Salvador Friction Materials Market Revenues & Volume Share, By Product, 2022 & 2032F |
3.6 El Salvador Friction Materials Market Revenues & Volume Share, By Business Type, 2022 & 2032F |
3.7 El Salvador Friction Materials Market Revenues & Volume Share, By Application, 2022 & 2032F |
3.8 El Salvador Friction Materials Market Revenues & Volume Share, By End-Use Industry, 2022 & 2032F |
4 El Salvador Friction Materials Market Dynamics |
4.1 Impact Analysis |
4.2 Market Drivers |
4.2.1 Increasing demand for automotive vehicles in El Salvador |
4.2.2 Growing focus on vehicle safety and maintenance |
4.2.3 Rise in industrial activities leading to higher demand for friction materials |
4.3 Market Restraints |
4.3.1 Fluctuating raw material prices impacting manufacturing costs |
4.3.2 Competition from low-cost alternatives |
4.3.3 Economic downturn affecting consumer spending on automotive maintenance |
5 El Salvador Friction Materials Market Trends |
6 El Salvador Friction Materials Market Segmentations |
6.1 El Salvador Friction Materials Market, By Product |
6.1.1 Overview and Analysis |
6.1.2 El Salvador Friction Materials Market Revenues & Volume, By Lining, 2022 - 2032F |
6.1.3 El Salvador Friction Materials Market Revenues & Volume, By Pads, 2022 - 2032F |
6.1.4 El Salvador Friction Materials Market Revenues & Volume, By Blocks, 2022 - 2032F |
6.1.5 El Salvador Friction Materials Market Revenues & Volume, By Discs, 2022 - 2032F |
6.1.6 El Salvador Friction Materials Market Revenues & Volume, By Others, 2022 - 2032F |
6.2 El Salvador Friction Materials Market, By Business Type |
6.2.1 Overview and Analysis |
6.2.2 El Salvador Friction Materials Market Revenues & Volume, By OE, 2022 - 2032F |
6.2.3 El Salvador Friction Materials Market Revenues & Volume, By Aftersales, 2022 - 2032F |
6.3 El Salvador Friction Materials Market, By Application |
6.3.1 Overview and Analysis |
6.3.2 El Salvador Friction Materials Market Revenues & Volume, By Brakes, 2022 - 2032F |
6.3.3 El Salvador Friction Materials Market Revenues & Volume, By Clutches, 2022 - 2032F |
6.3.4 El Salvador Friction Materials Market Revenues & Volume, By Industrial Brake & Transmission Systems, 2022 - 2032F |
6.4 El Salvador Friction Materials Market, By End-Use Industry |
6.4.1 Overview and Analysis |
6.4.2 El Salvador Friction Materials Market Revenues & Volume, By Automotive, 2022 - 2032F |
6.4.3 El Salvador Friction Materials Market Revenues & Volume, By Railway, 2022 - 2032F |
6.4.4 El Salvador Friction Materials Market Revenues & Volume, By Construction, 2022 - 2032F |
6.4.5 El Salvador Friction Materials Market Revenues & Volume, By Aerospace & Marine, 2022 - 2032F |
6.4.6 El Salvador Friction Materials Market Revenues & Volume, By Others, 2022 - 2032F |
7 El Salvador Friction Materials Market Import-Export Trade Statistics |
7.1 El Salvador Friction Materials Market Export to Major Countries |
7.2 El Salvador Friction Materials Market Imports from Major Countries |
8 El Salvador Friction Materials Market Key Performance Indicators |
8.1 Average age of vehicles in El Salvador |
8.2 Industrial production index in the country |
8.3 Number of road accidents reported annually |
9 El Salvador Friction Materials Market - Opportunity Assessment |
9.1 El Salvador Friction Materials Market Opportunity Assessment, By Product, 2022 & 2032F |
9.2 El Salvador Friction Materials Market Opportunity Assessment, By Business Type, 2022 & 2032F |
9.3 El Salvador Friction Materials Market Opportunity Assessment, By Application, 2022 & 2032F |
9.4 El Salvador Friction Materials Market Opportunity Assessment, By End-Use Industry, 2022 & 2032F |
10 El Salvador Friction Materials Market - Competitive Landscape |
10.1 El Salvador Friction Materials Market Revenue Share, By Companies, 2025 |
10.2 El Salvador Friction Materials Market Competitive Benchmarking, By Operating and Technical Parameters |
11 Company Profiles |
12 Recommendations | 13 Disclaimer |
Export potential assessment - trade Analytics for 2030
Export potential enables firms to identify high-growth global markets with greater confidence by combining advanced trade intelligence with a structured quantitative methodology. The framework analyzes emerging demand trends and country-level import patterns while integrating macroeconomic and trade datasets such as GDP and population forecasts, bilateral import–export flows, tariff structures, elasticity differentials between developed and developing economies, geographic distance, and import demand projections. Using weighted trade values from 2020–2024 as the base period to project country-to-country export potential for 2030, these inputs are operationalized through calculated drivers such as gravity model parameters, tariff impact factors, and projected GDP per-capita growth. Through an analysis of hidden potentials, demand hotspots, and market conditions that are most favorable to success, this method enables firms to focus on target countries, maximize returns, and global expansion with data, backed by accuracy.
By factoring in the projected importer demand gap that is currently unmet and could be potential opportunity, it identifies the potential for the Exporter (Country) among 190 countries, against the general trade analysis, which identifies the biggest importer or exporter.
To discover high-growth global markets and optimize your business strategy:
Click Here
Pricing
- Single User License$ 1,995
- Department License$ 2,400
- Site License$ 3,120
- Global License$ 3,795

Search
Thought Leadership and Analyst Meet


Our Clients
Latest Reports
- Ivory Coast Pet Perfume market Market (2026-2032) | Challenges, Growth, Revenue, Strategy, Investment Opportunities, Share, Analysis, Restraints, Insights, Trends, Drivers, Forecast, Demand, Pricing, Value, Size, segmentation, Companies, Outlook, Competition
- Ivory Coast Biopolymer Packaging Market (2026-2032) | Size, Competition, Demand, Analysis, Trends, Drivers, Challenges, Companies, Value, Forecast, Investment Opportunities, Insights, Growth, Share, Restraints, Revenue, Strategy, Outlook, Pricing, segmentation
- Ivory Coast Electric Heavy Commercial Vehicle Traction Motor market Market (2026-2032) | Demand, Pricing, Value, Restraints, Size, Trends, Drivers, Analysis, Outlook, Strategy, Insights, Forecast, Companies, Challenges, Share, segmentation, Growth, Competition, Investment Opportunities, Revenue
- Ivory Coast Metallic Braces market Market (2026-2032) | Companies, Revenue, Trends, Value, Insights, Strategy, Restraints, Size, Demand, Pricing, Share, Challenges, Analysis, Forecast, Drivers, Investment Opportunities, Competition, segmentation, Growth, Outlook
- Ivory Coast barcode scanners printers market Market (2026-2032) | Pricing, Restraints, Analysis, Competition, Size, Value, Trends, Forecast, Companies, Drivers, Demand, Insights, Strategy, Share, Investment Opportunities, Challenges, segmentation, Growth, Outlook, Revenue
- Ivory Coast AI Energy Distribution Market (2026-2032) | Companies, Drivers, Demand, Challenges, Size, Insights, Value, Restraints, Strategy, Investment Opportunities, Revenue, Outlook, Growth, Forecast, Share, Competition, Pricing, segmentation, Analysis, Trends
- Ivory Coast Recycled Polyester Market (2026-2032) | Trends, Insights, Growth, Challenges, Forecast, Value, Outlook, Strategy, Pricing, Revenue, segmentation, Demand, Companies, Investment Opportunities, Restraints, Share, Size, Analysis, Competition, Drivers
- Ivory Coast Mission Critical Wireless Communications Market (2026-2032) | segmentation, Companies, Revenue, Drivers, Strategy, Demand, Growth, Insights, Trends, Competition, Forecast, Share, Size, Outlook, Restraints, Challenges, Analysis, Pricing, Value, Investment Opportunities
- Ivory Coast AI Pathology Market (2026-2032) | Investment Opportunities, Competition, Revenue, Growth, Value, Insights, Share, segmentation, Trends, Companies, Outlook, Drivers, Demand, Challenges, Analysis, Pricing, Size, Forecast, Restraints, Strategy
- Ivory Coast Electric Appliance Rental Market (2026-2032) | Outlook, Value, Drivers, Restraints, Trends, Share, Competition, Pricing, Forecast, Growth, Revenue, Strategy, Insights, Companies, Size, Investment Opportunities, Challenges, Demand, segmentation, Analysis
Industry Events and Analyst Meet

HIMTEX 2026

India Refining Summit 2026

India EV Show 2026

EV tech India Expo 2026

Auto Tech Asia 2026
Whitepaper
- Middle East & Africa Commercial Security Market Click here to view more.
- Middle East & Africa Fire Safety Systems & Equipment Market Click here to view more.
- GCC Drone Market Click here to view more.
- Middle East Lighting Fixture Market Click here to view more.
- GCC Physical & Perimeter Security Market Click here to view more.
6WResearch In News
- Doha a strategic location for EV manufacturing hub: IPA Qatar
- Demand for luxury TVs surging in the GCC, says Samsung
- Empowering Growth: The Thriving Journey of Bangladesh’s Cable Industry
- Demand for luxury TVs surging in the GCC, says Samsung
- Video call with a traditional healer? Once unthinkable, it’s now common in South Africa
- Intelligent Buildings To Smooth GCC’s Path To Net Zero