El Salvador Grease Market (2026-2032) | Share, Trends, Size, Value, Revenue, Analysis, Forecast, Outlook, Industry, Segmentation, Companies & Growth
Market Forecast By Thickener Type (Metallic Soap Thickener, Non-soap Thickener, Inorganic, Others), By Base Oil (Mineral oil, Synthetic oil, Bio-based oil), By End-Use Industry (Automotive, Construction, General Manufacturing, Mining, Metal production, Power generation, Food & Beverage, Others) And Competitive Landscape
| Product Code: ETC5682302 | Publication Date: Nov 2023 | Updated Date: Mar 2026 | Product Type: Market Research Report | |
| Publisher: 6Wresearch | Author: Ravi Bhandari | No. of Pages: 60 | No. of Figures: 30 | No. of Tables: 5 |
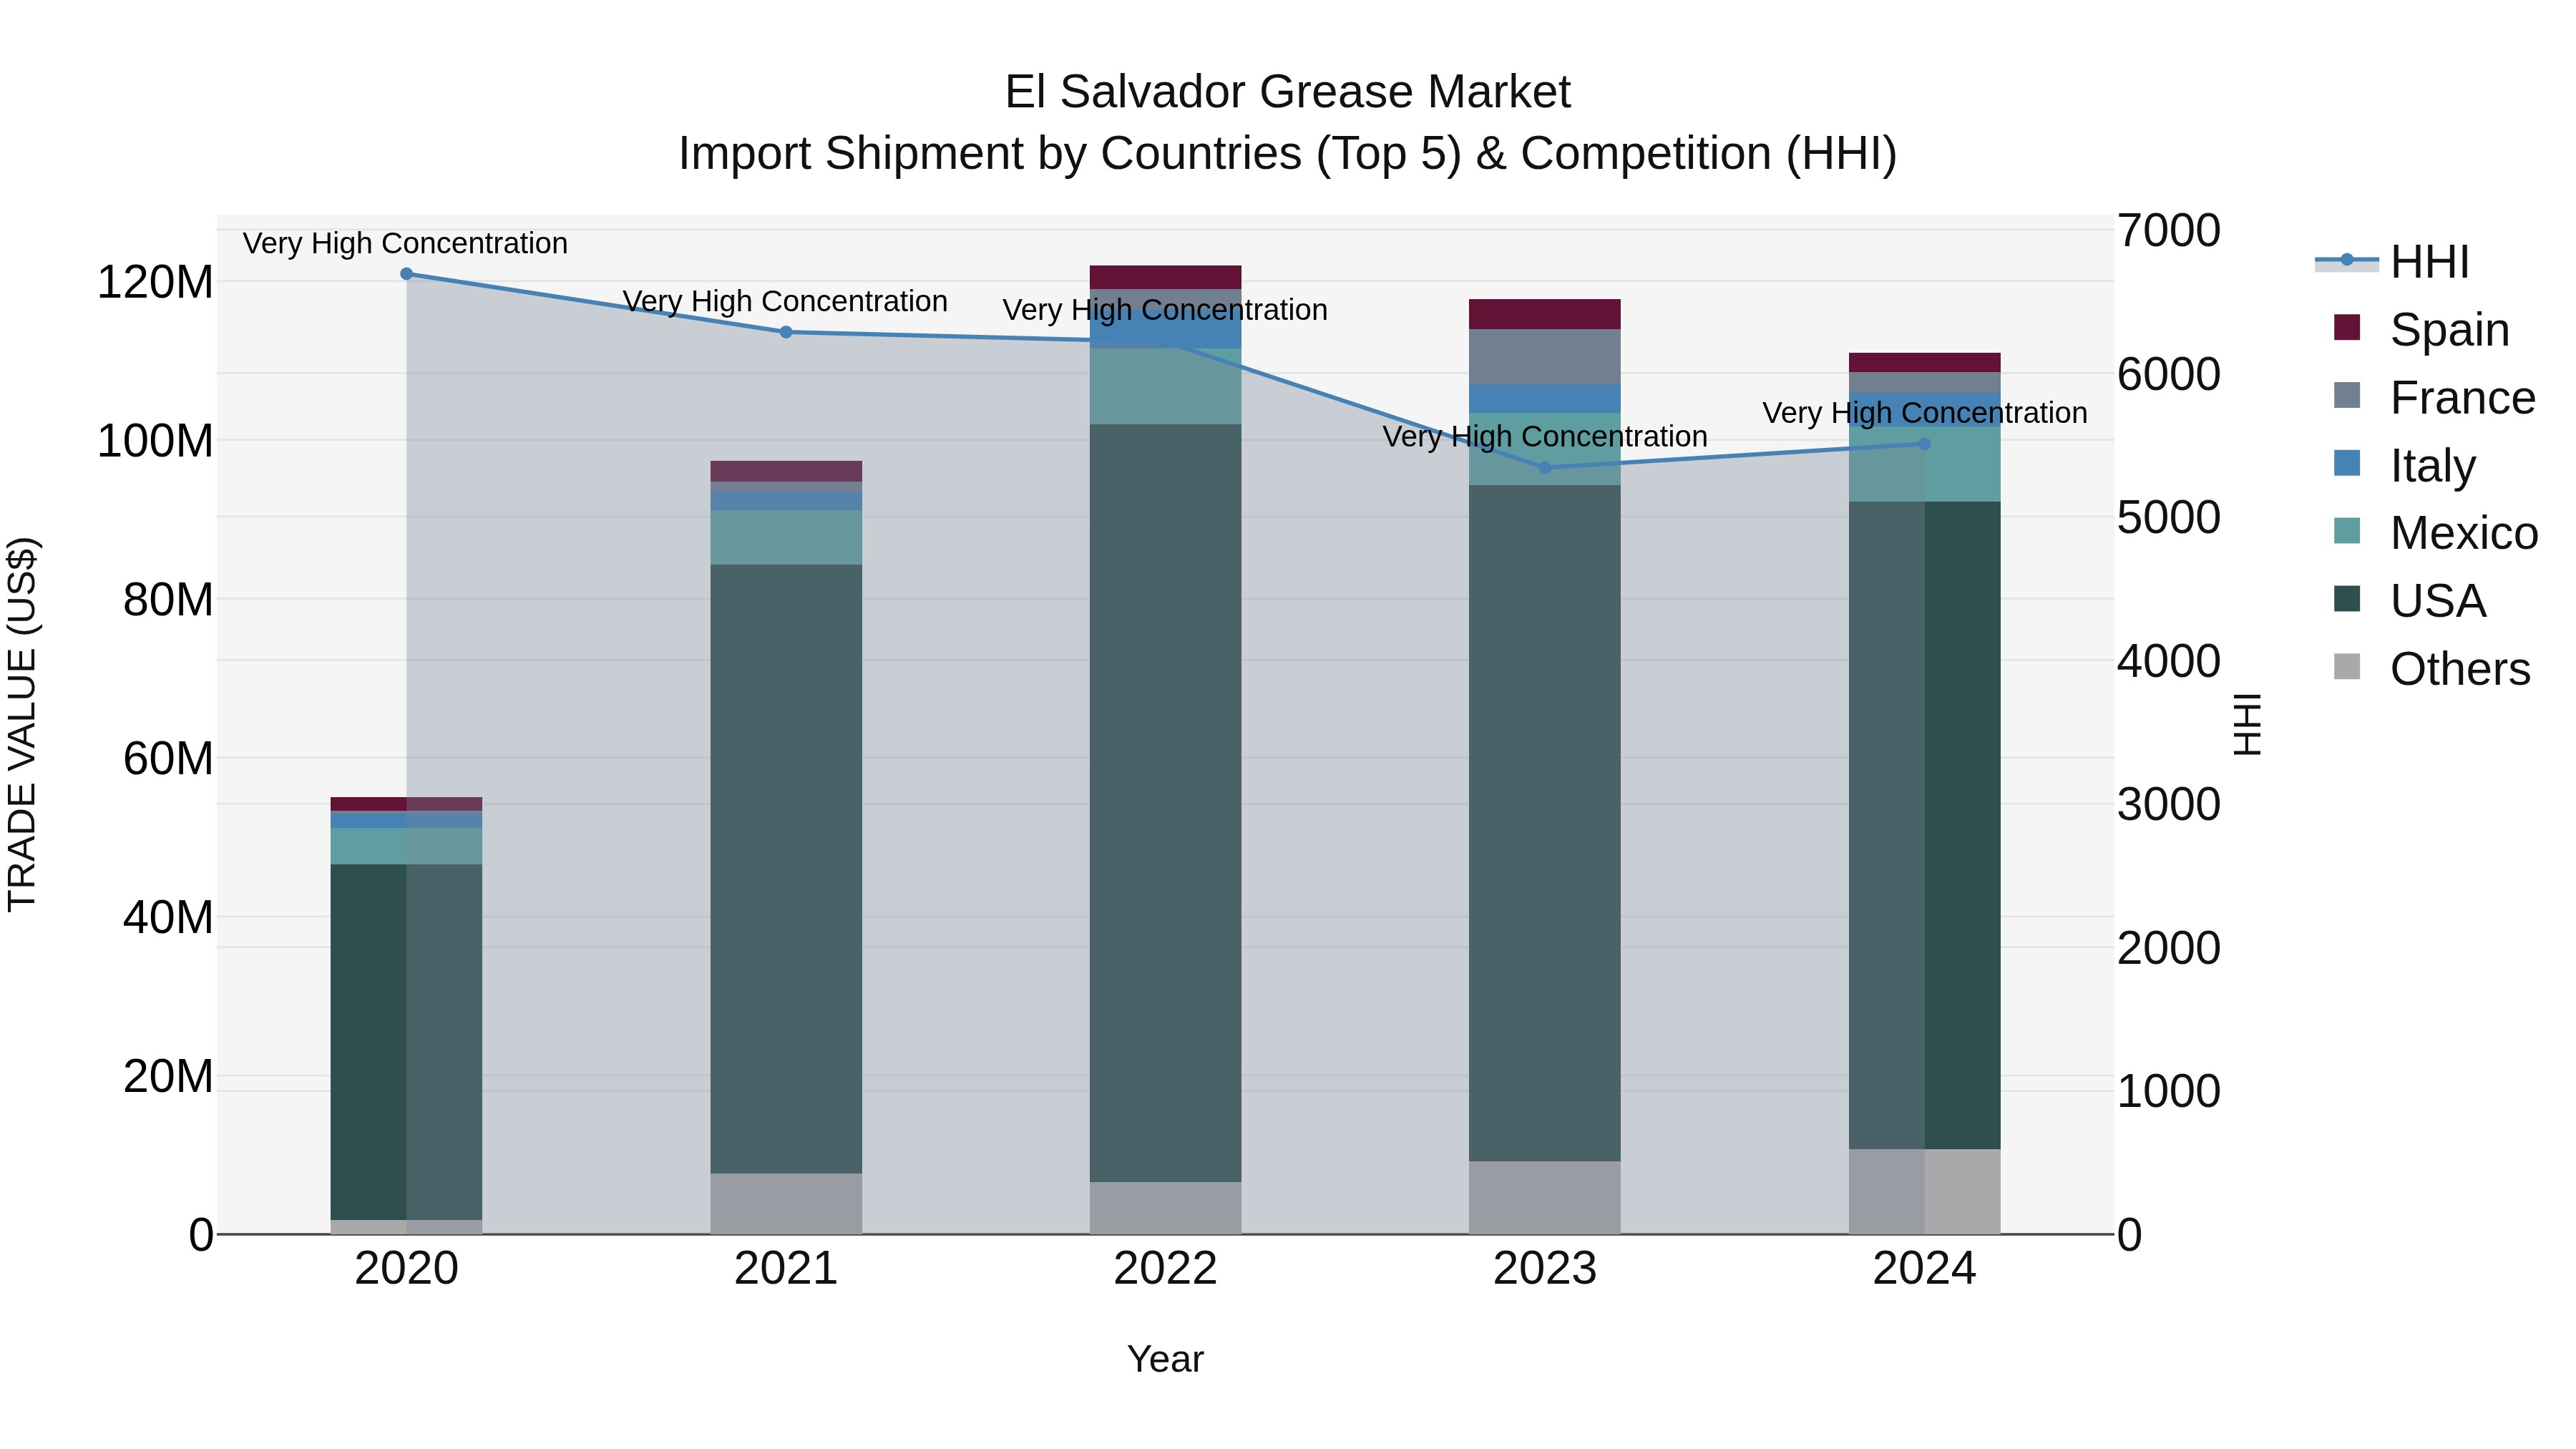
El Salvador Grease Market Top 5 Importing Countries and Market Competition (HHI) Analysis
El Salvador`s grease import market in 2024 continued to be dominated by key players such as the USA, Mexico, Italy, Singapore, and France. The high Herfindahl-Hirschman Index (HHI) indicates a concentrated market, while the impressive compound annual growth rate (CAGR) of 19.16% from 2020 to 2024 underscores the sector`s expansion. However, a slight decline in the growth rate from 2023 to 2024 at -5.72% suggests a potential shift in market dynamics. Stakeholders should closely monitor these trends to adapt to changing conditions and capitalize on emerging opportunities in the sector.
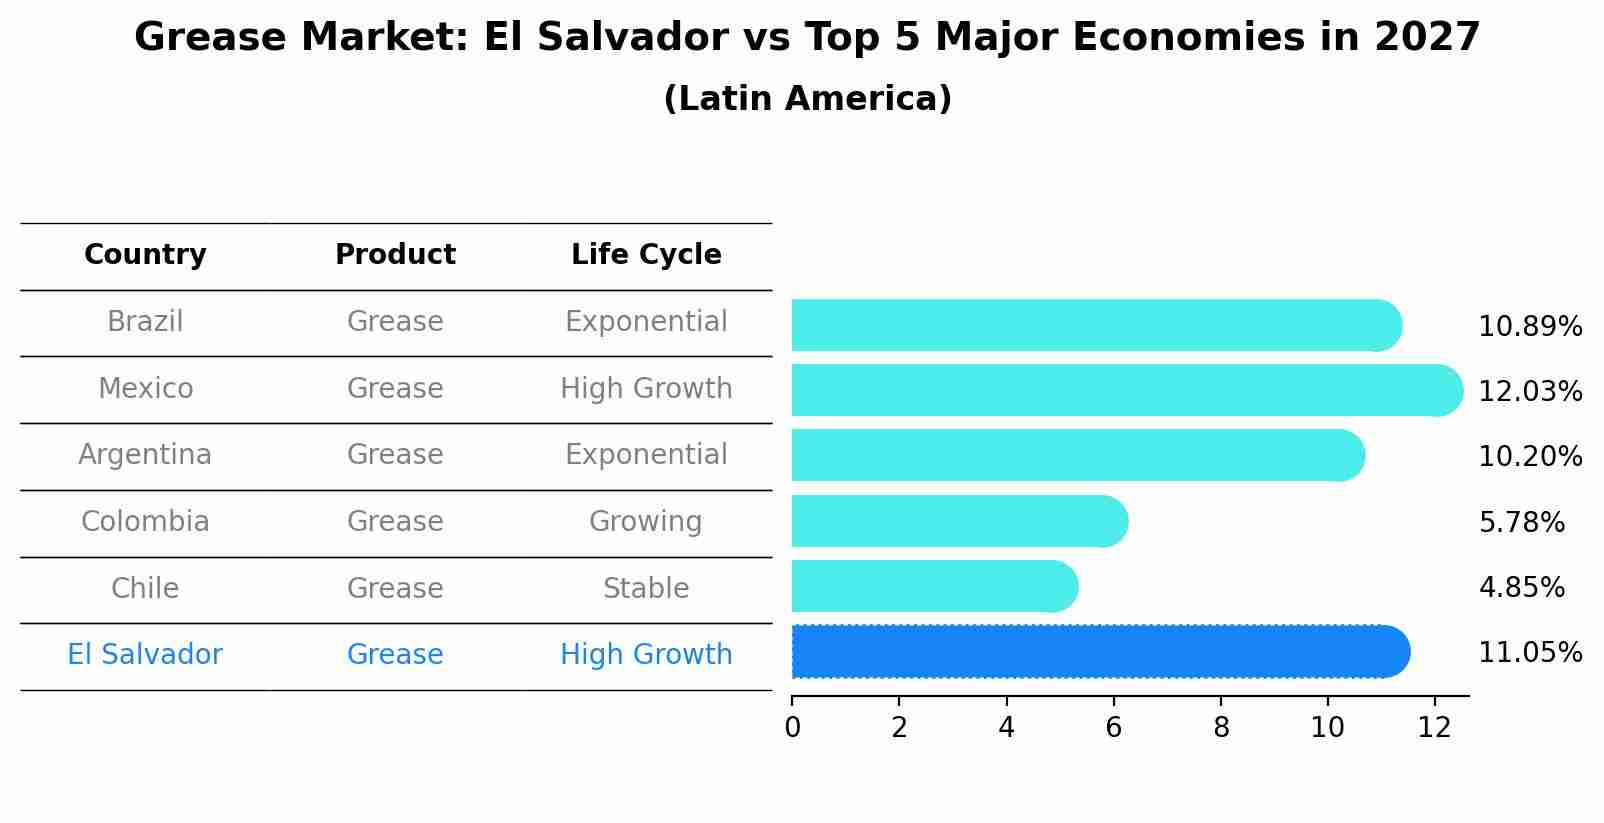
Grease Market: El Salvador vs Top 5 Major Economies in 2027 (Latin America)
By 2027, the Grease market in El Salvador is anticipated to reach a growth rate of 11.05%, as part of an increasingly competitive Latin America region, where Brazil remains at the forefront, supported by Mexico, Argentina, Colombia and Chile, driving innovations and market adoption across sectors.
Key Highlights of the Report:
- El Salvador Grease Market Outlook
- Market Size of El Salvador Grease Market, 2025
- Forecast of El Salvador Grease Market, 2032
- Historical Data and Forecast of El Salvador Grease Revenues & Volume for the Period 2022 - 2032F
- El Salvador Grease Market Trend Evolution
- El Salvador Grease Market Drivers and Challenges
- El Salvador Grease Price Trends
- El Salvador Grease Porter`s Five Forces
- El Salvador Grease Industry Life Cycle
- Historical Data and Forecast of El Salvador Grease Market Revenues & Volume By Thickener Type for the Period 2022 - 2032F
- Historical Data and Forecast of El Salvador Grease Market Revenues & Volume By Metallic Soap Thickener for the Period 2022 - 2032F
- Historical Data and Forecast of El Salvador Grease Market Revenues & Volume By Non-soap Thickener for the Period 2022 - 2032F
- Historical Data and Forecast of El Salvador Grease Market Revenues & Volume By Inorganic for the Period 2022 - 2032F
- Historical Data and Forecast of El Salvador Grease Market Revenues & Volume By Others for the Period 2022 - 2032F
- Historical Data and Forecast of El Salvador Grease Market Revenues & Volume By Base Oil for the Period 2022 - 2032F
- Historical Data and Forecast of El Salvador Grease Market Revenues & Volume By Mineral oil for the Period 2022 - 2032F
- Historical Data and Forecast of El Salvador Grease Market Revenues & Volume By Synthetic oil for the Period 2022 - 2032F
- Historical Data and Forecast of El Salvador Grease Market Revenues & Volume By Bio-based oil for the Period 2022 - 2032F
- Historical Data and Forecast of El Salvador Grease Market Revenues & Volume By End-Use Industry for the Period 2022 - 2032F
- Historical Data and Forecast of El Salvador Grease Market Revenues & Volume By Automotive for the Period 2022 - 2032F
- Historical Data and Forecast of El Salvador Grease Market Revenues & Volume By Construction for the Period 2022 - 2032F
- Historical Data and Forecast of El Salvador Grease Market Revenues & Volume By General Manufacturing for the Period 2022 - 2032F
- Historical Data and Forecast of El Salvador Grease Market Revenues & Volume By Mining for the Period 2022 - 2032F
- Historical Data and Forecast of El Salvador Grease Market Revenues & Volume By Metal production for the Period 2022 - 2032F
- Historical Data and Forecast of El Salvador Grease Market Revenues & Volume By Power generation for the Period 2022 - 2032F
- Historical Data and Forecast of El Salvador Grease Market Revenues & Volume By Food & Beverage for the Period 2022 - 2032F
- Historical Data and Forecast of El Salvador Grease Market Revenues & Volume By Others for the Period 2022 - 2032F
- El Salvador Grease Import Export Trade Statistics
- Market Opportunity Assessment By Thickener Type
- Market Opportunity Assessment By Base Oil
- Market Opportunity Assessment By End-Use Industry
- El Salvador Grease Top Companies Market Share
- El Salvador Grease Competitive Benchmarking By Technical and Operational Parameters
- El Salvador Grease Company Profiles
- El Salvador Grease Key Strategic Recommendations
Frequently Asked Questions About the Market Study (FAQs):
6Wresearch actively monitors the El Salvador Grease Market and publishes its comprehensive annual report, highlighting emerging trends, growth drivers, revenue analysis, and forecast outlook. Our insights help businesses to make data-backed strategic decisions with ongoing market dynamics. Our analysts track relevent industries related to the El Salvador Grease Market, allowing our clients with actionable intelligence and reliable forecasts tailored to emerging regional needs.
Yes, we provide customisation as per your requirements. To learn more, feel free to contact us on sales@6wresearch.com
1 Executive Summary |
2 Introduction |
2.1 Key Highlights of the Report |
2.2 Report Description |
2.3 Market Scope & Segmentation |
2.4 Research Methodology |
2.5 Assumptions |
3 El Salvador Grease Market Overview |
3.1 El Salvador Country Macro Economic Indicators |
3.2 El Salvador Grease Market Revenues & Volume, 2022 & 2032F |
3.3 El Salvador Grease Market - Industry Life Cycle |
3.4 El Salvador Grease Market - Porter's Five Forces |
3.5 El Salvador Grease Market Revenues & Volume Share, By Thickener Type, 2022 & 2032F |
3.6 El Salvador Grease Market Revenues & Volume Share, By Base Oil, 2022 & 2032F |
3.7 El Salvador Grease Market Revenues & Volume Share, By End-Use Industry, 2022 & 2032F |
4 El Salvador Grease Market Dynamics |
4.1 Impact Analysis |
4.2 Market Drivers |
4.2.1 Growing industrialization and manufacturing activities in El Salvador leading to increased demand for grease products. |
4.2.2 Increasing automotive sales and maintenance services driving the demand for grease in the automotive sector. |
4.2.3 Favorable government policies and initiatives supporting the growth of the manufacturing and automotive industries. |
4.3 Market Restraints |
4.3.1 Fluctuating raw material prices impacting the production cost of grease. |
4.3.2 Competition from substitute products such as synthetic lubricants affecting the market growth. |
4.3.3 Economic instability and currency fluctuations affecting consumer purchasing power. |
5 El Salvador Grease Market Trends |
6 El Salvador Grease Market Segmentations |
6.1 El Salvador Grease Market, By Thickener Type |
6.1.1 Overview and Analysis |
6.1.2 El Salvador Grease Market Revenues & Volume, By Metallic Soap Thickener, 2022 - 2032F |
6.1.3 El Salvador Grease Market Revenues & Volume, By Non-soap Thickener, 2022 - 2032F |
6.1.4 El Salvador Grease Market Revenues & Volume, By Inorganic, 2022 - 2032F |
6.1.5 El Salvador Grease Market Revenues & Volume, By Others, 2022 - 2032F |
6.2 El Salvador Grease Market, By Base Oil |
6.2.1 Overview and Analysis |
6.2.2 El Salvador Grease Market Revenues & Volume, By Mineral oil, 2022 - 2032F |
6.2.3 El Salvador Grease Market Revenues & Volume, By Synthetic oil, 2022 - 2032F |
6.2.4 El Salvador Grease Market Revenues & Volume, By Bio-based oil, 2022 - 2032F |
6.3 El Salvador Grease Market, By End-Use Industry |
6.3.1 Overview and Analysis |
6.3.2 El Salvador Grease Market Revenues & Volume, By Automotive, 2022 - 2032F |
6.3.3 El Salvador Grease Market Revenues & Volume, By Construction, 2022 - 2032F |
6.3.4 El Salvador Grease Market Revenues & Volume, By General Manufacturing, 2022 - 2032F |
6.3.5 El Salvador Grease Market Revenues & Volume, By Mining, 2022 - 2032F |
6.3.6 El Salvador Grease Market Revenues & Volume, By Metal production, 2022 - 2032F |
6.3.7 El Salvador Grease Market Revenues & Volume, By Power generation, 2022 - 2032F |
6.3.8 El Salvador Grease Market Revenues & Volume, By Others, 2022 - 2032F |
6.3.9 El Salvador Grease Market Revenues & Volume, By Others, 2022 - 2032F |
7 El Salvador Grease Market Import-Export Trade Statistics |
7.1 El Salvador Grease Market Export to Major Countries |
7.2 El Salvador Grease Market Imports from Major Countries |
8 El Salvador Grease Market Key Performance Indicators |
8.1 Average selling price of grease products in the market. |
8.2 Number of new manufacturing facilities or automotive service centers established in El Salvador. |
8.3 Percentage of grease product innovations or technological advancements introduced in the market. |
8.4 Environmental sustainability practices adopted by grease manufacturers in El Salvador. |
8.5 Level of compliance with quality standards and regulations in the grease market. |
9 El Salvador Grease Market - Opportunity Assessment |
9.1 El Salvador Grease Market Opportunity Assessment, By Thickener Type, 2022 & 2032F |
9.2 El Salvador Grease Market Opportunity Assessment, By Base Oil, 2022 & 2032F |
9.3 El Salvador Grease Market Opportunity Assessment, By End-Use Industry, 2022 & 2032F |
10 El Salvador Grease Market - Competitive Landscape |
10.1 El Salvador Grease Market Revenue Share, By Companies, 2025 |
10.2 El Salvador Grease Market Competitive Benchmarking, By Operating and Technical Parameters |
11 Company Profiles |
12 Recommendations | 13 Disclaimer |
Export potential assessment - trade Analytics for 2030
Export potential enables firms to identify high-growth global markets with greater confidence by combining advanced trade intelligence with a structured quantitative methodology. The framework analyzes emerging demand trends and country-level import patterns while integrating macroeconomic and trade datasets such as GDP and population forecasts, bilateral import–export flows, tariff structures, elasticity differentials between developed and developing economies, geographic distance, and import demand projections. Using weighted trade values from 2020–2024 as the base period to project country-to-country export potential for 2030, these inputs are operationalized through calculated drivers such as gravity model parameters, tariff impact factors, and projected GDP per-capita growth. Through an analysis of hidden potentials, demand hotspots, and market conditions that are most favorable to success, this method enables firms to focus on target countries, maximize returns, and global expansion with data, backed by accuracy.
By factoring in the projected importer demand gap that is currently unmet and could be potential opportunity, it identifies the potential for the Exporter (Country) among 190 countries, against the general trade analysis, which identifies the biggest importer or exporter.
To discover high-growth global markets and optimize your business strategy:
Click Here
Pricing
- Single User License$ 1,995
- Department License$ 2,400
- Site License$ 3,120
- Global License$ 3,795

Search
Thought Leadership and Analyst Meet


Our Clients
Latest Reports
- Ivory Coast Pet Perfume market Market (2026-2032) | Challenges, Growth, Revenue, Strategy, Investment Opportunities, Share, Analysis, Restraints, Insights, Trends, Drivers, Forecast, Demand, Pricing, Value, Size, segmentation, Companies, Outlook, Competition
- Ivory Coast Biopolymer Packaging Market (2026-2032) | Size, Competition, Demand, Analysis, Trends, Drivers, Challenges, Companies, Value, Forecast, Investment Opportunities, Insights, Growth, Share, Restraints, Revenue, Strategy, Outlook, Pricing, segmentation
- Ivory Coast Electric Heavy Commercial Vehicle Traction Motor market Market (2026-2032) | Demand, Pricing, Value, Restraints, Size, Trends, Drivers, Analysis, Outlook, Strategy, Insights, Forecast, Companies, Challenges, Share, segmentation, Growth, Competition, Investment Opportunities, Revenue
- Ivory Coast Metallic Braces market Market (2026-2032) | Companies, Revenue, Trends, Value, Insights, Strategy, Restraints, Size, Demand, Pricing, Share, Challenges, Analysis, Forecast, Drivers, Investment Opportunities, Competition, segmentation, Growth, Outlook
- Ivory Coast barcode scanners printers market Market (2026-2032) | Pricing, Restraints, Analysis, Competition, Size, Value, Trends, Forecast, Companies, Drivers, Demand, Insights, Strategy, Share, Investment Opportunities, Challenges, segmentation, Growth, Outlook, Revenue
- Ivory Coast AI Energy Distribution Market (2026-2032) | Companies, Drivers, Demand, Challenges, Size, Insights, Value, Restraints, Strategy, Investment Opportunities, Revenue, Outlook, Growth, Forecast, Share, Competition, Pricing, segmentation, Analysis, Trends
- Ivory Coast Recycled Polyester Market (2026-2032) | Trends, Insights, Growth, Challenges, Forecast, Value, Outlook, Strategy, Pricing, Revenue, segmentation, Demand, Companies, Investment Opportunities, Restraints, Share, Size, Analysis, Competition, Drivers
- Ivory Coast Mission Critical Wireless Communications Market (2026-2032) | segmentation, Companies, Revenue, Drivers, Strategy, Demand, Growth, Insights, Trends, Competition, Forecast, Share, Size, Outlook, Restraints, Challenges, Analysis, Pricing, Value, Investment Opportunities
- Ivory Coast AI Pathology Market (2026-2032) | Investment Opportunities, Competition, Revenue, Growth, Value, Insights, Share, segmentation, Trends, Companies, Outlook, Drivers, Demand, Challenges, Analysis, Pricing, Size, Forecast, Restraints, Strategy
- Ivory Coast Electric Appliance Rental Market (2026-2032) | Outlook, Value, Drivers, Restraints, Trends, Share, Competition, Pricing, Forecast, Growth, Revenue, Strategy, Insights, Companies, Size, Investment Opportunities, Challenges, Demand, segmentation, Analysis
Industry Events and Analyst Meet

HIMTEX 2026

India Refining Summit 2026

India EV Show 2026

EV tech India Expo 2026

Auto Tech Asia 2026
Whitepaper
- Middle East & Africa Commercial Security Market Click here to view more.
- Middle East & Africa Fire Safety Systems & Equipment Market Click here to view more.
- GCC Drone Market Click here to view more.
- Middle East Lighting Fixture Market Click here to view more.
- GCC Physical & Perimeter Security Market Click here to view more.
6WResearch In News
- Doha a strategic location for EV manufacturing hub: IPA Qatar
- Demand for luxury TVs surging in the GCC, says Samsung
- Empowering Growth: The Thriving Journey of Bangladesh’s Cable Industry
- Demand for luxury TVs surging in the GCC, says Samsung
- Video call with a traditional healer? Once unthinkable, it’s now common in South Africa
- Intelligent Buildings To Smooth GCC’s Path To Net Zero