El Salvador Polyurethane (PU) Microspheres Market (2025-2031) | Size, Growth, Trends, Revenue, Companies, Forecast, Share, Industry, Analysis, Value, Segmentation & Outlook
Market Forecast By Applications (Encapsulation, Paints & coatings, Adhesives films, Cosmetics, Other applications) And Competitive Landscape
| Product Code: ETC5738029 | Publication Date: Nov 2023 | Updated Date: Nov 2025 | Product Type: Market Research Report | |
| Publisher: 6Wresearch | Author: Sumit Sagar | No. of Pages: 60 | No. of Figures: 30 | No. of Tables: 5 |
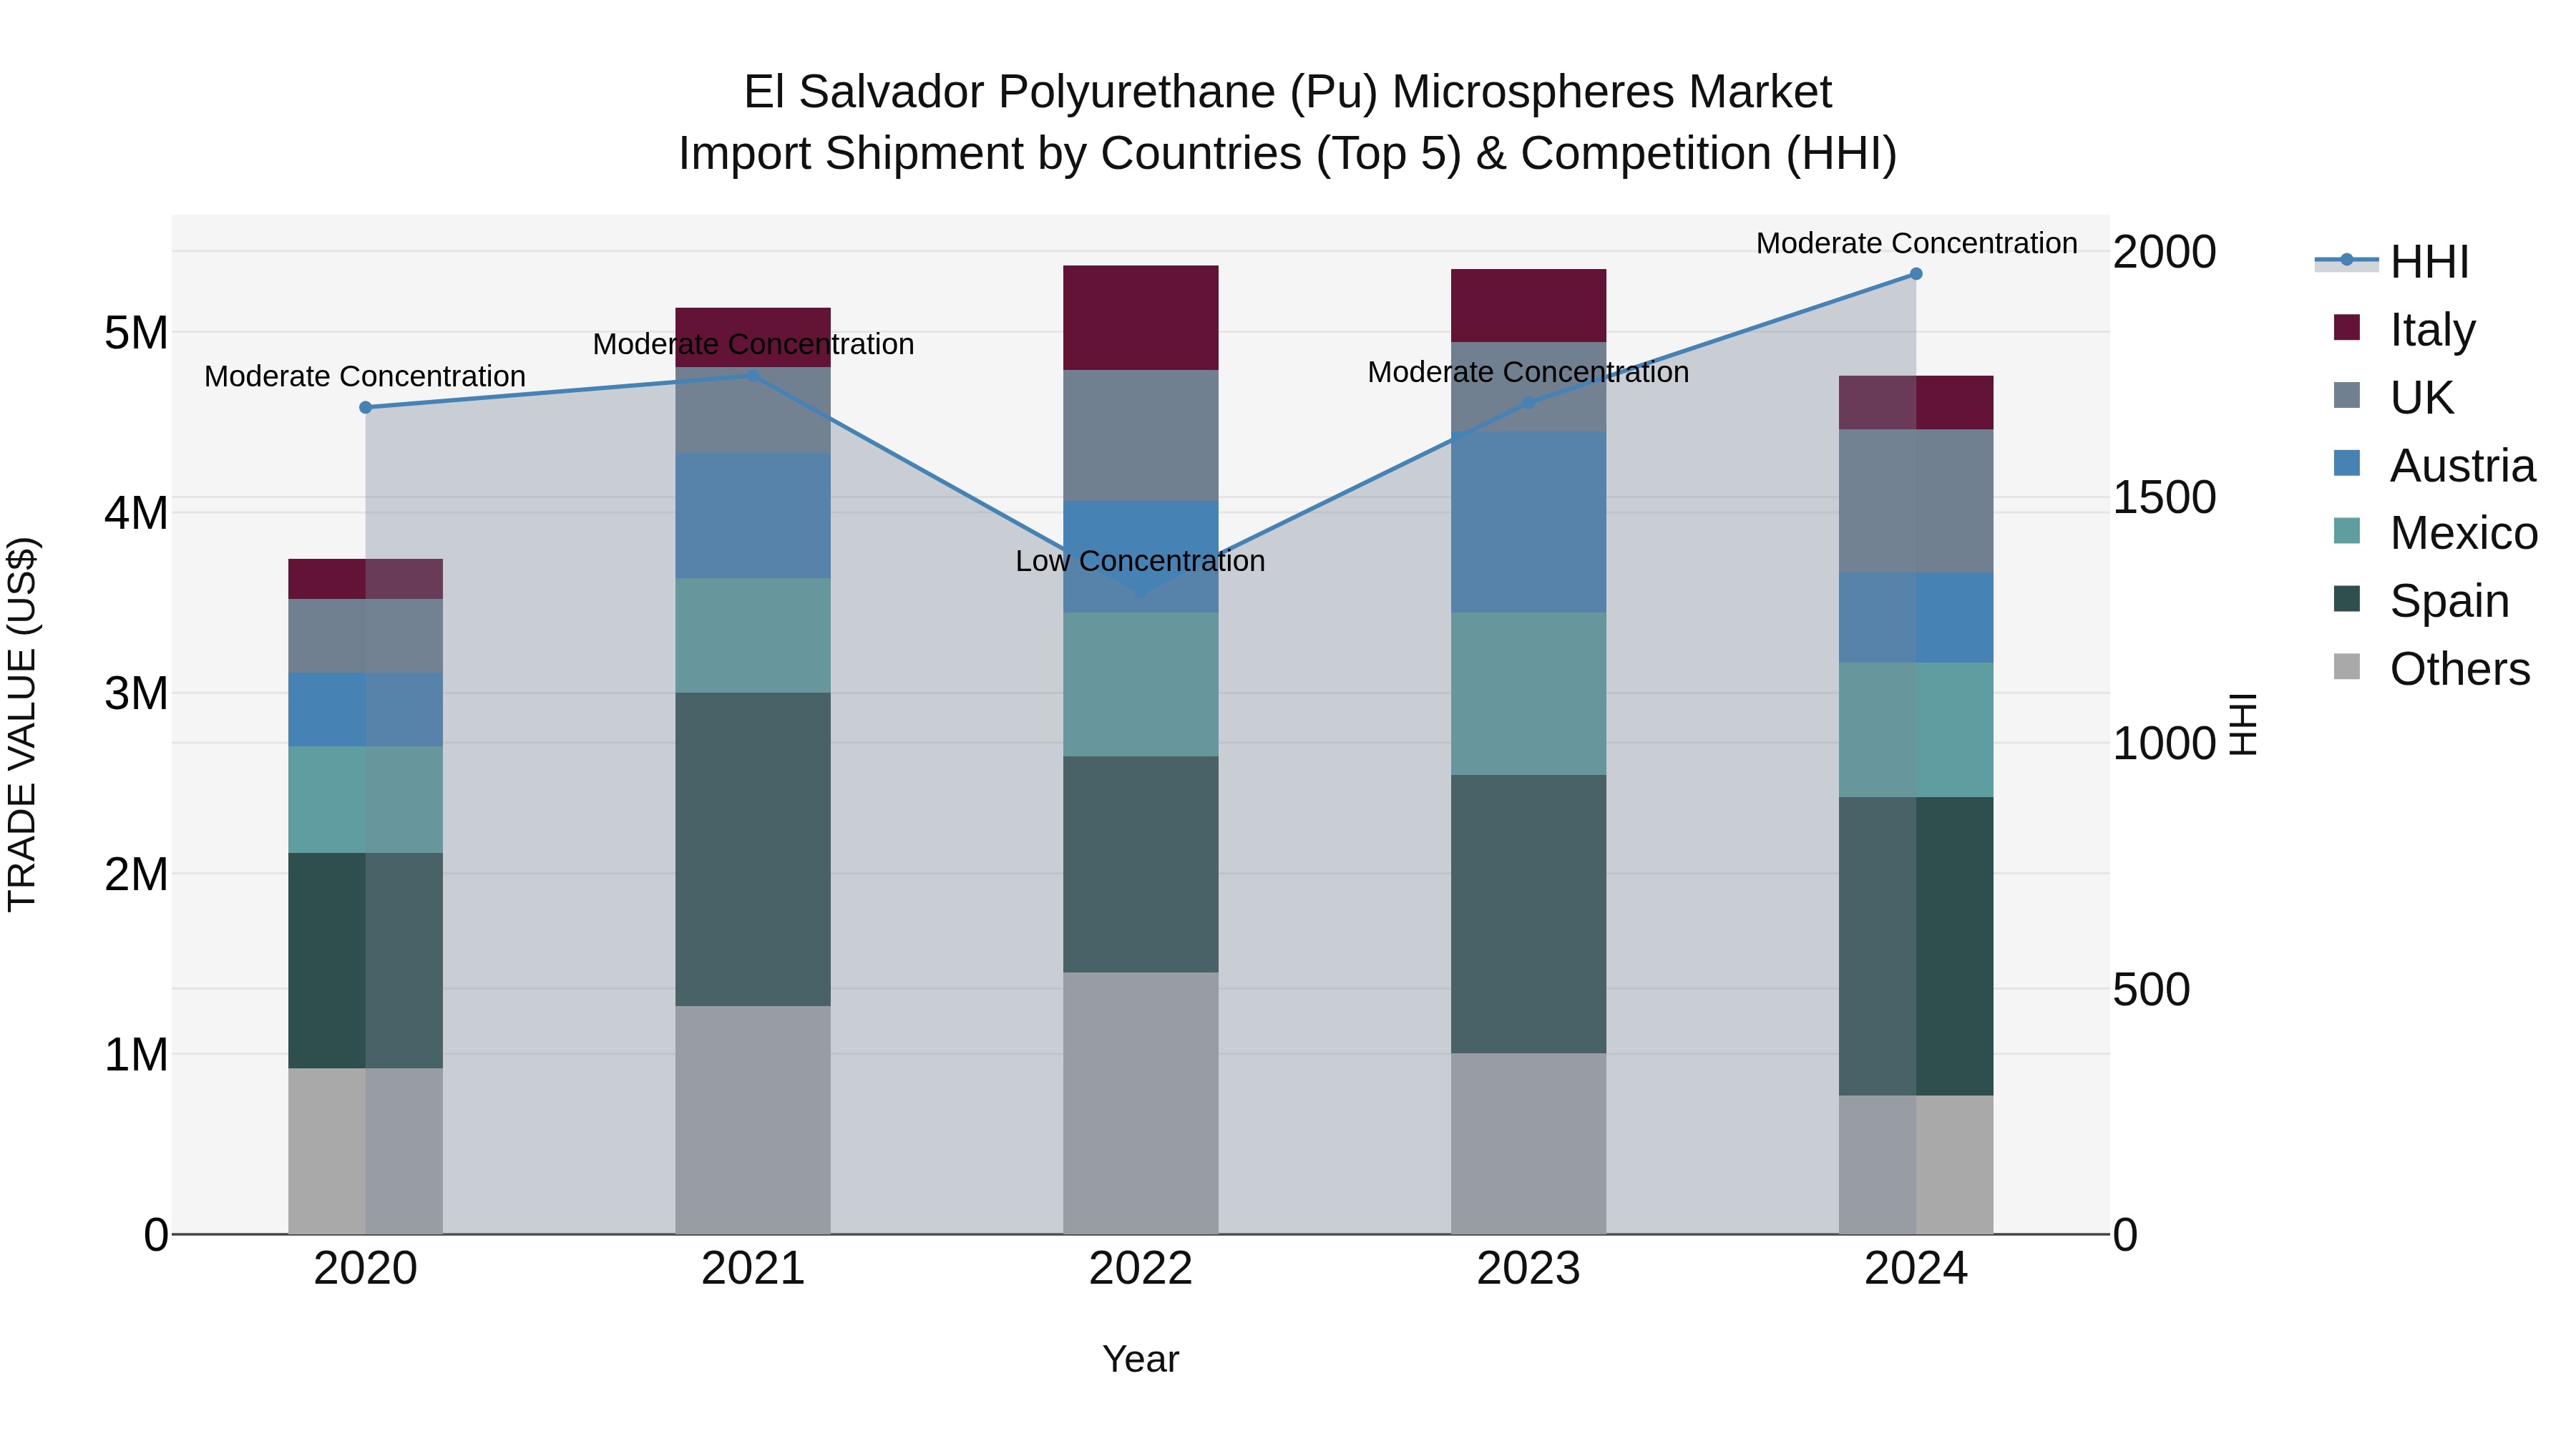
El Salvador Polyurethane Pu Microspheres Market Top 5 Importing Countries and Market Competition (HHI) Analysis
El Salvador`s import shipments of polyurethane (PU) microspheres in 2024 saw a diverse range of top exporting countries including Spain, UK, Mexico, Austria, and USA. Despite moderate concentration indicated by the HHI, the industry experienced a positive CAGR of 6.2% from 2020 to 2024. However, there was a slight decline in growth rate from 2023 to 2024 at -11.03%, reflecting potential shifts in market dynamics. Monitoring these trends can provide valuable insights for stakeholders in the PU microspheres market.
El Salvador Polyurethane (PU) Microspheres Market Overview
The polyurethane (PU) microspheres market in El Salvador is expanding as PU microspheres find applications in a variety of industries, including coatings, cosmetics, and medical devices. These microspheres offer unique properties such as controlled release, lightweight, and resistance to wear. As the demand for advanced materials in the coatings, pharmaceuticals, and cosmetics industries grows in El Salvador, the PU microspheres market is expected to witness continued growth.
Drivers of the market
The polyurethane (PU) microspheres market in El Salvador is expanding as demand grows for this versatile material in applications such as coatings, adhesives, and medical devices. PU microspheres are valued for their ability to enhance product performance and reduce weight. The increasing adoption of advanced materials in coatings and healthcare is contributing to the growth of the PU microspheres market.
Challenges of the market
The polyurethane microspheres market in El Salvador faces challenges related to the high cost of production and the limited demand for this specialized product. Polyurethane microspheres are used in applications like drug delivery systems and cosmetics, but the market is small, limiting growth prospects. Furthermore, competition from other microsphere materials, such as those based on polystyrene, poses additional challenges.
Government Policy of the market
The polyurethane (PU) microspheres market in El Salvador benefits from government policies that support the development of advanced materials in industries such as healthcare, automotive, and electronics. PU microspheres are widely used in coatings, drug delivery systems, and other applications due to their size and versatility. The government encourages research and development in advanced materials, offering funding and incentives for local manufacturers involved in the production of PU microspheres. Additionally, policies focused on sustainable production processes and the growth of the chemical manufacturing sector contribute to the expansion of this market in El Salvador.
Key Highlights of the Report:
- El Salvador Polyurethane (PU) Microspheres Market Outlook
- Market Size of El Salvador Polyurethane (PU) Microspheres Market, 2024
- Forecast of El Salvador Polyurethane (PU) Microspheres Market, 2031
- Historical Data and Forecast of El Salvador Polyurethane (PU) Microspheres Revenues & Volume for the Period 2021-2031
- El Salvador Polyurethane (PU) Microspheres Market Trend Evolution
- El Salvador Polyurethane (PU) Microspheres Market Drivers and Challenges
- El Salvador Polyurethane (PU) Microspheres Price Trends
- El Salvador Polyurethane (PU) Microspheres Porter`s Five Forces
- El Salvador Polyurethane (PU) Microspheres Industry Life Cycle
- Historical Data and Forecast of El Salvador Polyurethane (PU) Microspheres Market Revenues & Volume By Applications for the Period 2021-2031
- Historical Data and Forecast of El Salvador Polyurethane (PU) Microspheres Market Revenues & Volume By Encapsulation for the Period 2021-2031
- Historical Data and Forecast of El Salvador Polyurethane (PU) Microspheres Market Revenues & Volume By Paints & coatings for the Period 2021-2031
- Historical Data and Forecast of El Salvador Polyurethane (PU) Microspheres Market Revenues & Volume By Adhesives films for the Period 2021-2031
- Historical Data and Forecast of El Salvador Polyurethane (PU) Microspheres Market Revenues & Volume By Cosmetics for the Period 2021-2031
- Historical Data and Forecast of El Salvador Polyurethane (PU) Microspheres Market Revenues & Volume By Other applications for the Period 2021-2031
- El Salvador Polyurethane (PU) Microspheres Import Export Trade Statistics
- Market Opportunity Assessment By Applications
- El Salvador Polyurethane (PU) Microspheres Top Companies Market Share
- El Salvador Polyurethane (PU) Microspheres Competitive Benchmarking By Technical and Operational Parameters
- El Salvador Polyurethane (PU) Microspheres Company Profiles
- El Salvador Polyurethane (PU) Microspheres Key Strategic Recommendations
Frequently Asked Questions About the Market Study (FAQs):
6Wresearch actively monitors the El Salvador Polyurethane (PU) Microspheres Market and publishes its comprehensive annual report, highlighting emerging trends, growth drivers, revenue analysis, and forecast outlook. Our insights help businesses to make data-backed strategic decisions with ongoing market dynamics. Our analysts track relevent industries related to the El Salvador Polyurethane (PU) Microspheres Market, allowing our clients with actionable intelligence and reliable forecasts tailored to emerging regional needs.
Yes, we provide customisation as per your requirements. To learn more, feel free to contact us on sales@6wresearch.com
1 Executive Summary |
2 Introduction |
2.1 Key Highlights of the Report |
2.2 Report Description |
2.3 Market Scope & Segmentation |
2.4 Research Methodology |
2.5 Assumptions |
3 El Salvador Polyurethane (PU) Microspheres Market Overview |
3.1 El Salvador Country Macro Economic Indicators |
3.2 El Salvador Polyurethane (PU) Microspheres Market Revenues & Volume, 2021 & 2031F |
3.3 El Salvador Polyurethane (PU) Microspheres Market - Industry Life Cycle |
3.4 El Salvador Polyurethane (PU) Microspheres Market - Porter's Five Forces |
3.5 El Salvador Polyurethane (PU) Microspheres Market Revenues & Volume Share, By Applications, 2021 & 2031F |
4 El Salvador Polyurethane (PU) Microspheres Market Dynamics |
4.1 Impact Analysis |
4.2 Market Drivers |
4.2.1 Increasing demand for lightweight materials in industries such as automotive, construction, and electronics, driving the adoption of polyurethane microspheres. |
4.2.2 Growing awareness about the benefits of polyurethane microspheres such as improved insulation properties, reduced density, and enhanced durability. |
4.2.3 Rising investments in research and development for the development of advanced polyurethane microspheres with enhanced properties. |
4.3 Market Restraints |
4.3.1 Fluctuating raw material prices impacting the production cost of polyurethane microspheres. |
4.3.2 Stringent regulations regarding the use of certain chemicals in the manufacturing process of polyurethane microspheres. |
4.3.3 Competition from alternative materials such as glass microspheres and ceramic microspheres in some applications. |
5 El Salvador Polyurethane (PU) Microspheres Market Trends |
6 El Salvador Polyurethane (PU) Microspheres Market Segmentations |
6.1 El Salvador Polyurethane (PU) Microspheres Market, By Applications |
6.1.1 Overview and Analysis |
6.1.2 El Salvador Polyurethane (PU) Microspheres Market Revenues & Volume, By Encapsulation, 2021-2031F |
6.1.3 El Salvador Polyurethane (PU) Microspheres Market Revenues & Volume, By Paints & coatings, 2021-2031F |
6.1.4 El Salvador Polyurethane (PU) Microspheres Market Revenues & Volume, By Adhesives films, 2021-2031F |
6.1.5 El Salvador Polyurethane (PU) Microspheres Market Revenues & Volume, By Cosmetics, 2021-2031F |
6.1.6 El Salvador Polyurethane (PU) Microspheres Market Revenues & Volume, By Other applications, 2021-2031F |
7 El Salvador Polyurethane (PU) Microspheres Market Import-Export Trade Statistics |
7.1 El Salvador Polyurethane (PU) Microspheres Market Export to Major Countries |
7.2 El Salvador Polyurethane (PU) Microspheres Market Imports from Major Countries |
8 El Salvador Polyurethane (PU) Microspheres Market Key Performance Indicators |
8.1 Research and development investment in new polyurethane microspheres formulations. |
8.2 Number of patents filed for innovative polyurethane microspheres technologies. |
8.3 Adoption rate of polyurethane microspheres in key industries such as automotive, construction, and electronics. |
9 El Salvador Polyurethane (PU) Microspheres Market - Opportunity Assessment |
9.1 El Salvador Polyurethane (PU) Microspheres Market Opportunity Assessment, By Applications, 2021 & 2031F |
10 El Salvador Polyurethane (PU) Microspheres Market - Competitive Landscape |
10.1 El Salvador Polyurethane (PU) Microspheres Market Revenue Share, By Companies, 2024 |
10.2 El Salvador Polyurethane (PU) Microspheres Market Competitive Benchmarking, By Operating and Technical Parameters |
11 Company Profiles |
12 Recommendations | 13 Disclaimer |
Export potential assessment - trade Analytics for 2030
Export potential enables firms to identify high-growth global markets with greater confidence by combining advanced trade intelligence with a structured quantitative methodology. The framework analyzes emerging demand trends and country-level import patterns while integrating macroeconomic and trade datasets such as GDP and population forecasts, bilateral import–export flows, tariff structures, elasticity differentials between developed and developing economies, geographic distance, and import demand projections. Using weighted trade values from 2020–2024 as the base period to project country-to-country export potential for 2030, these inputs are operationalized through calculated drivers such as gravity model parameters, tariff impact factors, and projected GDP per-capita growth. Through an analysis of hidden potentials, demand hotspots, and market conditions that are most favorable to success, this method enables firms to focus on target countries, maximize returns, and global expansion with data, backed by accuracy.
By factoring in the projected importer demand gap that is currently unmet and could be potential opportunity, it identifies the potential for the Exporter (Country) among 190 countries, against the general trade analysis, which identifies the biggest importer or exporter.
To discover high-growth global markets and optimize your business strategy:
Click Here
Pricing
- Single User License$ 1,995
- Department License$ 2,400
- Site License$ 3,120
- Global License$ 3,795

Search
Thought Leadership and Analyst Meet


Our Clients
Latest Reports
- France Thermally Conductive Filler Dispersants Market (2026-2032) | Challenges, Restraints, Value, Share, Size, segmentation, Analysis, Trends, Investment Opportunities, Outlook, Pricing, Demand, Forecast, Revenue, Companies, Growth, Drivers, Strategy, Insights, Competition
- Egypt Thermally Conductive Filler Dispersants Market (2026-2032) | Competition, Forecast, Strategy, Value, Insights, Outlook, Investment Opportunities, Pricing, Demand, Share, segmentation, Drivers, Size, Companies, Restraints, Growth, Trends, Revenue, Challenges, Analysis
- Czech Republic Thermally Conductive Filler Dispersants Market (2026-2032) | Forecast, Pricing, Analysis, Drivers, Insights, Size, Demand, Growth, Challenges, segmentation, Competition, Outlook, Trends, Investment Opportunities, Companies, Strategy, Revenue, Share, Value, Restraints
- Colombia Thermally Conductive Filler Dispersants Market (2026-2032) | segmentation, Trends, Share, Drivers, Strategy, Companies, Demand, Insights, Size, Challenges, Value, Competition, Analysis, Growth, Revenue, Restraints, Forecast, Pricing, Outlook, Investment Opportunities
- China Thermally Conductive Filler Dispersants Market (2026-2032) | Restraints, Investment Opportunities, Pricing, Companies, Share, Size, Challenges, Trends, Outlook, Value, Analysis, Competition, Revenue, Drivers, Forecast, Demand, Insights, Growth, Strategy, segmentation
- Chile Thermally Conductive Filler Dispersants Market (2026-2032) | Investment Opportunities, Trends, Value, Restraints, Share, Companies, Forecast, segmentation, Pricing, Challenges, Demand, Size, Analysis, Drivers, Outlook, Growth, Competition, Strategy, Revenue, Insights
- Cambodia Thermally Conductive Filler Dispersants Market (2026-2032) | Analysis, Share, Outlook, Strategy, Pricing, Demand, Size, Growth, segmentation, Insights, Revenue, Forecast, Challenges, Competition, Companies, Investment Opportunities, Trends, Restraints, Value, Drivers
- Brazil Thermally Conductive Filler Dispersants Market (2026-2032) | Restraints, Forecast, Competition, Size, Revenue, Value, Investment Opportunities, Trends, Insights, Outlook, Growth, Analysis, Drivers, segmentation, Pricing, Challenges, Strategy, Share, Companies, Demand
- Bangladesh Thermally Conductive Filler Dispersants Market (2026-2032) | Restraints, Trends, Analysis, Competition, Insights, Forecast, Value, Investment Opportunities, Pricing, Share, Demand, Outlook, Revenue, segmentation, Companies, Drivers, Growth, Size, Challenges, Strategy
- Bahrain Thermally Conductive Filler Dispersants Market (2026-2032) | Trends, Outlook, Pricing, Demand, Value, Competition, Forecast, Growth, segmentation, Revenue, Companies, Analysis, Insights, Size, Drivers, Challenges, Strategy, Investment Opportunities, Share, Restraints
Industry Events and Analyst Meet

HIMTEX 2026

India Refining Summit 2026

India EV Show 2026

EV tech India Expo 2026

Auto Tech Asia 2026
Whitepaper
- Middle East & Africa Commercial Security Market Click here to view more.
- Middle East & Africa Fire Safety Systems & Equipment Market Click here to view more.
- GCC Drone Market Click here to view more.
- Middle East Lighting Fixture Market Click here to view more.
- GCC Physical & Perimeter Security Market Click here to view more.
6WResearch In News
- Doha a strategic location for EV manufacturing hub: IPA Qatar
- Demand for luxury TVs surging in the GCC, says Samsung
- Empowering Growth: The Thriving Journey of Bangladesh’s Cable Industry
- Demand for luxury TVs surging in the GCC, says Samsung
- Video call with a traditional healer? Once unthinkable, it’s now common in South Africa
- Intelligent Buildings To Smooth GCC’s Path To Net Zero