Estonia Envelope Market (2026-2032) | Trends, Segmentation, Analysis, Outlook, Industry, Share, Revenue, Forecast, Value, Size, Growth & Companies
Market Forecast By Product Type (Baronial, A-style, Square, Booklet, Commercial, Customized), By Applications (Commercial, Institutional, Household), By Closure (Remoistening Seal, Pressure-sensitive Seal, String and Button) And Competitive Landscape
| Product Code: ETC5830866 | Publication Date: Nov 2023 | Updated Date: Apr 2026 | Product Type: Market Research Report | |
| Publisher: 6Wresearch | Author: Ravi Bhandari | No. of Pages: 60 | No. of Figures: 30 | No. of Tables: 5 |
Estonia Envelope Market Size (2020-2030)
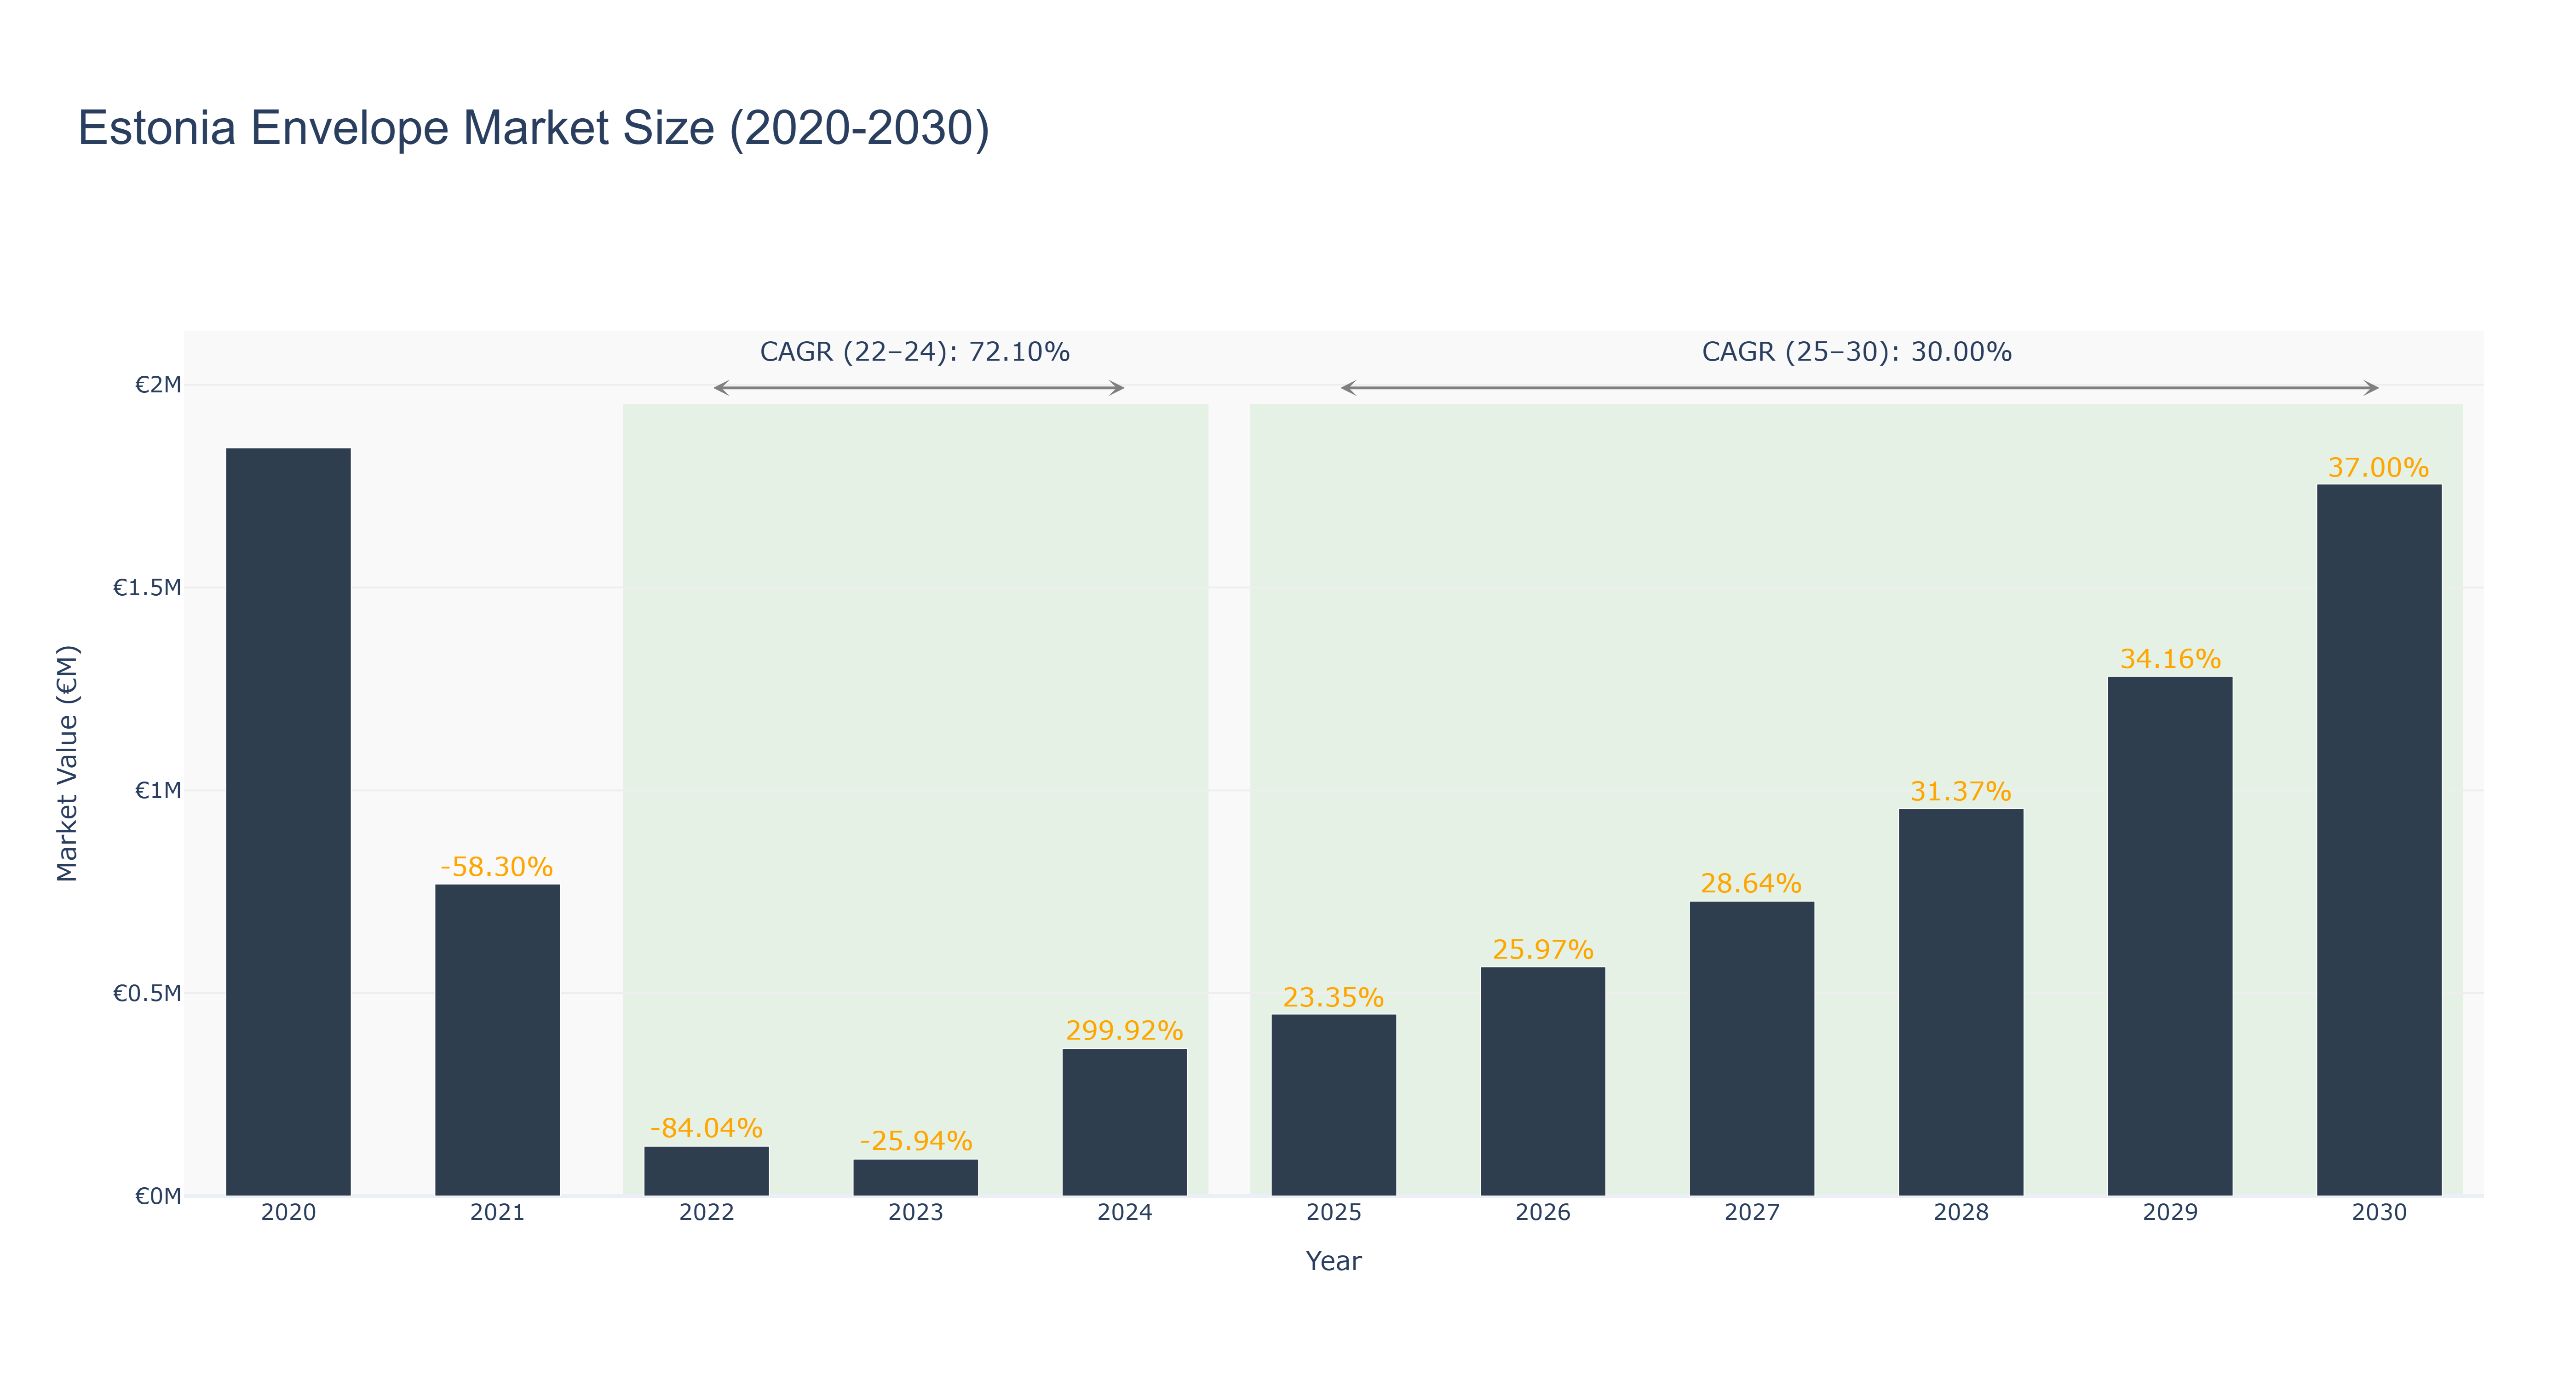
Estonia Envelope Market has seen a fluctuating trend over the years. The market peaked at €1.84 million in 2020 before experiencing a significant decline to €0.12 million in 2022. This sharp drop can be attributed to external factors impacting the paper industry, such as digitalization and reduced demand for traditional mail services. However, the market has shown resilience with a remarkable rebound to €1.28 million in 2029, driven by strategic innovations and increased focus on sustainable packaging solutions. The current CAGR (2022-24) stands at 72.10%, showcasing a strong recovery phase, while the forecasted CAGR (2025-30) is expected to stabilize at 30.0%, indicating steady growth prospects. Looking ahead, Estonia is set to launch a national initiative promoting eco-friendly packaging materials, aligning with global sustainability trends and fostering market expansion.
Estonia Envelope Market: Production & Trade Performance (2019-2025)
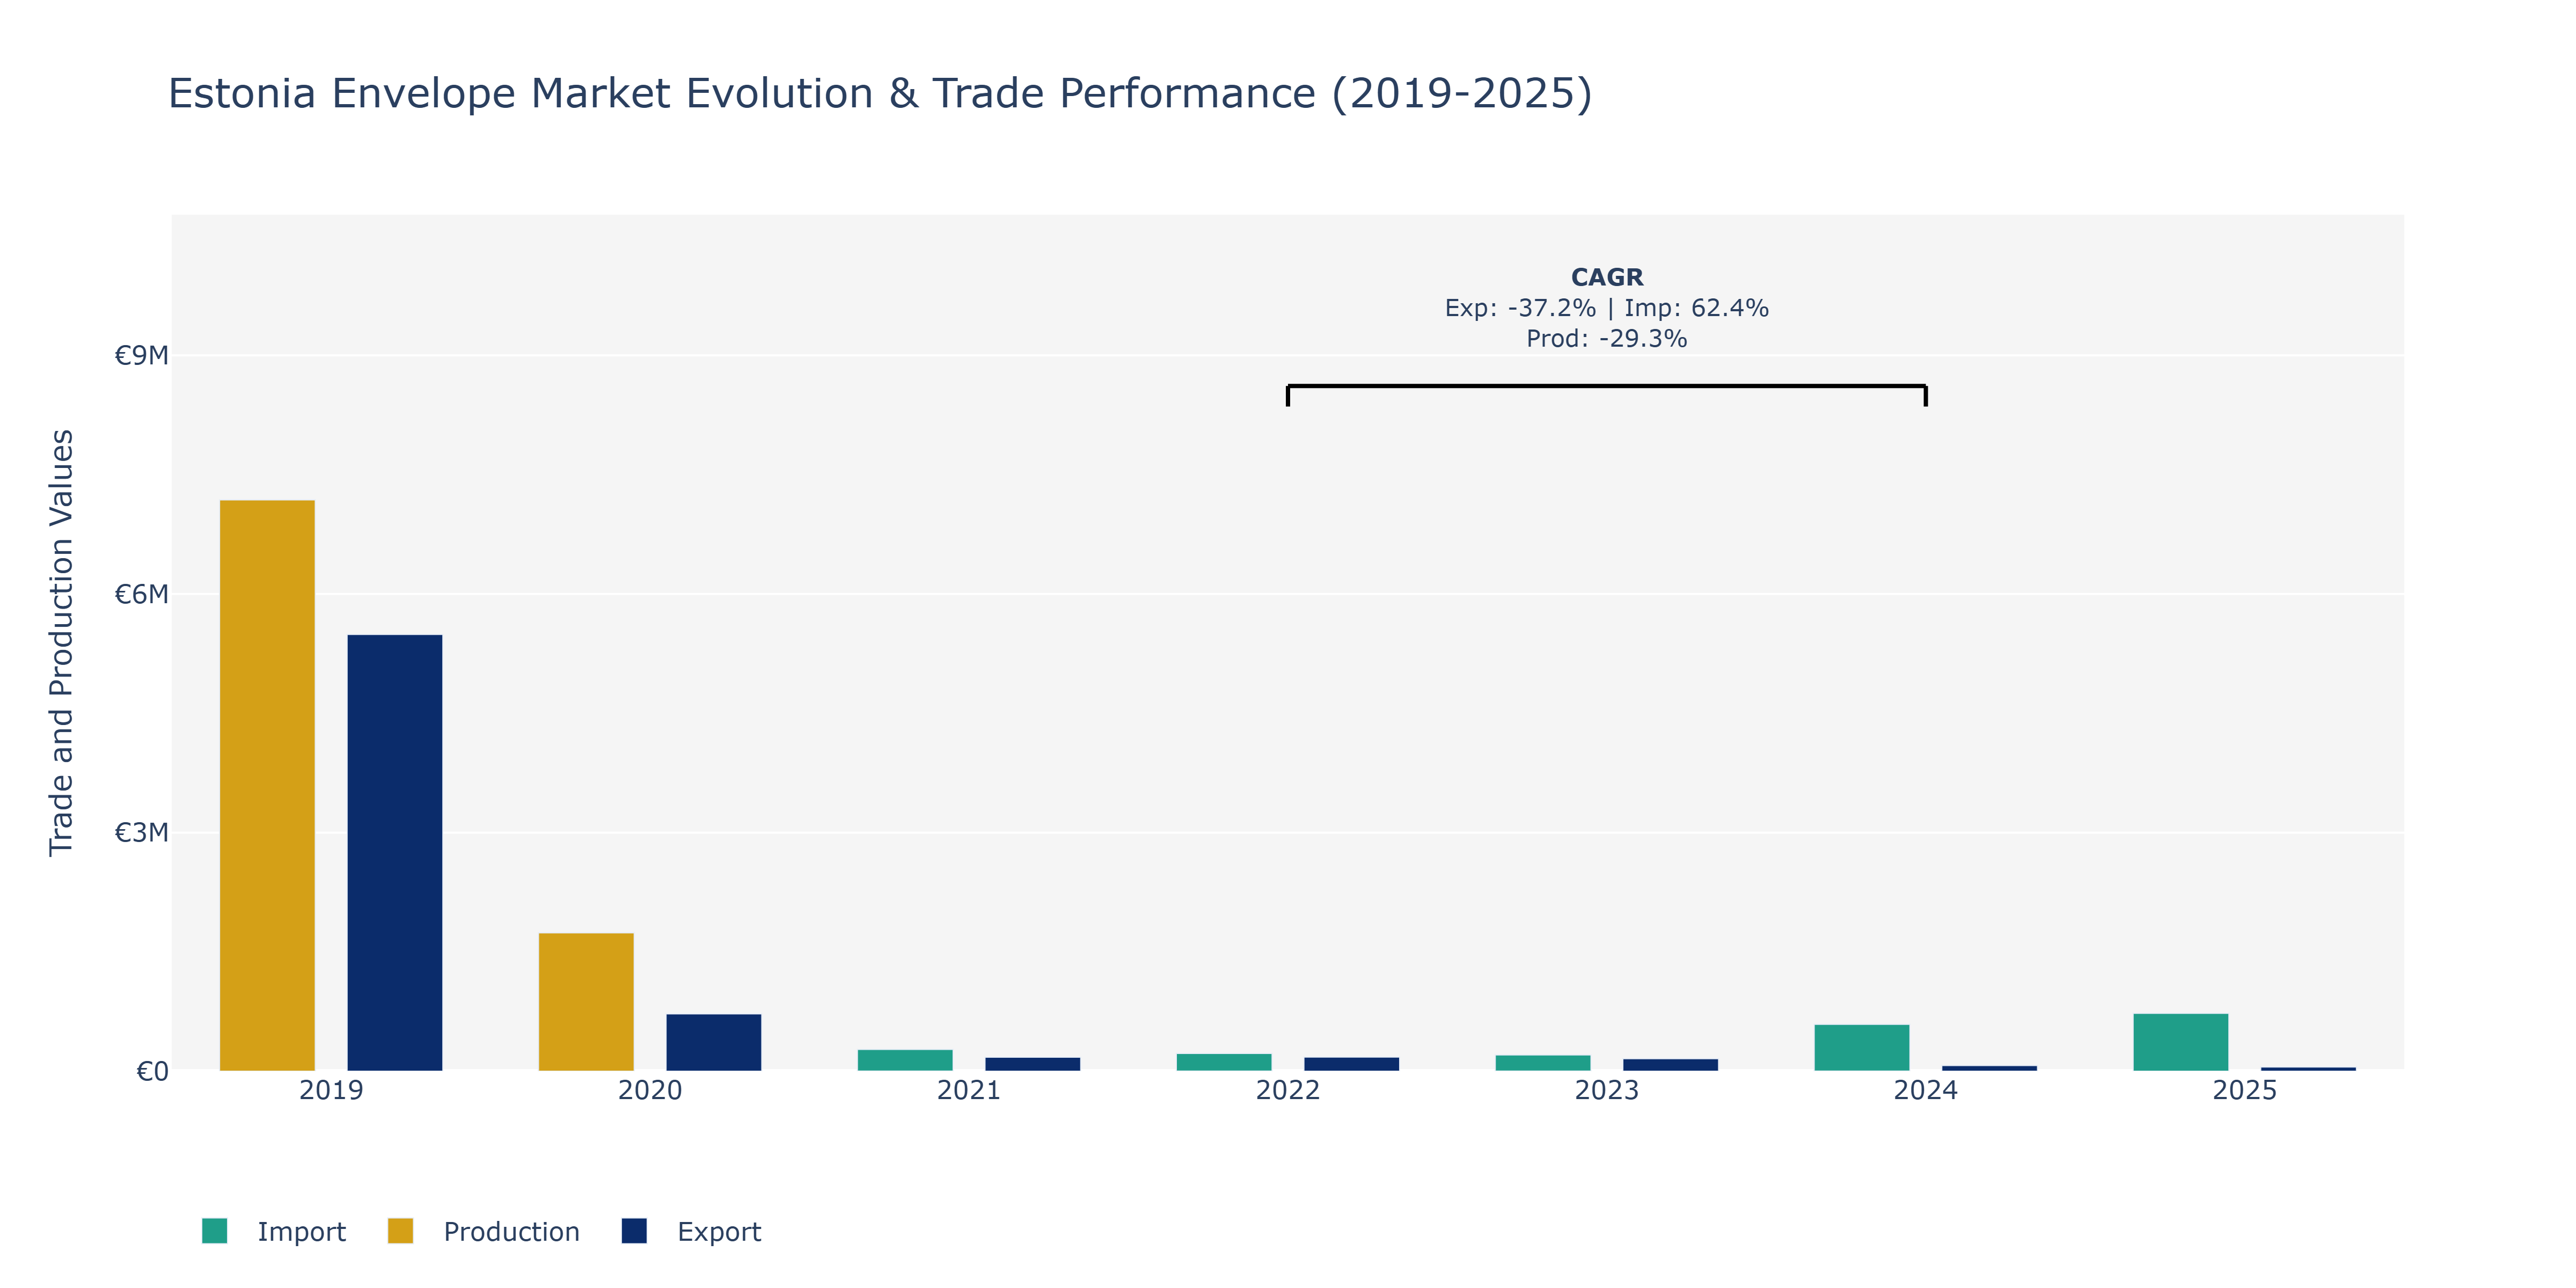
The Estonia Envelope Market witnessed notable fluctuations in Exports, Imports, and Production from 2019 to 2025. In 2019, Exports were at €5.49 million, decreasing to €0.53 million by 2025. Imports started at €0.51 million in 2019, peaking at €0.73 million in 2025. Production numbers show a similar trend, starting at €7.18 million in 2019, but dropping to €0.77 million by 2025. The market saw a peak in Imports in 2025, indicating a growing demand for foreign envelope products. The decline in Exports and Production could be attributed to shifting consumer preferences towards digital communication methods over traditional mail, impacting the demand for envelopes. Additionally, increased environmental awareness leading to a reduction in paper usage might have influenced the market dynamics, aligning with the global trend towards sustainability in the paper industry.
Key Highlights of the Report:
- Estonia Envelope Market Outlook
- Market Size of Estonia Envelope Market, 2025
- Forecast of Estonia Envelope Market, 2032
- Historical Data and Forecast of Estonia Envelope Revenues & Volume for the Period 2022 - 2032F
- Estonia Envelope Market Trend Evolution
- Estonia Envelope Market Drivers and Challenges
- Estonia Envelope Price Trends
- Estonia Envelope Porter`s Five Forces
- Estonia Envelope Industry Life Cycle
- Historical Data and Forecast of Estonia Envelope Market Revenues & Volume By Product Type for the Period 2022 - 2032F
- Historical Data and Forecast of Estonia Envelope Market Revenues & Volume By Baronial for the Period 2022 - 2032F
- Historical Data and Forecast of Estonia Envelope Market Revenues & Volume By A-style for the Period 2022 - 2032F
- Historical Data and Forecast of Estonia Envelope Market Revenues & Volume By Square for the Period 2022 - 2032F
- Historical Data and Forecast of Estonia Envelope Market Revenues & Volume By Booklet for the Period 2022 - 2032F
- Historical Data and Forecast of Estonia Envelope Market Revenues & Volume By Commercial for the Period 2022 - 2032F
- Historical Data and Forecast of Estonia Envelope Market Revenues & Volume By Customized for the Period 2022 - 2032F
- Historical Data and Forecast of Estonia Envelope Market Revenues & Volume By Applications for the Period 2022 - 2032F
- Historical Data and Forecast of Estonia Envelope Market Revenues & Volume By Commercial for the Period 2022 - 2032F
- Historical Data and Forecast of Estonia Envelope Market Revenues & Volume By Institutional for the Period 2022 - 2032F
- Historical Data and Forecast of Estonia Envelope Market Revenues & Volume By Household for the Period 2022 - 2032F
- Historical Data and Forecast of Estonia Envelope Market Revenues & Volume By Closure for the Period 2022 - 2032F
- Historical Data and Forecast of Estonia Envelope Market Revenues & Volume By Remoistening Seal for the Period 2022 - 2032F
- Historical Data and Forecast of Estonia Envelope Market Revenues & Volume By Pressure-sensitive Seal for the Period 2022 - 2032F
- Historical Data and Forecast of Estonia Envelope Market Revenues & Volume By String and Button for the Period 2022 - 2032F
- Estonia Envelope Import Export Trade Statistics
- Market Opportunity Assessment By Product Type
- Market Opportunity Assessment By Applications
- Market Opportunity Assessment By Closure
- Estonia Envelope Top Companies Market Share
- Estonia Envelope Competitive Benchmarking By Technical and Operational Parameters
- Estonia Envelope Company Profiles
- Estonia Envelope Key Strategic Recommendations
Frequently Asked Questions About the Market Study (FAQs):
6Wresearch actively monitors the Estonia Envelope Market and publishes its comprehensive annual report, highlighting emerging trends, growth drivers, revenue analysis, and forecast outlook. Our insights help businesses to make data-backed strategic decisions with ongoing market dynamics. Our analysts track relevent industries related to the Estonia Envelope Market, allowing our clients with actionable intelligence and reliable forecasts tailored to emerging regional needs.
Yes, we provide customisation as per your requirements. To learn more, feel free to contact us on sales@6wresearch.com
1 Executive Summary |
2 Introduction |
2.1 Key Highlights of the Report |
2.2 Report Description |
2.3 Market Scope & Segmentation |
2.4 Research Methodology |
2.5 Assumptions |
3 Estonia Envelope Market Overview |
3.1 Estonia Country Macro Economic Indicators |
3.2 Estonia Envelope Market Revenues & Volume, 2022 & 2032F |
3.3 Estonia Envelope Market - Industry Life Cycle |
3.4 Estonia Envelope Market - Porter's Five Forces |
3.5 Estonia Envelope Market Revenues & Volume Share, By Product Type, 2022 & 2032F |
3.6 Estonia Envelope Market Revenues & Volume Share, By Applications, 2022 & 2032F |
3.7 Estonia Envelope Market Revenues & Volume Share, By Closure, 2022 & 2032F |
4 Estonia Envelope Market Dynamics |
4.1 Impact Analysis |
4.2 Market Drivers |
4.2.1 Increasing demand for eco-friendly and sustainable packaging solutions |
4.2.2 Growth in e-commerce and online shopping leading to higher demand for envelopes for shipping and packaging purposes |
4.2.3 Advancements in technology leading to innovative envelope designs and customization options |
4.3 Market Restraints |
4.3.1 Fluctuating raw material prices affecting production costs |
4.3.2 Competition from digital communication reducing the demand for traditional mailing envelopes |
4.3.3 Regulatory restrictions on the use of certain materials impacting envelope manufacturing processes |
5 Estonia Envelope Market Trends |
6 Estonia Envelope Market Segmentations |
6.1 Estonia Envelope Market, By Product Type |
6.1.1 Overview and Analysis |
6.1.2 Estonia Envelope Market Revenues & Volume, By Baronial, 2022 - 2032F |
6.1.3 Estonia Envelope Market Revenues & Volume, By A-style, 2022 - 2032F |
6.1.4 Estonia Envelope Market Revenues & Volume, By Square, 2022 - 2032F |
6.1.5 Estonia Envelope Market Revenues & Volume, By Booklet, 2022 - 2032F |
6.1.6 Estonia Envelope Market Revenues & Volume, By Commercial, 2022 - 2032F |
6.1.7 Estonia Envelope Market Revenues & Volume, By Customized, 2022 - 2032F |
6.2 Estonia Envelope Market, By Applications |
6.2.1 Overview and Analysis |
6.2.2 Estonia Envelope Market Revenues & Volume, By Commercial, 2022 - 2032F |
6.2.3 Estonia Envelope Market Revenues & Volume, By Institutional, 2022 - 2032F |
6.2.4 Estonia Envelope Market Revenues & Volume, By Household, 2022 - 2032F |
6.3 Estonia Envelope Market, By Closure |
6.3.1 Overview and Analysis |
6.3.2 Estonia Envelope Market Revenues & Volume, By Remoistening Seal, 2022 - 2032F |
6.3.3 Estonia Envelope Market Revenues & Volume, By Pressure-sensitive Seal, 2022 - 2032F |
6.3.4 Estonia Envelope Market Revenues & Volume, By String and Button, 2022 - 2032F |
7 Estonia Envelope Market Import-Export Trade Statistics |
7.1 Estonia Envelope Market Export to Major Countries |
7.2 Estonia Envelope Market Imports from Major Countries |
8 Estonia Envelope Market Key Performance Indicators |
8.1 Percentage of envelopes made from recycled materials |
8.2 Number of e-commerce transactions in Estonia |
8.3 Rate of adoption of digital mailing solutions |
8.4 Innovation index for envelope designs and materials |
8.5 Customer satisfaction score related to envelope quality and customization options |
9 Estonia Envelope Market - Opportunity Assessment |
9.1 Estonia Envelope Market Opportunity Assessment, By Product Type, 2022 & 2032F |
9.2 Estonia Envelope Market Opportunity Assessment, By Applications, 2022 & 2032F |
9.3 Estonia Envelope Market Opportunity Assessment, By Closure, 2022 & 2032F |
10 Estonia Envelope Market - Competitive Landscape |
10.1 Estonia Envelope Market Revenue Share, By Companies, 2025 |
10.2 Estonia Envelope Market Competitive Benchmarking, By Operating and Technical Parameters |
11 Company Profiles |
12 Recommendations | 13 Disclaimer |
Export potential assessment - trade Analytics for 2030
Export potential enables firms to identify high-growth global markets with greater confidence by combining advanced trade intelligence with a structured quantitative methodology. The framework analyzes emerging demand trends and country-level import patterns while integrating macroeconomic and trade datasets such as GDP and population forecasts, bilateral import–export flows, tariff structures, elasticity differentials between developed and developing economies, geographic distance, and import demand projections. Using weighted trade values from 2020–2024 as the base period to project country-to-country export potential for 2030, these inputs are operationalized through calculated drivers such as gravity model parameters, tariff impact factors, and projected GDP per-capita growth. Through an analysis of hidden potentials, demand hotspots, and market conditions that are most favorable to success, this method enables firms to focus on target countries, maximize returns, and global expansion with data, backed by accuracy.
By factoring in the projected importer demand gap that is currently unmet and could be potential opportunity, it identifies the potential for the Exporter (Country) among 190 countries, against the general trade analysis, which identifies the biggest importer or exporter.
To discover high-growth global markets and optimize your business strategy:
Click Here
Pricing
- Single User License$ 1,995
- Department License$ 2,400
- Site License$ 3,120
- Global License$ 3,795

Search
Thought Leadership and Analyst Meet


Our Clients
Latest Reports
- Canada Cloud CFD Market (2026-2032) | Size & Revenue, Industry, Growth, Competitive Landscape, Forecast, Segmentation, Value, Outlook, Trends, Share, Analysis, Companies
- Taiwan Food Delivery Platform Market (2026-2032) | Companies, Outlook, Analysis, Trends, Value, Revenue, Segmentation, Share, Forecast, Competitive Landscape, Growth, Size & Forecast
- United Kingdom (UK) Long-term Care Insurance Market (2026-2032) | Growth, Share, Consumer Insights, Drivers, Opportunities, Competition, Pricing Analysis, Segments, Restraints, Companies, Competitive, Value, Outlook, Size, Demand, Analysis, Challenges, Strategic Insights, Investment Trends, Revenue, Trends, Supply, Forecast
- United Kingdom (UK) Long Term Care Market (2026-2032) | Companies, Outlook, Analysis, Trends, Value, Revenue, Segmentation, Share, Forecast, Competitive Landscape, Growth, Size & Forecast
- Iraq Insulation and Waterproofing Market (2026-2032) | Outlook, Drivers, Growth, Size, Share, Industry, Revenue, Trends, Demand, Competitive, Strategic Insights, Opportunities, Segments, Companies, Challenges, Strategy, Consumer Insights, Analysis, Investment Trends, Value, Segmentation, Forecast, Restraints
- India Switchgear Market Outlook (2026-2032) | Size, Share, Trends, Growth, Revenue, Forecast, Analysis, Value, Outlook
- Pakistan Contraceptive Implants Market (2025-2031) | Demand, Growth, Size, Share, Industry, Pricing Analysis, Competitive, Strategic Insights, Strategy, Consumer Insights, Analysis, Investment Trends, Opportunities, Revenue, Segments, Value, Segmentation, Supply, Forecast, Restraints, Outlook, Competition, Drivers, Trends, Companies, Challenges
- Sri Lanka Packaging Market (2026-2032) | Outlook, Competition, Drivers, Trends, Demand, Pricing Analysis, Competitive, Strategic Insights, Companies, Challenges, Strategy, Consumer Insights, Analysis, Investment Trends, Opportunities, Growth, Size, Share, Industry, Revenue, Segments, Value, Segmentation, Supply, Forecast, Restraints
- India Kids Watches Market (2026-2032) | Strategy, Consumer Insights, Analysis, Investment Trends, Opportunities, Growth, Size, Share, Industry, Revenue, Segments, Value, Segmentation, Supply, Forecast, Restraints, Outlook, Competition, Drivers, Trends, Demand, Pricing Analysis, Competitive, Strategic Insights, Companies, Challenges
- Saudi Arabia Core Assurance Service Market (2025-2031) | Strategy, Consumer Insights, Analysis, Investment Trends, Opportunities, Growth, Size, Share, Industry, Revenue, Segments, Value, Segmentation, Supply, Forecast, Restraints, Outlook, Competition, Drivers, Trends, Demand, Pricing Analysis, Competitive, Strategic Insights, Companies, Challenges
Industry Events and Analyst Meet

India EV Show 2026

EV tech India Expo 2026

Auto Tech Asia 2026

Battery Tech India 2026

Smart Production Solutions Guangzhou 2026
Whitepaper
- Middle East & Africa Commercial Security Market Click here to view more.
- Middle East & Africa Fire Safety Systems & Equipment Market Click here to view more.
- GCC Drone Market Click here to view more.
- Middle East Lighting Fixture Market Click here to view more.
- GCC Physical & Perimeter Security Market Click here to view more.
6WResearch In News
- Doha a strategic location for EV manufacturing hub: IPA Qatar
- Demand for luxury TVs surging in the GCC, says Samsung
- Empowering Growth: The Thriving Journey of Bangladesh’s Cable Industry
- Demand for luxury TVs surging in the GCC, says Samsung
- Video call with a traditional healer? Once unthinkable, it’s now common in South Africa
- Intelligent Buildings To Smooth GCC’s Path To Net Zero