Estonia Flavored Candy Market (2026-2032) | Segmentation, Analysis, Value, Companies, Forecast, Industry, Outlook, Size & Revenue, Competitive Landscape, Growth, Share, Trends
Market Forecast By Flavor (Fruit Flavored, Chocolate, Caramel, Butterscotch, Cinnamon, Coffee, Licorice, Sour), By Type (Hard Boiled Candies, Pastilles, Gums, Jellies and Chews, Toffees, Caramels and Nougat, Mints), By Distribution Channel (Supermarkets and Hypermarkets, Convenience Stores, Specialist Retailers, Online Retail) And Competitive Landscape
| Product Code: ETC7132544 | Publication Date: Sep 2024 | Updated Date: Apr 2026 | Product Type: Market Research Report | |
| Publisher: 6Wresearch | Author: Summon Dutta | No. of Pages: 75 | No. of Figures: 35 | No. of Tables: 20 |
Estonia Flavored Candy Market Size (2020-2030)
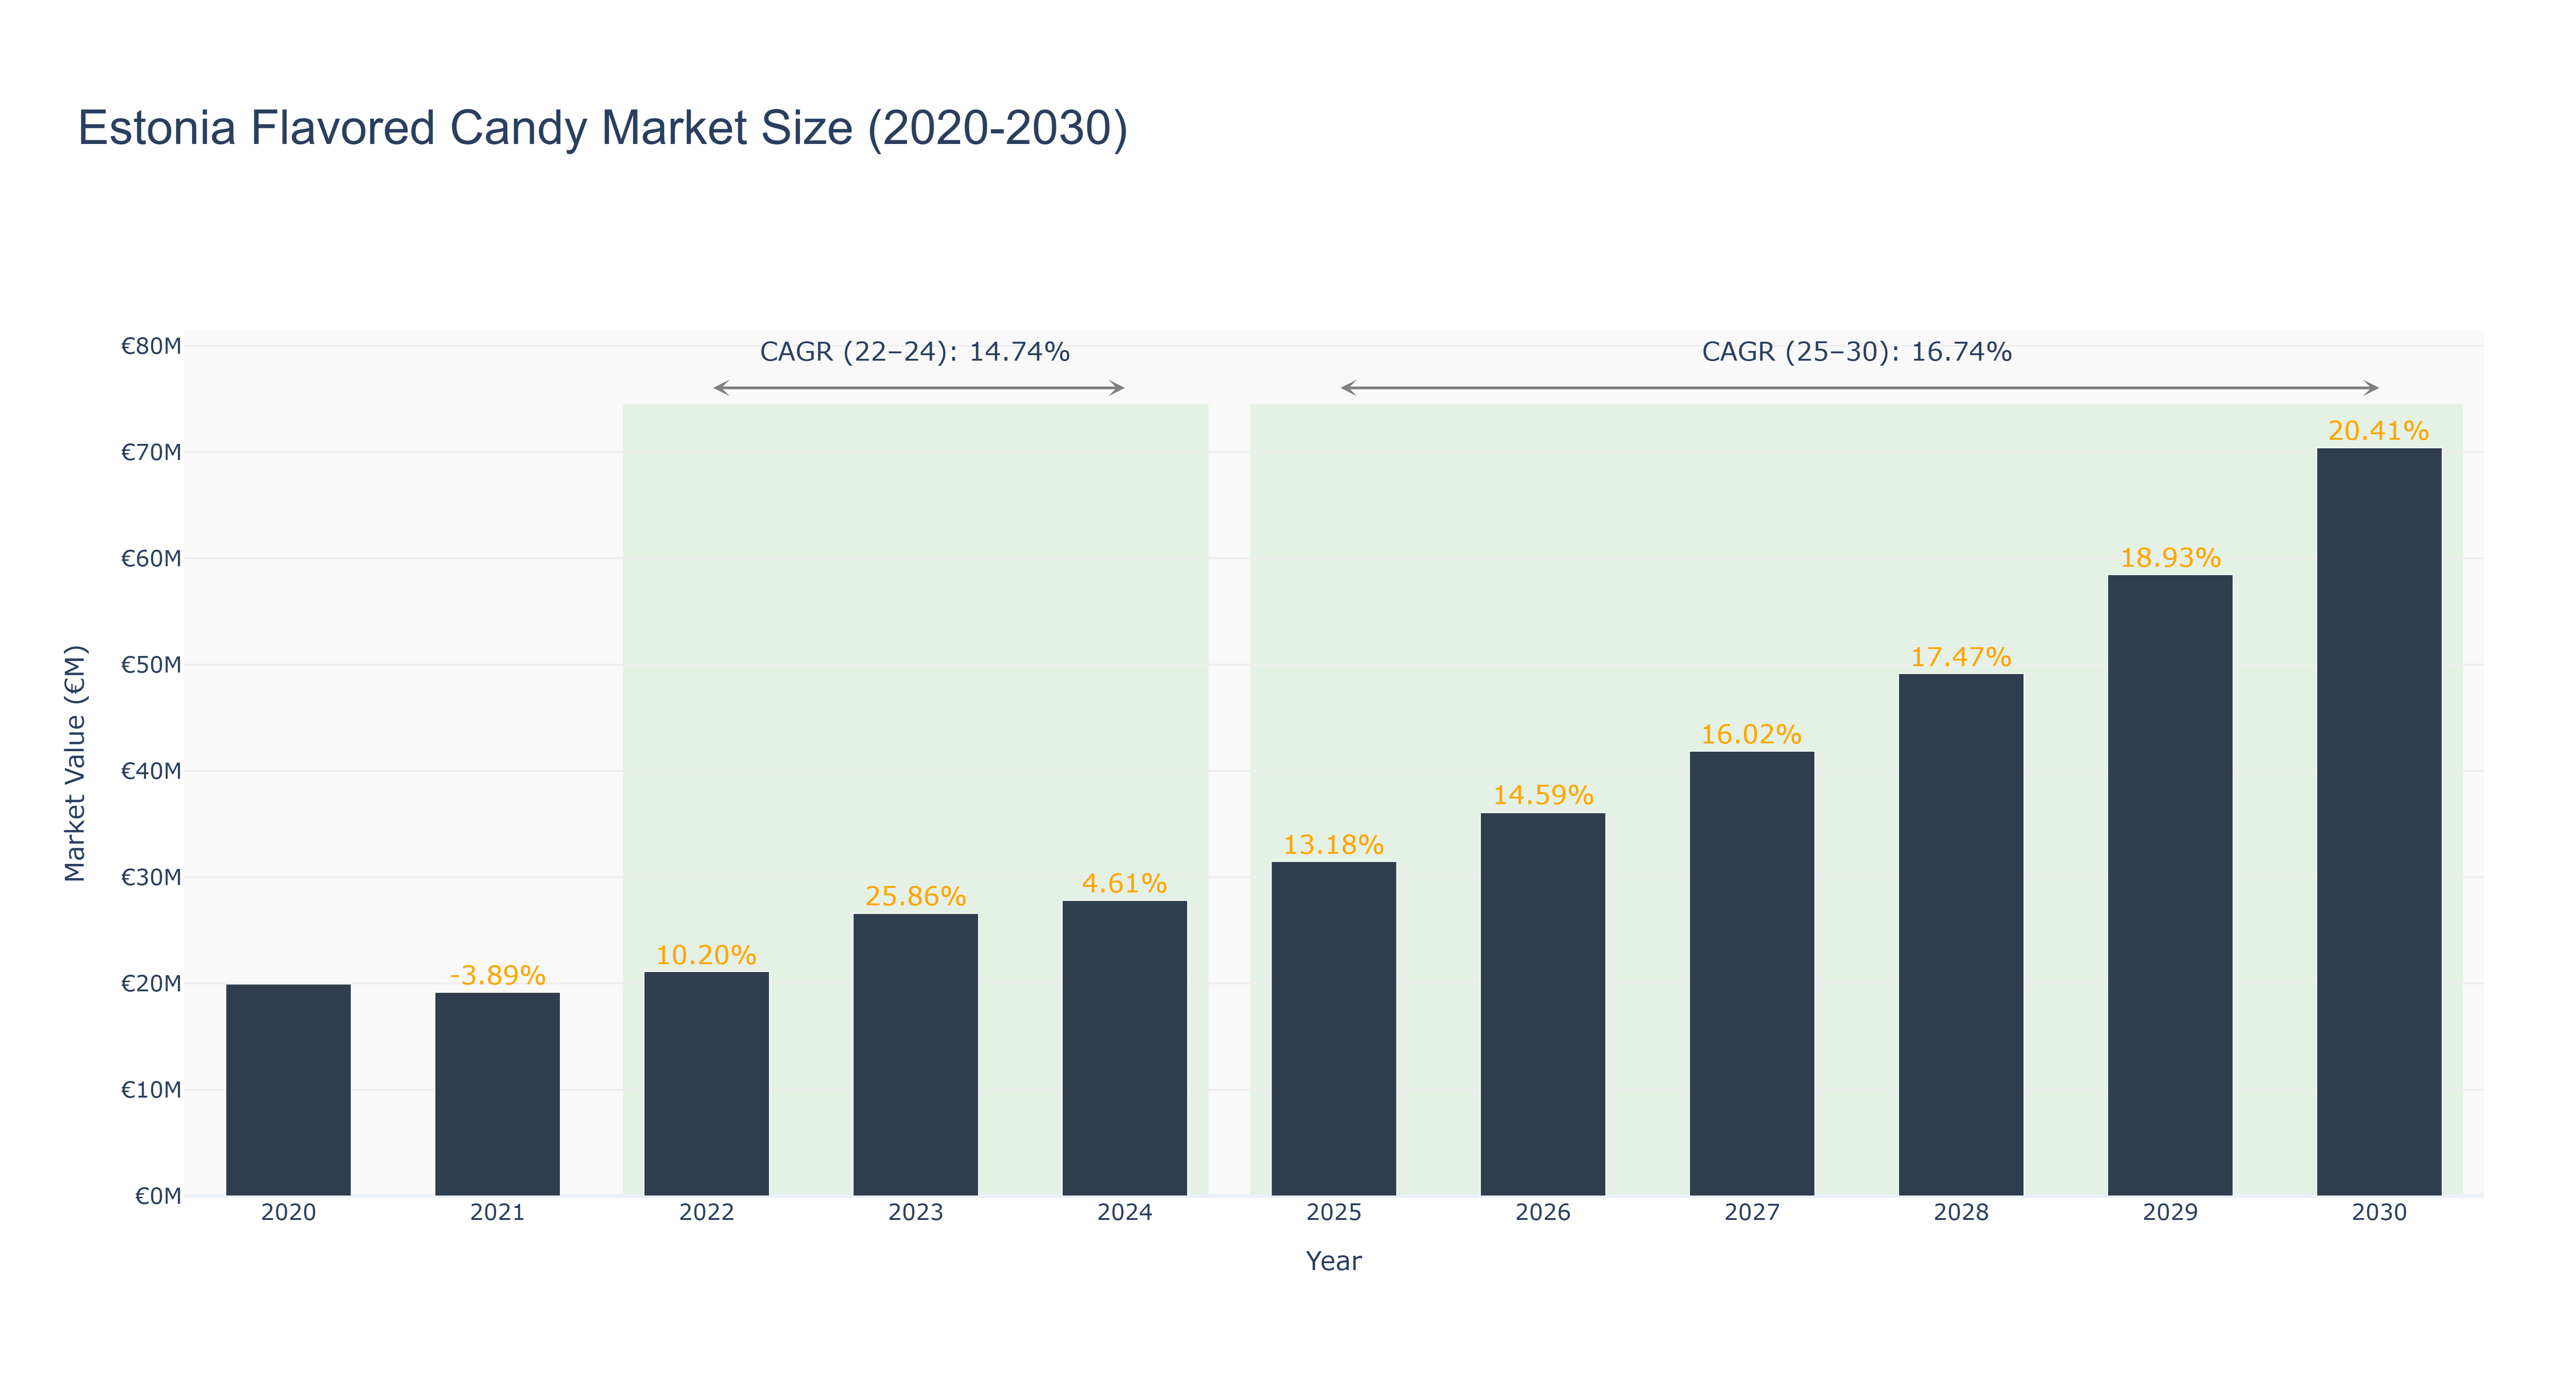
The Estonia Flavored Candy Market has shown a steady growth trajectory over the years. The market peaked at €70.40 million in 2030, with a notable CAGR of 14.74% from 2022 to 2024 and a projected CAGR of 16.74% from 2025 to 2030. The actual market size saw consistent increases from €19.94 million in 2020 to €27.81 million in 2024, driven by evolving consumer preferences and innovative product offerings. The forecasted growth can be attributed to expanding distribution channels and increasing disposable incomes. In line with this growth, Estonia is set to witness the launch of a new state-of-the-art candy manufacturing facility in 2027, aimed at further boosting the local confectionery industry. This market trend underscores the resilience and potential of the Estonia Flavored Candy Market, supported by industry drivers like shifting consumer tastes and strategic market expansions.
Estonia Flavored Candy Market: Production & Trade Performance (2019-2025)
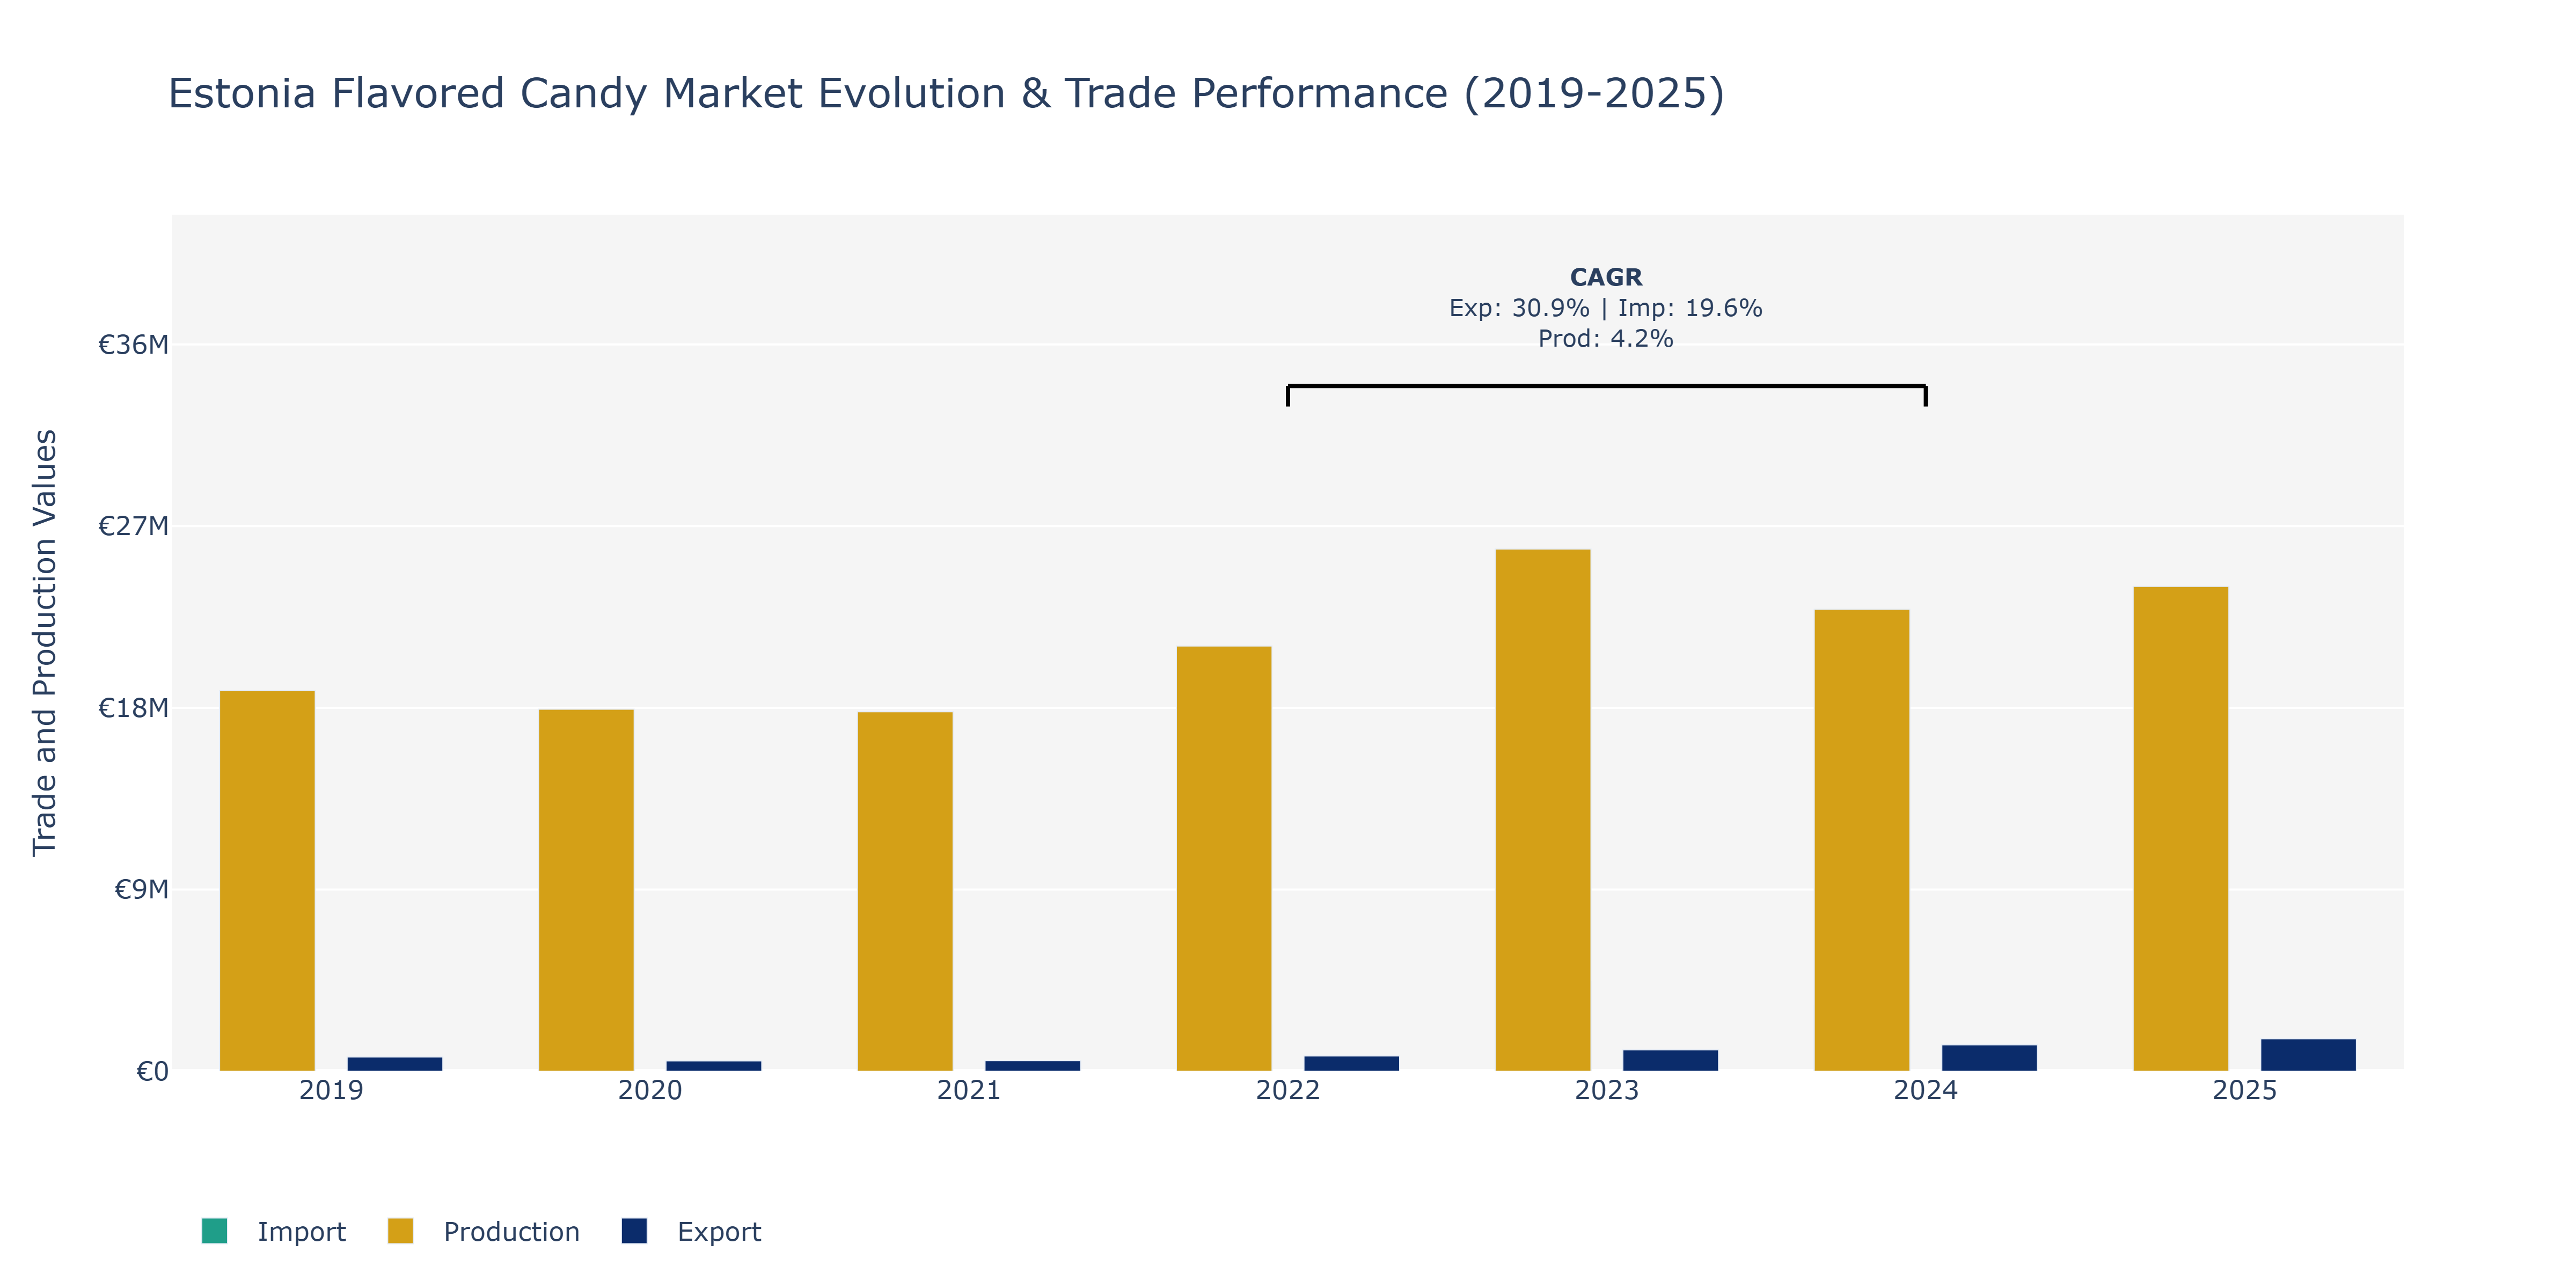
Between 2019 and 2025, the Estonia Flavored Candy Market demonstrated notable fluctuations in exports, imports, and production. Exports saw a steady increase from €705.09 thousand in 2019 to €1.61 million in 2025, indicating a growing demand for Estonian flavored candies abroad. Imports followed a similar upward trajectory, rising from €2.19 million in 2019 to €3.81 million in 2025, potentially driven by a preference for unique flavors not readily available domestically. In contrast, production levels fluctuated, peaking at €25.87 billion in 2023 before slightly declining to €24.01 billion in 2025. This decline could be attributed to market saturation or shifts in consumer preferences towards healthier snack options. The CAGR for exports and imports during 2022–2024 suggests a robust market performance, possibly driven by strategic marketing initiatives or innovative product offerings. To sustain growth, manufacturers could focus on expanding distribution networks or introducing new flavors based on market trends to capitalize on the increasing popularity of flavored candies globally.
Key Highlights of the Report:
- Estonia Flavored Candy Market Outlook
- Market Size of Estonia Flavored Candy Market, 2025
- Forecast of Estonia Flavored Candy Market, 2032
- Historical Data and Forecast of Estonia Flavored Candy Revenues & Volume for the Period 2022 - 2032
- Estonia Flavored Candy Market Trend Evolution
- Estonia Flavored Candy Market Drivers and Challenges
- Estonia Flavored Candy Price Trends
- Estonia Flavored Candy Porter's Five Forces
- Estonia Flavored Candy Industry Life Cycle
- Historical Data and Forecast of Estonia Flavored Candy Market Revenues & Volume By Flavor for the Period 2022 - 2032
- Historical Data and Forecast of Estonia Flavored Candy Market Revenues & Volume By Fruit Flavored for the Period 2022 - 2032
- Historical Data and Forecast of Estonia Flavored Candy Market Revenues & Volume By Chocolate for the Period 2022 - 2032
- Historical Data and Forecast of Estonia Flavored Candy Market Revenues & Volume By Caramel for the Period 2022 - 2032
- Historical Data and Forecast of Estonia Flavored Candy Market Revenues & Volume By Butterscotch for the Period 2022 - 2032
- Historical Data and Forecast of Estonia Flavored Candy Market Revenues & Volume By Cinnamon for the Period 2022 - 2032
- Historical Data and Forecast of Estonia Flavored Candy Market Revenues & Volume By Coffee for the Period 2022 - 2032
- Historical Data and Forecast of Estonia Flavored Candy Market Revenues & Volume By Licorice for the Period 2022 - 2032
- Historical Data and Forecast of Estonia Fruit Flavored Flavored Candy Market Revenues & Volume By Sour for the Period 2022 - 2032
- Historical Data and Forecast of Estonia Flavored Candy Market Revenues & Volume By Type for the Period 2022 - 2032
- Historical Data and Forecast of Estonia Flavored Candy Market Revenues & Volume By Hard Boiled Candies for the Period 2022 - 2032
- Historical Data and Forecast of Estonia Flavored Candy Market Revenues & Volume By Pastilles for the Period 2022 - 2032
- Historical Data and Forecast of Estonia Flavored Candy Market Revenues & Volume By Gums for the Period 2022 - 2032
- Historical Data and Forecast of Estonia Flavored Candy Market Revenues & Volume By Jellies and Chews for the Period 2022 - 2032
- Historical Data and Forecast of Estonia Flavored Candy Market Revenues & Volume By Toffees for the Period 2022 - 2032
- Historical Data and Forecast of Estonia Flavored Candy Market Revenues & Volume By Caramels and Nougat for the Period 2022 - 2032
- Historical Data and Forecast of Estonia Flavored Candy Market Revenues & Volume By Mints for the Period 2022 - 2032
- Historical Data and Forecast of Estonia Flavored Candy Market Revenues & Volume By Distribution Channel for the Period 2022 - 2032
- Historical Data and Forecast of Estonia Flavored Candy Market Revenues & Volume By Supermarkets and Hypermarkets for the Period 2022 - 2032
- Historical Data and Forecast of Estonia Flavored Candy Market Revenues & Volume By Convenience Stores for the Period 2022 - 2032
- Historical Data and Forecast of Estonia Flavored Candy Market Revenues & Volume By Specialist Retailers for the Period 2022 - 2032
- Historical Data and Forecast of Estonia Flavored Candy Market Revenues & Volume By Online Retail for the Period 2022 - 2032
- Estonia Flavored Candy Import Export Trade Statistics
- Market Opportunity Assessment By Flavor
- Market Opportunity Assessment By Type
- Market Opportunity Assessment By Distribution Channel
- Estonia Flavored Candy Top Companies Market Share
- Estonia Flavored Candy Competitive Benchmarking By Technical and Operational Parameters
- Estonia Flavored Candy Company Profiles
- Estonia Flavored Candy Key Strategic Recommendations
Frequently Asked Questions About the Market Study (FAQs):
6Wresearch actively monitors the Estonia Flavored Candy Market and publishes its comprehensive annual report, highlighting emerging trends, growth drivers, revenue analysis, and forecast outlook. Our insights help businesses to make data-backed strategic decisions with ongoing market dynamics. Our analysts track relevent industries related to the Estonia Flavored Candy Market, allowing our clients with actionable intelligence and reliable forecasts tailored to emerging regional needs.
Yes, we provide customisation as per your requirements. To learn more, feel free to contact us on sales@6wresearch.com
1 Executive Summary |
2 Introduction |
2.1 Key Highlights of the Report |
2.2 Report Description |
2.3 Market Scope & Segmentation |
2.4 Research Methodology |
2.5 Assumptions |
3 Estonia Flavored Candy Market Overview |
3.1 Estonia Country Macro Economic Indicators |
3.2 Estonia Flavored Candy Market Revenues & Volume, 2022 & 2032F |
3.3 Estonia Flavored Candy Market - Industry Life Cycle |
3.4 Estonia Flavored Candy Market - Porter's Five Forces |
3.5 Estonia Flavored Candy Market Revenues & Volume Share, By Flavor, 2022 & 2032F |
3.6 Estonia Flavored Candy Market Revenues & Volume Share, By Type, 2022 & 2032F |
3.7 Estonia Flavored Candy Market Revenues & Volume Share, By Distribution Channel, 2022 & 2032F |
4 Estonia Flavored Candy Market Dynamics |
4.1 Impact Analysis |
4.2 Market Drivers |
4.3 Market Restraints |
5 Estonia Flavored Candy Market Trends |
6 Estonia Flavored Candy Market, By Types |
6.1 Estonia Flavored Candy Market, By Flavor |
6.1.1 Overview and Analysis |
6.1.2 Estonia Flavored Candy Market Revenues & Volume, By Flavor, 2022 - 2032F |
6.1.3 Estonia Flavored Candy Market Revenues & Volume, By Fruit Flavored, 2022 - 2032F |
6.1.4 Estonia Flavored Candy Market Revenues & Volume, By Chocolate, 2022 - 2032F |
6.1.5 Estonia Flavored Candy Market Revenues & Volume, By Caramel, 2022 - 2032F |
6.1.6 Estonia Flavored Candy Market Revenues & Volume, By Butterscotch, 2022 - 2032F |
6.1.7 Estonia Flavored Candy Market Revenues & Volume, By Sour, 2022 - 2032F |
6.1.8 Estonia Flavored Candy Market Revenues & Volume, By Peanut Butter, 2022 - 2032F |
6.2 Estonia Flavored Candy Market, By Type |
6.2.1 Overview and Analysis |
6.2.2 Estonia Flavored Candy Market Revenues & Volume, By Hard Boiled Candies, 2022 - 2032F |
6.2.3 Estonia Flavored Candy Market Revenues & Volume, By Pastilles, 2022 - 2032F |
6.2.4 Estonia Flavored Candy Market Revenues & Volume, By Gums, 2022 - 2032F |
6.2.5 Estonia Flavored Candy Market Revenues & Volume, By Jellies and Chews, 2022 - 2032F |
6.2.6 Estonia Flavored Candy Market Revenues & Volume, By Toffees, 2022 - 2032F |
6.2.7 Estonia Flavored Candy Market Revenues & Volume, By Mints, 2022 - 2032F |
6.3 Estonia Flavored Candy Market, By Distribution Channel |
6.3.1 Overview and Analysis |
6.3.2 Estonia Flavored Candy Market Revenues & Volume, By Supermarkets and Hypermarkets, 2022 - 2032F |
6.3.3 Estonia Flavored Candy Market Revenues & Volume, By Convenience Stores, 2022 - 2032F |
6.3.4 Estonia Flavored Candy Market Revenues & Volume, By Specialist Retailers, 2022 - 2032F |
6.3.5 Estonia Flavored Candy Market Revenues & Volume, By Online Retail, 2022 - 2032F |
6.3.6 Estonia Flavored Candy Market Revenues & Volume, By Others, 2022 - 2032F |
7 Estonia Flavored Candy Market Import-Export Trade Statistics |
7.1 Estonia Flavored Candy Market Export to Major Countries |
7.2 Estonia Flavored Candy Market Imports from Major Countries |
8 Estonia Flavored Candy Market Key Performance Indicators |
9 Estonia Flavored Candy Market - Opportunity Assessment |
9.1 Estonia Flavored Candy Market Opportunity Assessment, By Flavor, 2022 & 2032F |
9.2 Estonia Flavored Candy Market Opportunity Assessment, By Type, 2022 & 2032F |
9.3 Estonia Flavored Candy Market Opportunity Assessment, By Distribution Channel, 2022 & 2032F |
10 Estonia Flavored Candy Market - Competitive Landscape |
10.1 Estonia Flavored Candy Market Revenue Share, By Companies, 2025 |
10.2 Estonia Flavored Candy Market Competitive Benchmarking, By Operating and Technical Parameters |
11 Company Profiles |
12 Recommendations |
13 Disclaimer |
Global Go To Market Strategy - 2030
Export potential enables firms to identify high-growth global markets with greater confidence by combining advanced trade intelligence with a structured quantitative methodology. The framework analyzes emerging demand trends and country-level import patterns while integrating macroeconomic and trade datasets such as GDP and population forecasts, bilateral import–export flows, tariff structures, elasticity differentials between developed and developing economies, geographic distance, and import demand projections. Using weighted trade values from 2020–2024 as the base period to project country-to-country export potential for 2030, these inputs are operationalized through calculated drivers such as gravity model parameters, tariff impact factors, and projected GDP per-capita growth. Through an analysis of hidden potentials, demand hotspots, and market conditions that are most favorable to success, this method enables firms to focus on target countries, maximize returns, and global expansion with data, backed by accuracy.
By factoring in the projected importer demand gap that is currently unmet and could be potential opportunity, it identifies the potential for the Exporter (Country) among 190 countries, against the general trade analysis, which identifies the biggest importer or exporter.
To discover high-growth global markets and optimize your business strategy:
Click Here
Pricing
- Single User License$ 1,995
- Department License$ 2,400
- Site License$ 3,120
- Global License$ 3,795

Leadership Perspectives from Industry Events
Search
Thought Leadership and Analyst Meet


Our Clients
6WResearch In News
- India Air Conditioner Market Set for Strong Rebound in 2026 After Weather-Led Correction and GST-Driven Recovery: 6Wresearch
- ADAS in India: How Automatic Emergency Braking, Blind Spot Detection & Driver Monitoring are Transforming Road Safety
- Doha a strategic location for EV manufacturing hub: IPA Qatar
- Demand for luxury TVs surging in the GCC, says Samsung
- Empowering Growth: The Thriving Journey of Bangladesh’s Cable Industry
- Demand for luxury TVs surging in the GCC, says Samsung
Latest Reports
- Nicaragua RPG Gaming Market (2026-2032)
- New Zealand RPG Gaming Market (2026-2032)
- Netherlands RPG Gaming Market (2026-2032)
- Nauru RPG Gaming Market (2026-2032)
- Namibia RPG Gaming Market (2026-2032)
- Mozambique RPG Gaming Market (2026-2032)
- Montenegro RPG Gaming Market (2026-2032)
- Mongolia RPG Gaming Market (2026-2032)
- Monaco RPG Gaming Market (2026-2032)
- Micronesia RPG Gaming Market (2026-2032)
Industry Events and Analyst Meet

EV India Expo 2026

HIMTEX 2026

India Refining Summit 2026

India EV Show 2026

EV tech India Expo 2026
Whitepaper
- Middle East & Africa Commercial Security Market Click here to view more.
- Middle East & Africa Fire Safety Systems & Equipment Market Click here to view more.
- GCC Drone Market Click here to view more.
- Middle East Lighting Fixture Market Click here to view more.
- GCC Physical & Perimeter Security Market Click here to view more.