Estonia Food Cans Market (2026-2032) | Companies, Value, Size & Revenue, Forecast, Trends, Growth, Segmentation, Outlook, Share, Competitive Landscape, Industry, Analysis
Market Forecast By Product (2 Piece Cans, 3 Piece Cans), By Material (Metal, Paperboard, Plastic), By Capacity (Less than 100 gm, 100 gm300 gm, 301 gm500 gm, More than 500 gm), By End-use (Meat and Poultry & Seafood, Pet Food, Bakery & Confectionery, Sauces and Jams & Pickles, Fruits & Vegetables, Tea & Coffee, Others (Baby Food, Ready Meals, Nutrition Food, Dairy, etc.)) And Competitive Landscape
| Product Code: ETC7132795 | Publication Date: Sep 2024 | Updated Date: Apr 2026 | Product Type: Market Research Report | |
| Publisher: 6Wresearch | Author: Summon Dutta | No. of Pages: 75 | No. of Figures: 35 | No. of Tables: 20 |
Estonia Food Cans Market Size (2020-2030)
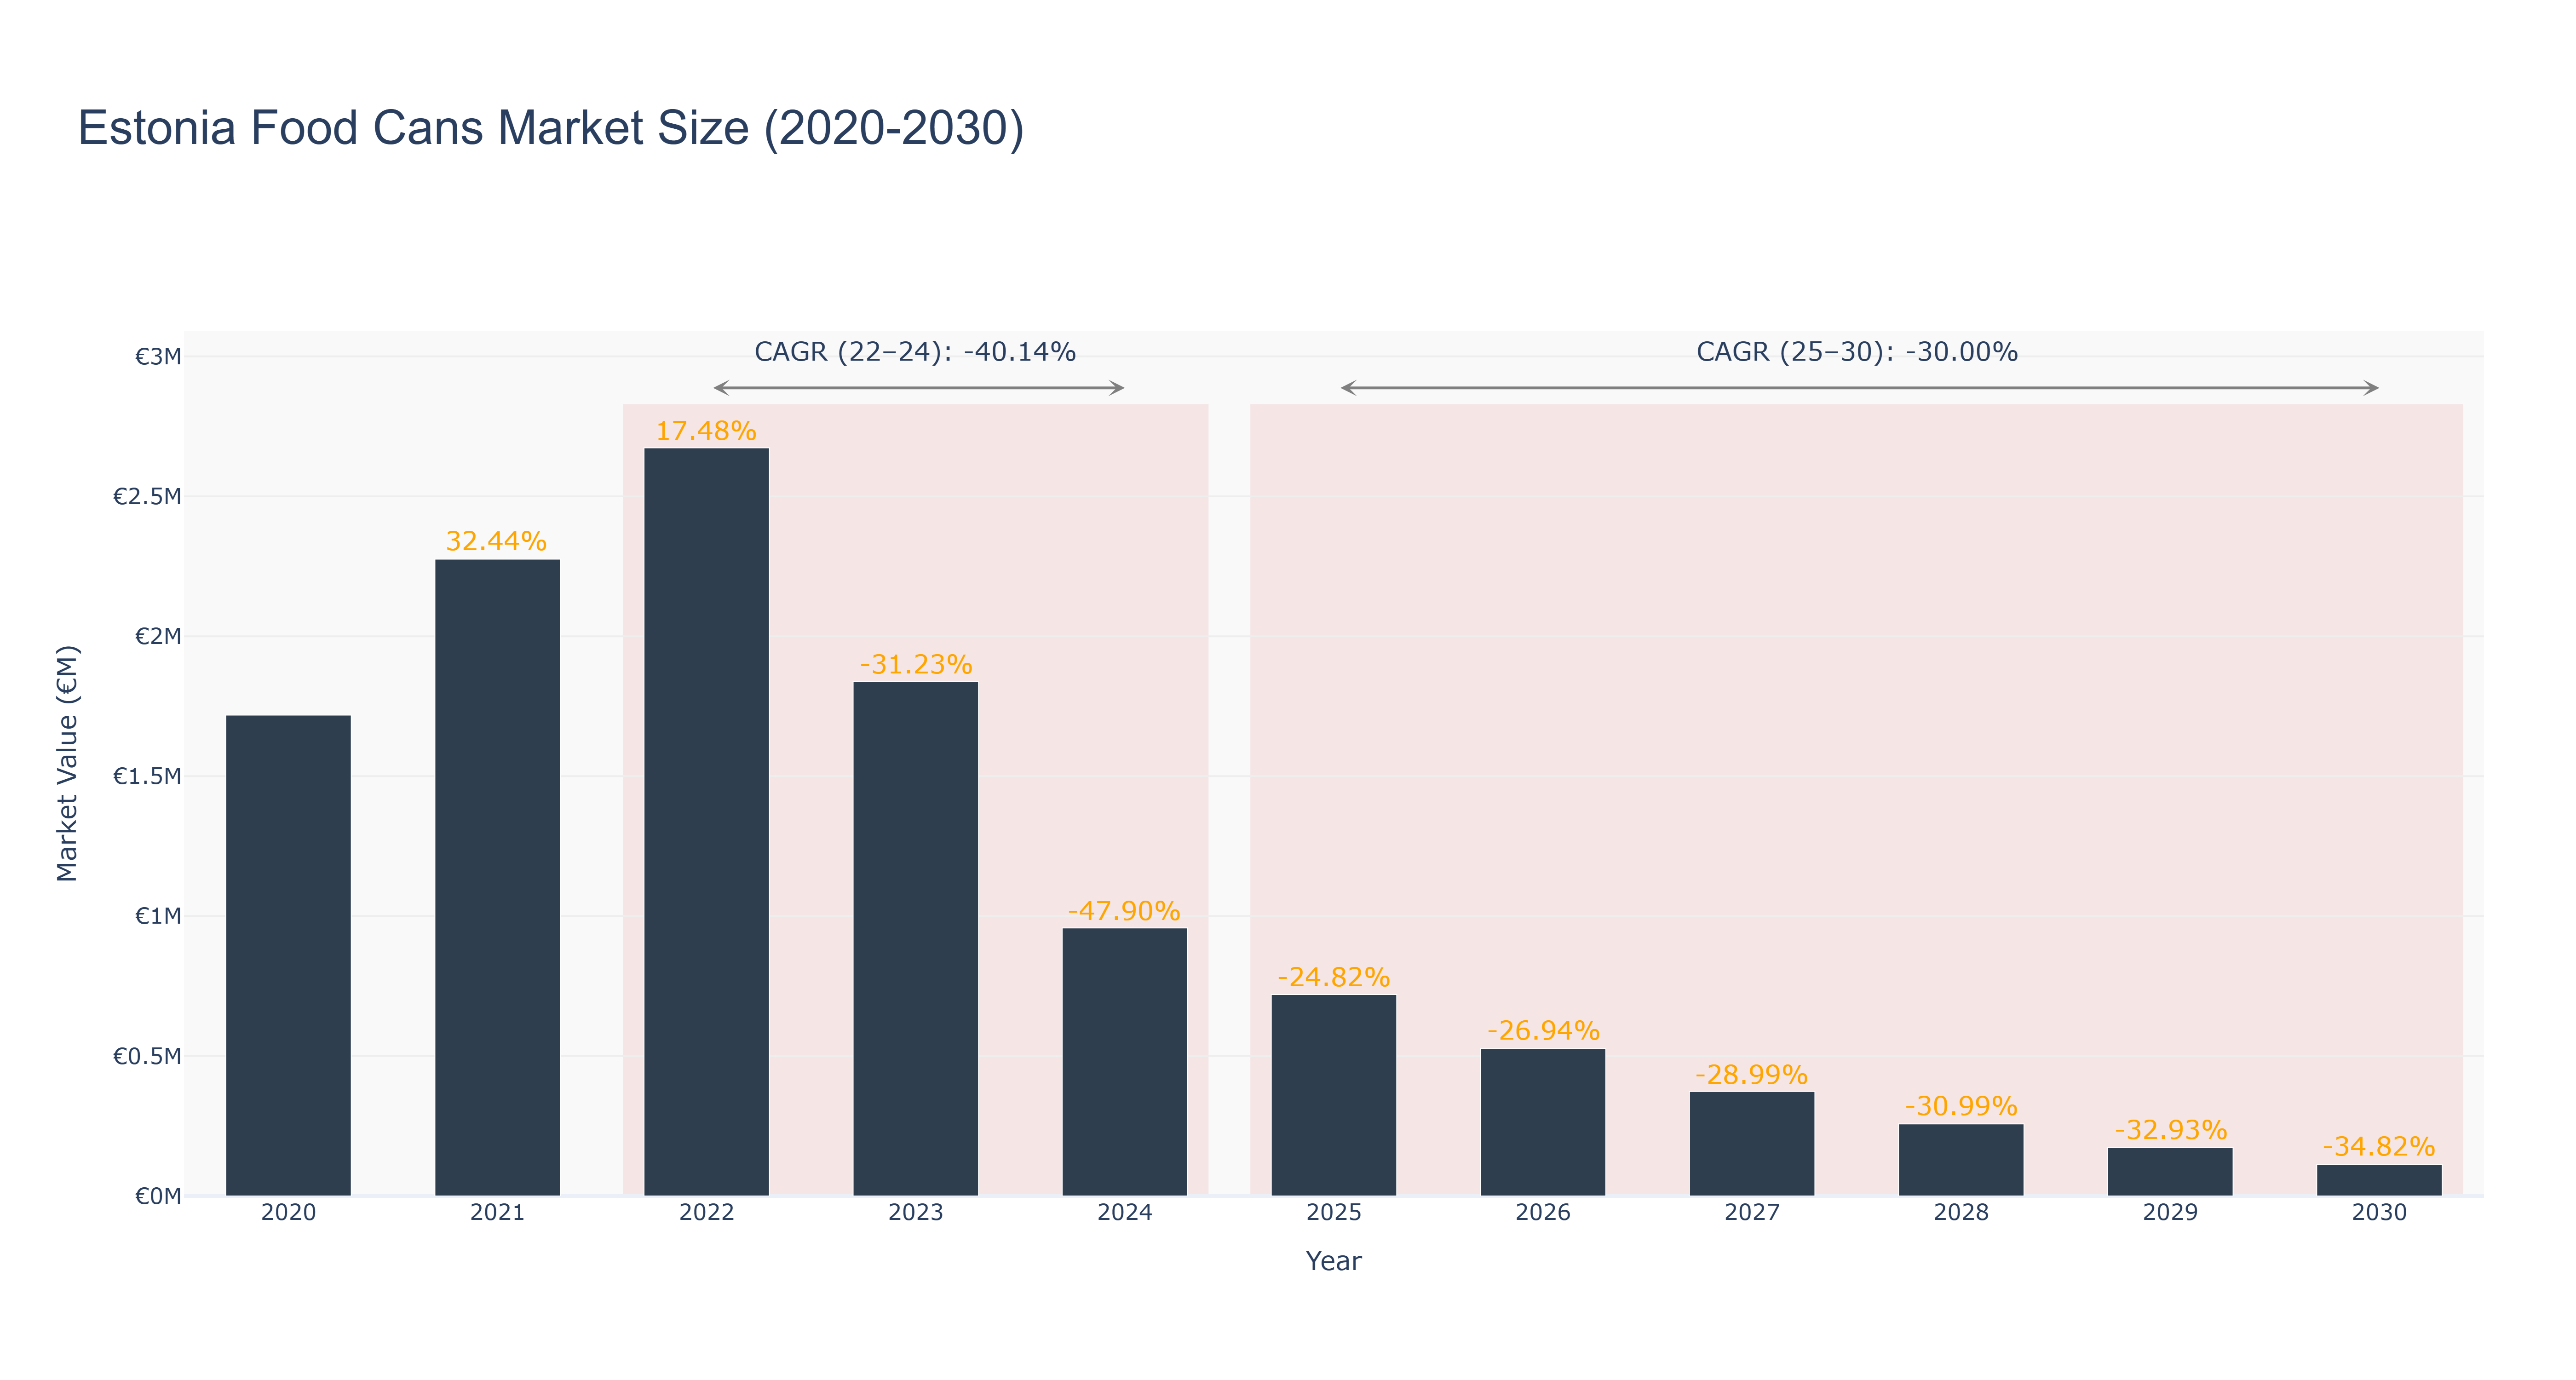
The Estonia Food Cans Market experienced a peak market size of €2.67 million in 2022, followed by a significant decline to €0.11 million in 2030. The actual market size decreased steadily from €2.67 million in 2022 to €0.96 million in 2024, mainly due to changing consumer preferences and economic challenges. The forecasted market size is expected to continue declining, with a CAGR of -30.0% from 2025 to 2030. The market's downturn can be attributed to increased competition from alternative packaging solutions and a shift towards sustainable practices. To revitalize the market, upcoming initiatives in Estonia include collaborations with sustainable packaging companies to introduce eco-friendly food can options, aiming to attract environmentally-conscious consumers and drive market growth. Industry drivers such as evolving consumer demands and sustainability concerns will shape the future trajectory of the Estonia Food Cans Market.
Estonia Food Cans Market: Production & Trade Performance (2019-2025)
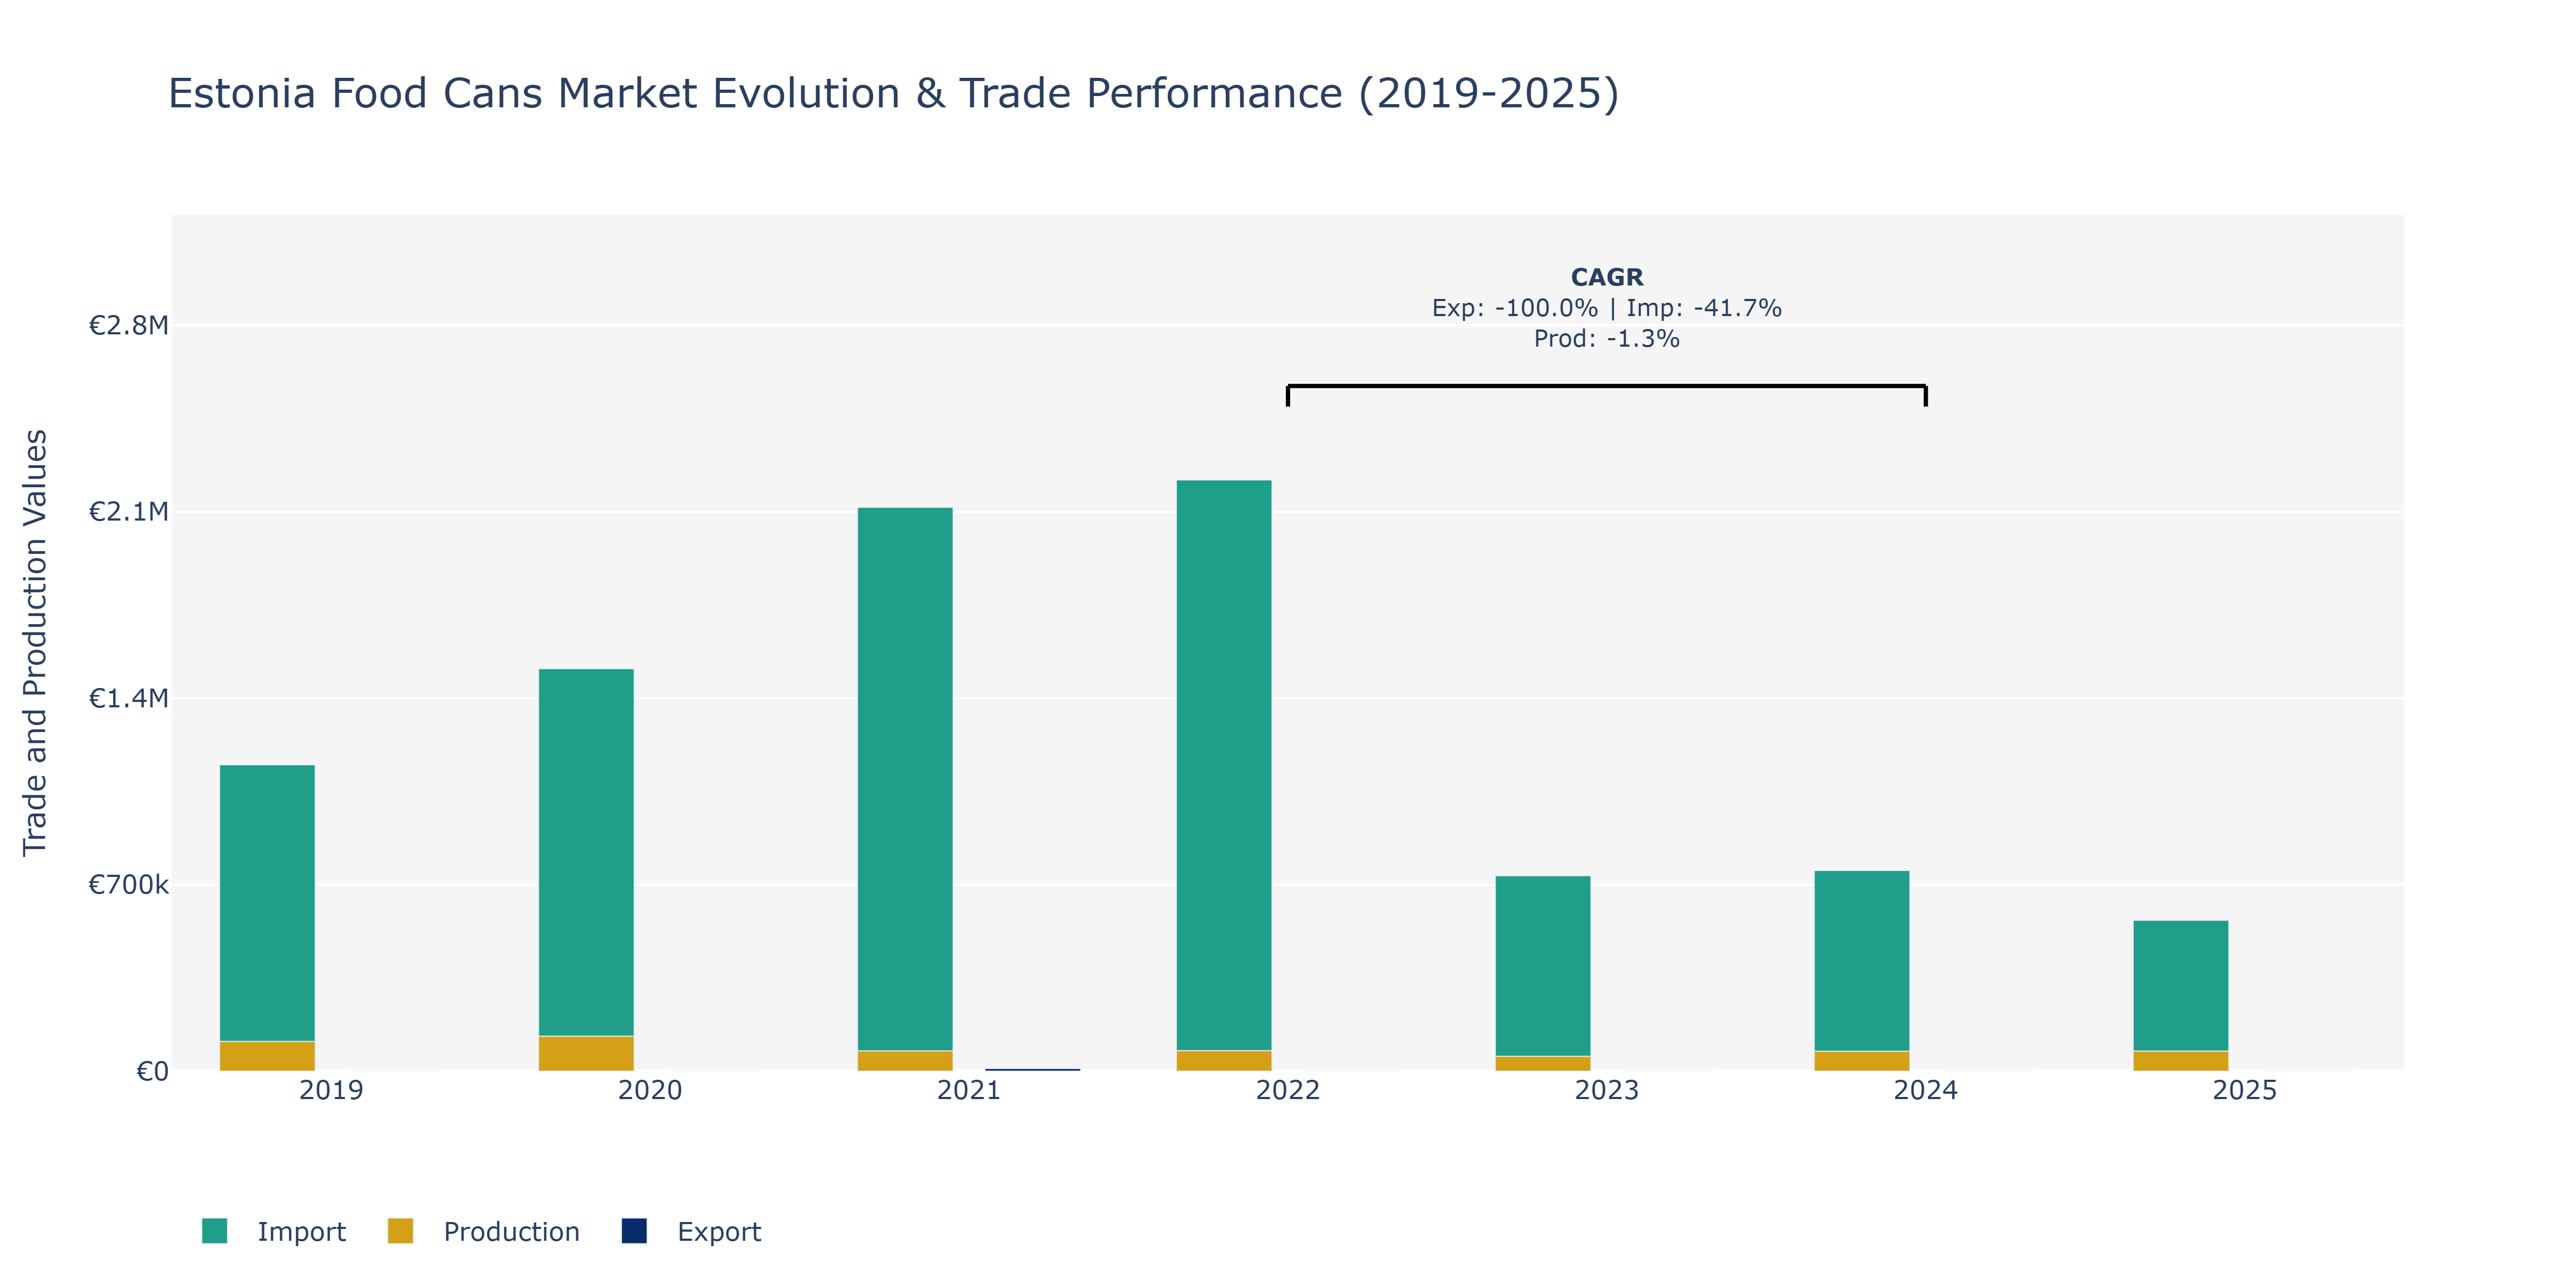
In the Estonia Food Cans Market, exports experienced a notable decline from €160 million in 2019 to €101.61 million in 2021 before a slight recovery to €187 million in 2022. This fluctuation may be attributed to external factors such as changes in global demand for canned food products or disruptions in international trade agreements impacting export volumes. Imports showed a fluctuating trend, peaking at €2.22 billion in 2022 after starting at €1.15 billion in 2019. Such fluctuations could be influenced by shifts in consumer preferences for imported canned goods or variations in raw material costs affecting the import market. Production levels varied, reaching €131.41 million in 2020 before declining to €56 million in 2023, and then recovering to €75 million in 2024. These fluctuations might be linked to changes in domestic production capacities, technological advancements in can manufacturing impacting production efficiency, or shifts in market demand for canned food products. The market players in Estonia's food cans industry could benefit from monitoring global trade dynamics, investing in sustainable production technologies, and adapting to evolving consumer preferences to navigate the market's fluctuations effectively.
Key Highlights of the Report:
- Estonia Food Cans Market Outlook
- Market Size of Estonia Food Cans Market, 2025
- Forecast of Estonia Food Cans Market, 2032
- Historical Data and Forecast of Estonia Food Cans Revenues & Volume for the Period 2022 - 2032
- Estonia Food Cans Market Trend Evolution
- Estonia Food Cans Market Drivers and Challenges
- Estonia Food Cans Price Trends
- Estonia Food Cans Porter's Five Forces
- Estonia Food Cans Industry Life Cycle
- Historical Data and Forecast of Estonia Food Cans Market Revenues & Volume By Product for the Period 2022 - 2032
- Historical Data and Forecast of Estonia Food Cans Market Revenues & Volume By 2 Piece Cans for the Period 2022 - 2032
- Historical Data and Forecast of Estonia Food Cans Market Revenues & Volume By 3 Piece Cans for the Period 2022 - 2032
- Historical Data and Forecast of Estonia Food Cans Market Revenues & Volume By Material for the Period 2022 - 2032
- Historical Data and Forecast of Estonia Food Cans Market Revenues & Volume By Metal for the Period 2022 - 2032
- Historical Data and Forecast of Estonia Food Cans Market Revenues & Volume By Paperboard for the Period 2022 - 2032
- Historical Data and Forecast of Estonia Food Cans Market Revenues & Volume By Plastic for the Period 2022 - 2032
- Historical Data and Forecast of Estonia Food Cans Market Revenues & Volume By Capacity for the Period 2022 - 2032
- Historical Data and Forecast of Estonia Food Cans Market Revenues & Volume By Less than 100 gm for the Period 2022 - 2032
- Historical Data and Forecast of Estonia Food Cans Market Revenues & Volume By 100 gm300 gm for the Period 2022 - 2032
- Historical Data and Forecast of Estonia Food Cans Market Revenues & Volume By 301 gm500 gm for the Period 2022 - 2032
- Historical Data and Forecast of Estonia Food Cans Market Revenues & Volume By More than 500 gm for the Period 2022 - 2032
- Historical Data and Forecast of Estonia Food Cans Market Revenues & Volume By End-use for the Period 2022 - 2032
- Historical Data and Forecast of Estonia Food Cans Market Revenues & Volume By Meat and Poultry & Seafood for the Period 2022 - 2032
- Historical Data and Forecast of Estonia Food Cans Market Revenues & Volume By Pet Food for the Period 2022 - 2032
- Historical Data and Forecast of Estonia Food Cans Market Revenues & Volume By Bakery & Confectionery for the Period 2022 - 2032
- Historical Data and Forecast of Estonia Food Cans Market Revenues & Volume By Sauces and Jams & Pickles for the Period 2022 - 2032
- Historical Data and Forecast of Estonia Food Cans Market Revenues & Volume By Fruits & Vegetables for the Period 2022 - 2032
- Historical Data and Forecast of Estonia Food Cans Market Revenues & Volume By Tea & Coffee for the Period 2022 - 2032
- Historical Data and Forecast of Estonia Food Cans Market Revenues & Volume By Others (Baby Food, Ready Meals, Nutrition Food, Dairy, etc.) for the Period 2022 - 2032
- Estonia Food Cans Import Export Trade Statistics
- Market Opportunity Assessment By Product
- Market Opportunity Assessment By Material
- Market Opportunity Assessment By Capacity
- Market Opportunity Assessment By End-use
- Estonia Food Cans Top Companies Market Share
- Estonia Food Cans Competitive Benchmarking By Technical and Operational Parameters
- Estonia Food Cans Company Profiles
- Estonia Food Cans Key Strategic Recommendations
Frequently Asked Questions About the Market Study (FAQs):
6Wresearch actively monitors the Estonia Food Cans Market and publishes its comprehensive annual report, highlighting emerging trends, growth drivers, revenue analysis, and forecast outlook. Our insights help businesses to make data-backed strategic decisions with ongoing market dynamics. Our analysts track relevent industries related to the Estonia Food Cans Market, allowing our clients with actionable intelligence and reliable forecasts tailored to emerging regional needs.
Yes, we provide customisation as per your requirements. To learn more, feel free to contact us on sales@6wresearch.com
1 Executive Summary |
2 Introduction |
2.1 Key Highlights of the Report |
2.2 Report Description |
2.3 Market Scope & Segmentation |
2.4 Research Methodology |
2.5 Assumptions |
3 Estonia Food Cans Market Overview |
3.1 Estonia Country Macro Economic Indicators |
3.2 Estonia Food Cans Market Revenues & Volume, 2022 & 2032F |
3.3 Estonia Food Cans Market - Industry Life Cycle |
3.4 Estonia Food Cans Market - Porter's Five Forces |
3.5 Estonia Food Cans Market Revenues & Volume Share, By Product, 2022 & 2032F |
3.6 Estonia Food Cans Market Revenues & Volume Share, By Material, 2022 & 2032F |
3.7 Estonia Food Cans Market Revenues & Volume Share, By Capacity, 2022 & 2032F |
3.8 Estonia Food Cans Market Revenues & Volume Share, By End-use, 2022 & 2032F |
4 Estonia Food Cans Market Dynamics |
4.1 Impact Analysis |
4.2 Market Drivers |
4.3 Market Restraints |
5 Estonia Food Cans Market Trends |
6 Estonia Food Cans Market, By Types |
6.1 Estonia Food Cans Market, By Product |
6.1.1 Overview and Analysis |
6.1.2 Estonia Food Cans Market Revenues & Volume, By Product, 2022 - 2032F |
6.1.3 Estonia Food Cans Market Revenues & Volume, By 2 Piece Cans, 2022 - 2032F |
6.1.4 Estonia Food Cans Market Revenues & Volume, By 3 Piece Cans, 2022 - 2032F |
6.2 Estonia Food Cans Market, By Material |
6.2.1 Overview and Analysis |
6.2.2 Estonia Food Cans Market Revenues & Volume, By Metal, 2022 - 2032F |
6.2.3 Estonia Food Cans Market Revenues & Volume, By Paperboard, 2022 - 2032F |
6.2.4 Estonia Food Cans Market Revenues & Volume, By Plastic, 2022 - 2032F |
6.3 Estonia Food Cans Market, By Capacity |
6.3.1 Overview and Analysis |
6.3.2 Estonia Food Cans Market Revenues & Volume, By Less than 100 gm, 2022 - 2032F |
6.3.3 Estonia Food Cans Market Revenues & Volume, By 100 gm300 gm, 2022 - 2032F |
6.3.4 Estonia Food Cans Market Revenues & Volume, By 301 gm500 gm, 2022 - 2032F |
6.3.5 Estonia Food Cans Market Revenues & Volume, By More than 500 gm, 2022 - 2032F |
6.4 Estonia Food Cans Market, By End-use |
6.4.1 Overview and Analysis |
6.4.2 Estonia Food Cans Market Revenues & Volume, By Meat and Poultry & Seafood, 2022 - 2032F |
6.4.3 Estonia Food Cans Market Revenues & Volume, By Pet Food, 2022 - 2032F |
6.4.4 Estonia Food Cans Market Revenues & Volume, By Bakery & Confectionery, 2022 - 2032F |
6.4.5 Estonia Food Cans Market Revenues & Volume, By Sauces and Jams & Pickles, 2022 - 2032F |
6.4.6 Estonia Food Cans Market Revenues & Volume, By Fruits & Vegetables, 2022 - 2032F |
6.4.7 Estonia Food Cans Market Revenues & Volume, By Tea & Coffee, 2022 - 2032F |
7 Estonia Food Cans Market Import-Export Trade Statistics |
7.1 Estonia Food Cans Market Export to Major Countries |
7.2 Estonia Food Cans Market Imports from Major Countries |
8 Estonia Food Cans Market Key Performance Indicators |
9 Estonia Food Cans Market - Opportunity Assessment |
9.1 Estonia Food Cans Market Opportunity Assessment, By Product, 2022 & 2032F |
9.2 Estonia Food Cans Market Opportunity Assessment, By Material, 2022 & 2032F |
9.3 Estonia Food Cans Market Opportunity Assessment, By Capacity, 2022 & 2032F |
9.4 Estonia Food Cans Market Opportunity Assessment, By End-use, 2022 & 2032F |
10 Estonia Food Cans Market - Competitive Landscape |
10.1 Estonia Food Cans Market Revenue Share, By Companies, 2025 |
10.2 Estonia Food Cans Market Competitive Benchmarking, By Operating and Technical Parameters |
11 Company Profiles |
12 Recommendations |
13 Disclaimer |
Export potential assessment - trade Analytics for 2030
Export potential enables firms to identify high-growth global markets with greater confidence by combining advanced trade intelligence with a structured quantitative methodology. The framework analyzes emerging demand trends and country-level import patterns while integrating macroeconomic and trade datasets such as GDP and population forecasts, bilateral import–export flows, tariff structures, elasticity differentials between developed and developing economies, geographic distance, and import demand projections. Using weighted trade values from 2020–2024 as the base period to project country-to-country export potential for 2030, these inputs are operationalized through calculated drivers such as gravity model parameters, tariff impact factors, and projected GDP per-capita growth. Through an analysis of hidden potentials, demand hotspots, and market conditions that are most favorable to success, this method enables firms to focus on target countries, maximize returns, and global expansion with data, backed by accuracy.
By factoring in the projected importer demand gap that is currently unmet and could be potential opportunity, it identifies the potential for the Exporter (Country) among 190 countries, against the general trade analysis, which identifies the biggest importer or exporter.
To discover high-growth global markets and optimize your business strategy:
Click Here
Pricing
- Single User License$ 1,995
- Department License$ 2,400
- Site License$ 3,120
- Global License$ 3,795

Search
Thought Leadership and Analyst Meet


Our Clients
Latest Reports
- Philippines Polyhydroxybutyrate-co-Hydroxyvalerate Market (2026-2032) | Trends, Insights, Challenges, Restraints, Competition, Size, Value, Forecast, Pricing, Share, Outlook, Revenue, Investment Opportunities, Strategy, Drivers, Demand, Growth, segmentation, Analysis, Companies
- Peru Polyhydroxybutyrate-co-Hydroxyvalerate Market (2026-2032) | Growth, Demand, Challenges, Share, Trends, Analysis, Pricing, Investment Opportunities, Drivers, Value, Forecast, Competition, Size, Companies, Insights, Outlook, Restraints, segmentation, Revenue, Strategy
- Pakistan Polyhydroxybutyrate-co-Hydroxyvalerate Market (2026-2032) | Restraints, segmentation, Pricing, Forecast, Share, Strategy, Competition, Trends, Insights, Drivers, Challenges, Growth, Revenue, Outlook, Value, Investment Opportunities, Companies, Size, Analysis, Demand
- Oman Polyhydroxybutyrate-co-Hydroxyvalerate Market (2026-2032) | Drivers, segmentation, Insights, Competition, Pricing, Outlook, Size, Revenue, Challenges, Forecast, Analysis, Growth, Value, Share, Trends, Investment Opportunities, Strategy, Restraints, Companies, Demand
- Nigeria Polyhydroxybutyrate-co-Hydroxyvalerate Market (2026-2032) | Value, Investment Opportunities, Analysis, Revenue, Restraints, Pricing, Outlook, Competition, Demand, Growth, Forecast, Companies, Trends, Challenges, segmentation, Drivers, Insights, Share, Size, Strategy
- Nepal Polyhydroxybutyrate-co-Hydroxyvalerate Market (2026-2032) | Insights, Analysis, Drivers, Share, Revenue, Demand, segmentation, Investment Opportunities, Competition, Forecast, Growth, Pricing, Companies, Strategy, Trends, Restraints, Challenges, Outlook, Size, Value
- Myanmar Polyhydroxybutyrate-co-Hydroxyvalerate Market (2026-2032) | Outlook, Revenue, Strategy, Restraints, Drivers, segmentation, Share, Forecast, Competition, Insights, Growth, Pricing, Size, Demand, Value, Companies, Trends, Challenges, Investment Opportunities, Analysis
- Morocco Polyhydroxybutyrate-co-Hydroxyvalerate Market (2026-2032) | Outlook, Investment Opportunities, Restraints, Strategy, Forecast, Challenges, Drivers, Growth, Companies, segmentation, Trends, Size, Competition, Revenue, Demand, Insights, Share, Analysis, Value, Pricing
- Mexico Polyhydroxybutyrate-co-Hydroxyvalerate Market (2026-2032) | Size, Drivers, Outlook, Share, Strategy, Growth, Pricing, Challenges, Companies, Demand, Value, Investment Opportunities, Restraints, Trends, Forecast, segmentation, Analysis, Insights, Competition, Revenue
- Malaysia Polyhydroxybutyrate-co-Hydroxyvalerate Market (2026-2032) | Share, segmentation, Size, Companies, Analysis, Insights, Forecast, Value, Revenue, Drivers, Restraints, Challenges, Investment Opportunities, Trends, Competition, Strategy, Demand, Growth, Outlook, Pricing
Industry Events and Analyst Meet

HIMTEX 2026

India Refining Summit 2026

India EV Show 2026

EV tech India Expo 2026

Auto Tech Asia 2026
Whitepaper
- Middle East & Africa Commercial Security Market Click here to view more.
- Middle East & Africa Fire Safety Systems & Equipment Market Click here to view more.
- GCC Drone Market Click here to view more.
- Middle East Lighting Fixture Market Click here to view more.
- GCC Physical & Perimeter Security Market Click here to view more.
6WResearch In News
- Doha a strategic location for EV manufacturing hub: IPA Qatar
- Demand for luxury TVs surging in the GCC, says Samsung
- Empowering Growth: The Thriving Journey of Bangladesh’s Cable Industry
- Demand for luxury TVs surging in the GCC, says Samsung
- Video call with a traditional healer? Once unthinkable, it’s now common in South Africa
- Intelligent Buildings To Smooth GCC’s Path To Net Zero