Estonia Fructose Market (2026-2032) | Companies, Segmentation, Trends, Share, Outlook, Growth, Revenue, Industry, Forecast, Value, Analysis & Size
Market Forecast By Product (High Fructose Corn Syrup, Fructose Syrups, Fructose Solids), By Application (Beverages, Processed Foods, Dairy Products, Confectionary, Bakery & Cereals, Others) And Competitive Landscape
| Product Code: ETC4733369 | Publication Date: Nov 2023 | Updated Date: Apr 2026 | Product Type: Market Research Report | |
| Publisher: 6Wresearch | Author: Shubham Padhi | No. of Pages: 60 | No. of Figures: 30 | No. of Tables: 5 |
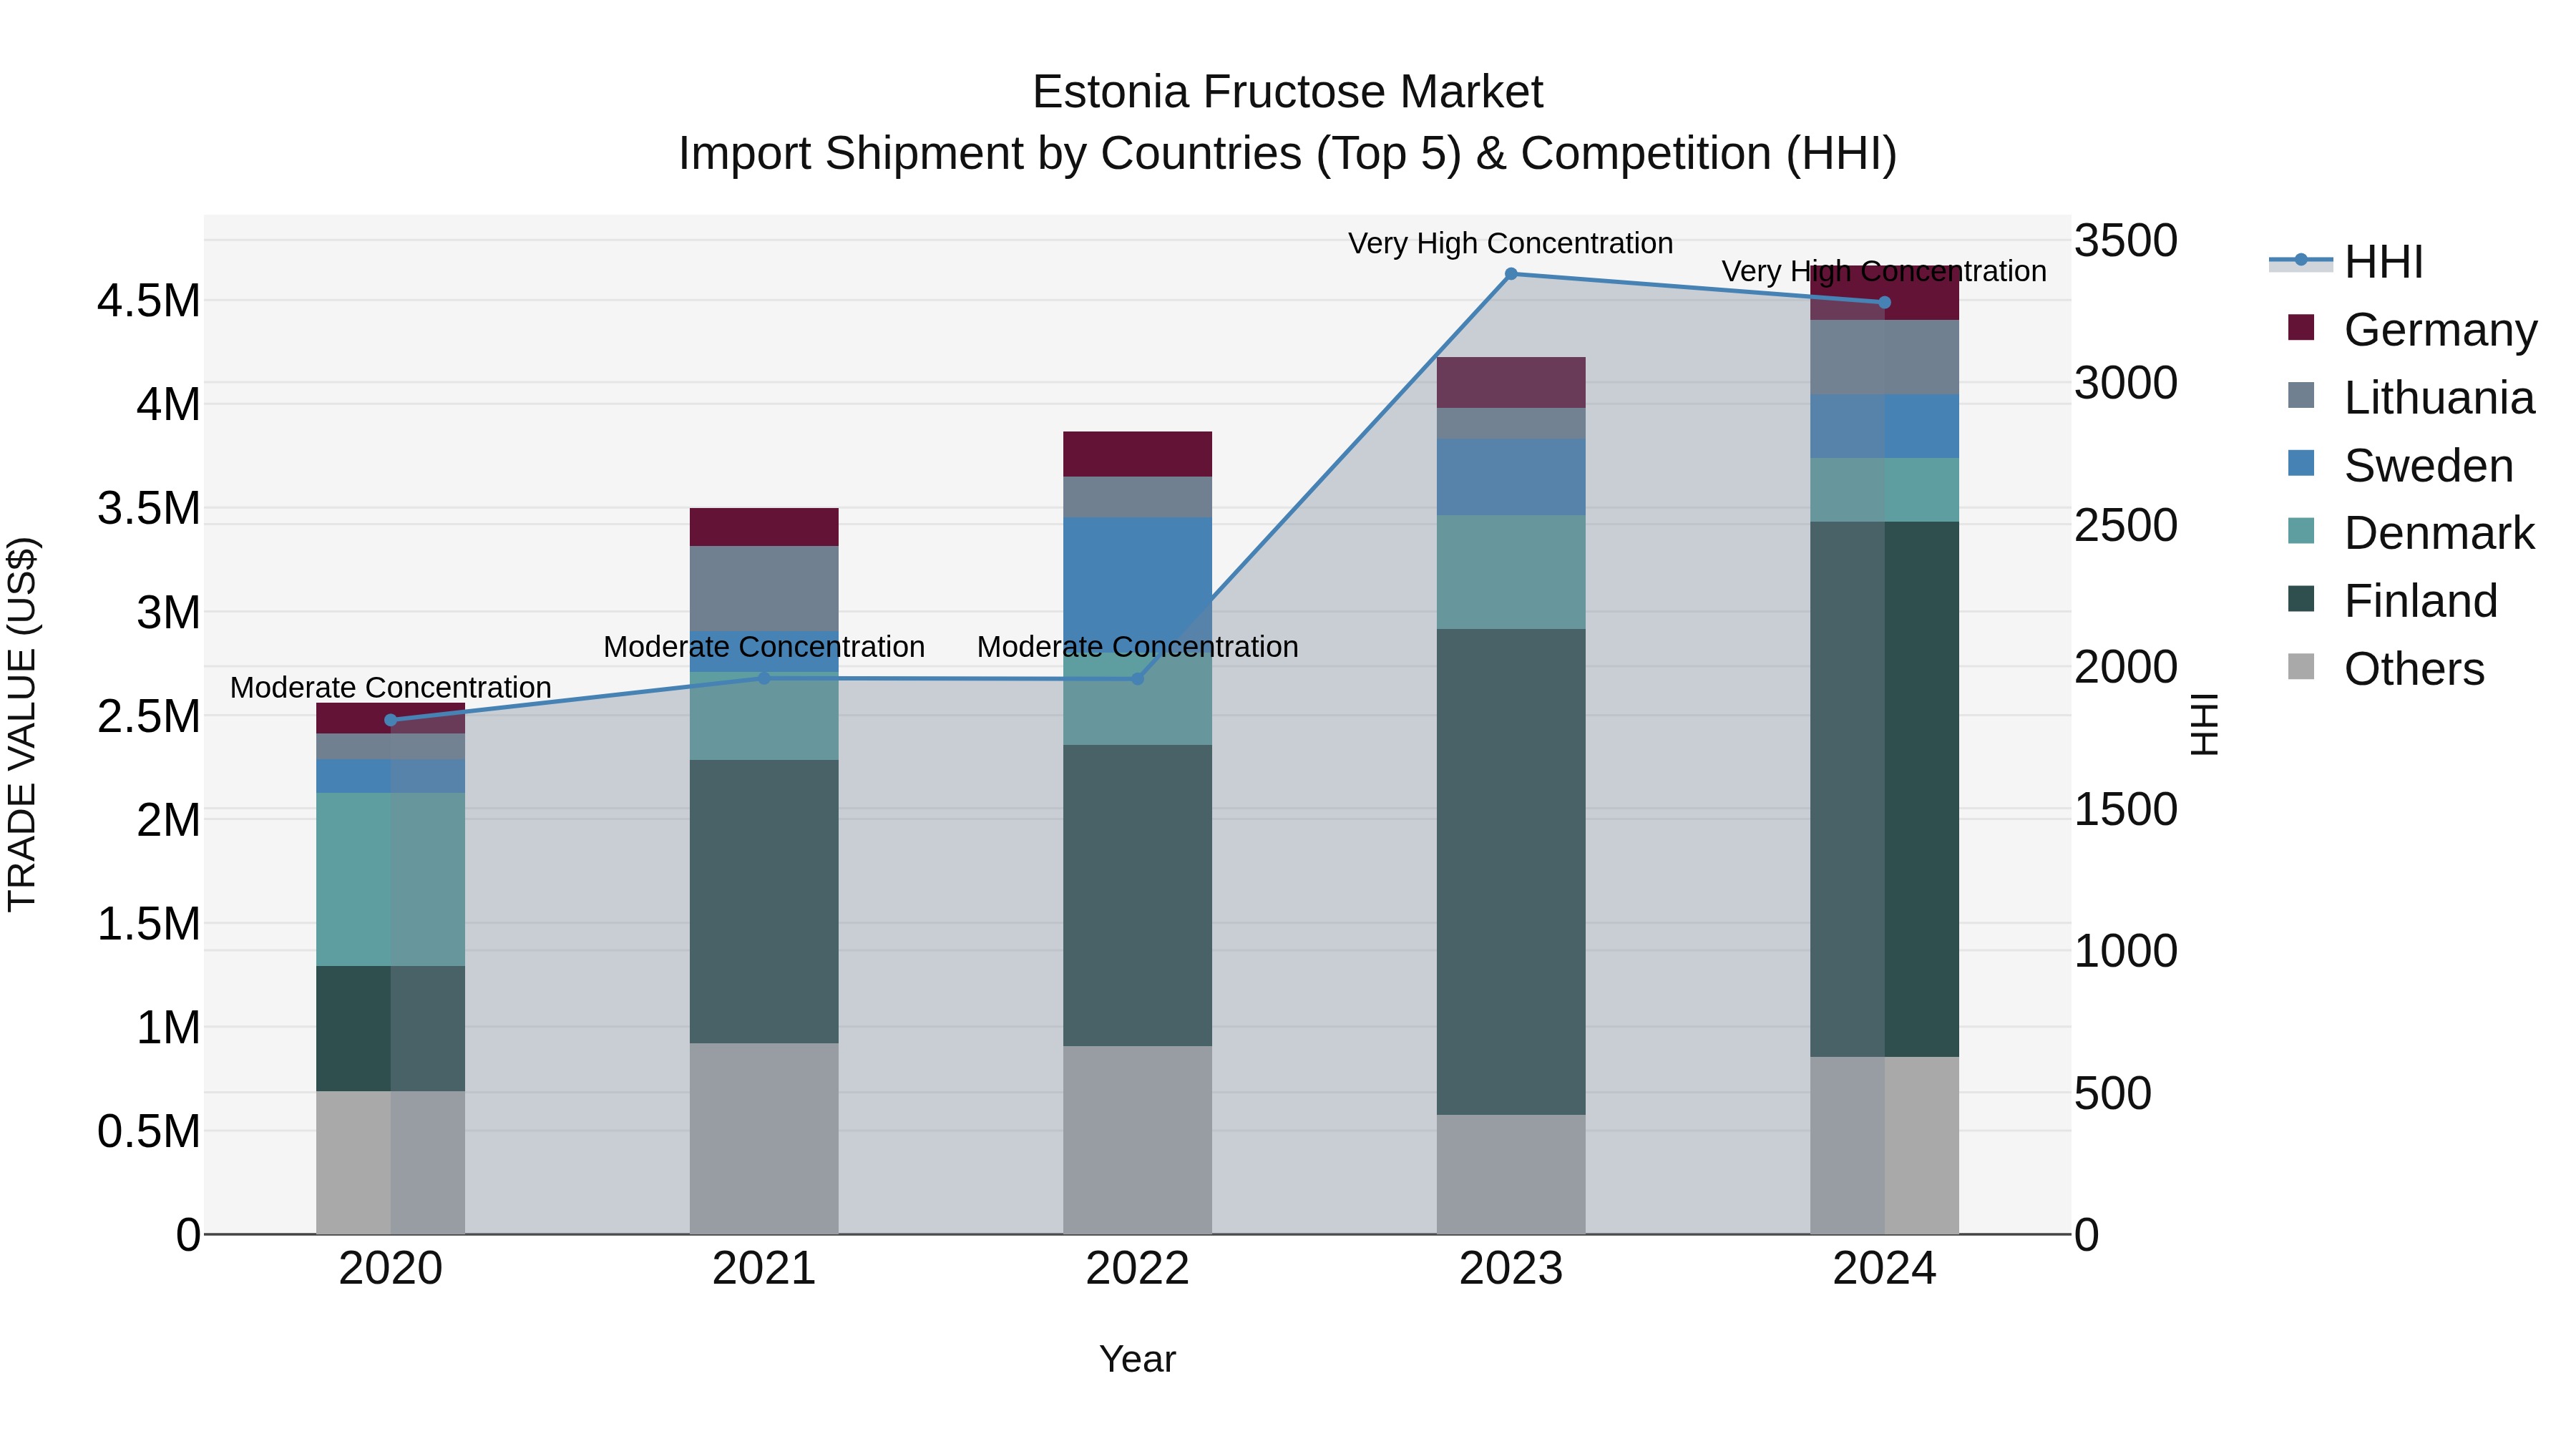
Estonia Fructose Market Top 5 Importing Countries and Market Competition (HHI) Analysis
Estonia`s fructose import market continued to show strong growth in 2024, with top suppliers including Finland, Lithuania, Denmark, Sweden, and Germany. The high concentration levels, as indicated by the Herfindahl-Hirschman Index (HHI), suggest a competitive market dominated by these key players. The compound annual growth rate (CAGR) from 2020 to 2024 was impressive at 16.17%, reflecting sustained demand. Furthermore, the growth rate in 2024 alone reached 10.46%, highlighting the momentum in the Estonian fructose import market and the importance of these key exporting countries.
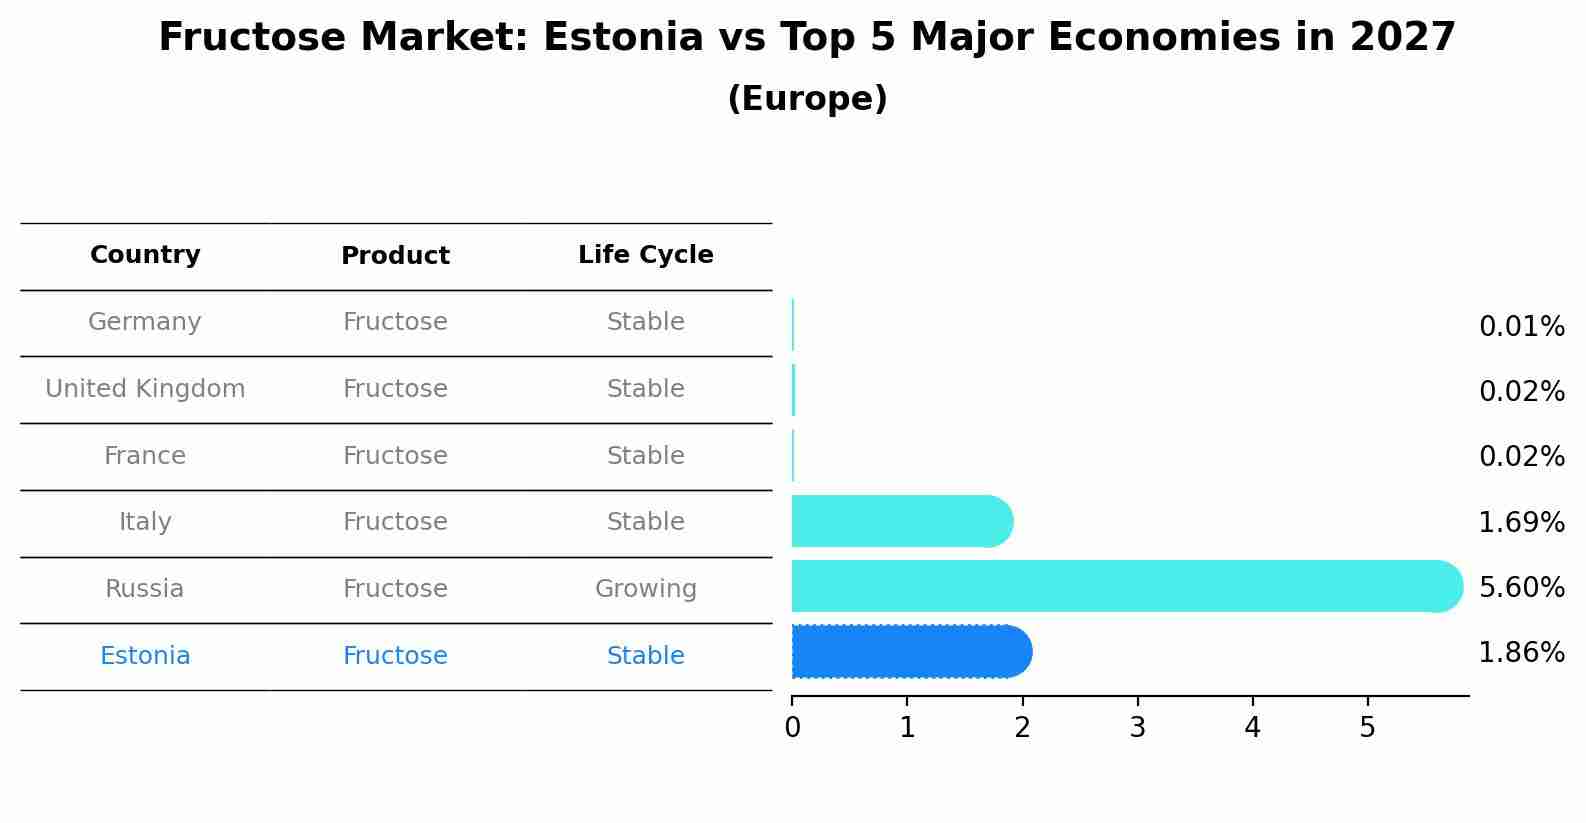
Fructose Market: Estonia vs Top 5 Major Economies in 2027 (Europe)
The Fructose market in Estonia is projected to grow at a stable growth rate of 1.86% by 2027, highlighting the country's increasing focus on advanced technologies within the Europe region, where Germany holds the dominant position, followed closely by United Kingdom, France, Italy and Russia, shaping overall regional demand.
Key Highlights of the Report:
- Estonia Fructose Market Outlook
- Market Size of Estonia Fructose Market, 2025
- Forecast of Estonia Fructose Market, 2032
- Historical Data and Forecast of Estonia Fructose Revenues & Volume for the Period 2022 - 2032F
- Estonia Fructose Market Trend Evolution
- Estonia Fructose Market Drivers and Challenges
- Estonia Fructose Price Trends
- Estonia Fructose Porter`s Five Forces
- Estonia Fructose Industry Life Cycle
- Historical Data and Forecast of Estonia Fructose Market Revenues & Volume By Product for the Period 2022 - 2032F
- Historical Data and Forecast of Estonia Fructose Market Revenues & Volume By High Fructose Corn Syrup for the Period 2022 - 2032F
- Historical Data and Forecast of Estonia Fructose Market Revenues & Volume By Fructose Syrups for the Period 2022 - 2032F
- Historical Data and Forecast of Estonia Fructose Market Revenues & Volume By Fructose Solids for the Period 2022 - 2032F
- Historical Data and Forecast of Estonia Fructose Market Revenues & Volume By Application for the Period 2022 - 2032F
- Historical Data and Forecast of Estonia Fructose Market Revenues & Volume By Beverages for the Period 2022 - 2032F
- Historical Data and Forecast of Estonia Fructose Market Revenues & Volume By Processed Foods for the Period 2022 - 2032F
- Historical Data and Forecast of Estonia Fructose Market Revenues & Volume By Dairy Products for the Period 2022 - 2032F
- Historical Data and Forecast of Estonia Fructose Market Revenues & Volume By Confectionary for the Period 2022 - 2032F
- Historical Data and Forecast of Estonia Fructose Market Revenues & Volume By Bakery & Cereals for the Period 2022 - 2032F
- Historical Data and Forecast of Estonia Fructose Market Revenues & Volume By Others for the Period 2022 - 2032F
- Estonia Fructose Import Export Trade Statistics
- Market Opportunity Assessment By Product
- Market Opportunity Assessment By Application
- Estonia Fructose Top Companies Market Share
- Estonia Fructose Competitive Benchmarking By Technical and Operational Parameters
- Estonia Fructose Company Profiles
- Estonia Fructose Key Strategic Recommendations
Frequently Asked Questions About the Market Study (FAQs):
6Wresearch actively monitors the Estonia Fructose Market and publishes its comprehensive annual report, highlighting emerging trends, growth drivers, revenue analysis, and forecast outlook. Our insights help businesses to make data-backed strategic decisions with ongoing market dynamics. Our analysts track relevent industries related to the Estonia Fructose Market, allowing our clients with actionable intelligence and reliable forecasts tailored to emerging regional needs.
Yes, we provide customisation as per your requirements. To learn more, feel free to contact us on sales@6wresearch.com
1 Executive Summary |
2 Introduction |
2.1 Key Highlights of the Report |
2.2 Report Description |
2.3 Market Scope & Segmentation |
2.4 Research Methodology |
2.5 Assumptions |
3 Estonia Fructose Market Overview |
3.1 Estonia Country Macro Economic Indicators |
3.2 Estonia Fructose Market Revenues & Volume, 2022 & 2032F |
3.3 Estonia Fructose Market - Industry Life Cycle |
3.4 Estonia Fructose Market - Porter's Five Forces |
3.5 Estonia Fructose Market Revenues & Volume Share, By Product, 2022 & 2032F |
3.6 Estonia Fructose Market Revenues & Volume Share, By Application, 2022 & 2032F |
4 Estonia Fructose Market Dynamics |
4.1 Impact Analysis |
4.2 Market Drivers |
4.3 Market Restraints |
5 Estonia Fructose Market Trends |
6 Estonia Fructose Market Segmentations |
6.1 Estonia Fructose Market, By Product |
6.1.1 Overview and Analysis |
6.1.2 Estonia Fructose Market Revenues & Volume, By High Fructose Corn Syrup, 2022 - 2032F |
6.1.3 Estonia Fructose Market Revenues & Volume, By Fructose Syrups, 2022 - 2032F |
6.1.4 Estonia Fructose Market Revenues & Volume, By Fructose Solids, 2022 - 2032F |
6.2 Estonia Fructose Market, By Application |
6.2.1 Overview and Analysis |
6.2.2 Estonia Fructose Market Revenues & Volume, By Beverages, 2022 - 2032F |
6.2.3 Estonia Fructose Market Revenues & Volume, By Processed Foods, 2022 - 2032F |
6.2.4 Estonia Fructose Market Revenues & Volume, By Dairy Products, 2022 - 2032F |
6.2.5 Estonia Fructose Market Revenues & Volume, By Confectionary, 2022 - 2032F |
6.2.6 Estonia Fructose Market Revenues & Volume, By Bakery & Cereals, 2022 - 2032F |
6.2.7 Estonia Fructose Market Revenues & Volume, By Others, 2022 - 2032F |
7 Estonia Fructose Market Import-Export Trade Statistics |
7.1 Estonia Fructose Market Export to Major Countries |
7.2 Estonia Fructose Market Imports from Major Countries |
8 Estonia Fructose Market Key Performance Indicators |
9 Estonia Fructose Market - Opportunity Assessment |
9.1 Estonia Fructose Market Opportunity Assessment, By Product, 2022 & 2032F |
9.2 Estonia Fructose Market Opportunity Assessment, By Application, 2022 & 2032F |
10 Estonia Fructose Market - Competitive Landscape |
10.1 Estonia Fructose Market Revenue Share, By Companies, 2025 |
10.2 Estonia Fructose Market Competitive Benchmarking, By Operating and Technical Parameters |
11 Company Profiles |
12 Recommendations | 13 Disclaimer |
Global Go To Market Strategy - 2030
Export potential enables firms to identify high-growth global markets with greater confidence by combining advanced trade intelligence with a structured quantitative methodology. The framework analyzes emerging demand trends and country-level import patterns while integrating macroeconomic and trade datasets such as GDP and population forecasts, bilateral import–export flows, tariff structures, elasticity differentials between developed and developing economies, geographic distance, and import demand projections. Using weighted trade values from 2020–2024 as the base period to project country-to-country export potential for 2030, these inputs are operationalized through calculated drivers such as gravity model parameters, tariff impact factors, and projected GDP per-capita growth. Through an analysis of hidden potentials, demand hotspots, and market conditions that are most favorable to success, this method enables firms to focus on target countries, maximize returns, and global expansion with data, backed by accuracy.
By factoring in the projected importer demand gap that is currently unmet and could be potential opportunity, it identifies the potential for the Exporter (Country) among 190 countries, against the general trade analysis, which identifies the biggest importer or exporter.
To discover high-growth global markets and optimize your business strategy:
Click Here
Pricing
- Single User License$ 1,995
- Department License$ 2,400
- Site License$ 3,120
- Global License$ 3,795

Leadership Perspectives from Industry Events
Search
Thought Leadership and Analyst Meet


Our Clients
6WResearch In News
- Doha a strategic location for EV manufacturing hub: IPA Qatar
- Demand for luxury TVs surging in the GCC, says Samsung
- Empowering Growth: The Thriving Journey of Bangladesh’s Cable Industry
- Demand for luxury TVs surging in the GCC, says Samsung
- Video call with a traditional healer? Once unthinkable, it’s now common in South Africa
- Intelligent Buildings To Smooth GCC’s Path To Net Zero
Latest Reports
- Taiwan Airport Wireless Infrastructure Market (2026-2032)
- Vietnam Airport Wireless Infrastructure Market (2026-2032)
- Thailand Airport Wireless Infrastructure Market (2026-2032)
- South Korea Airport Wireless Infrastructure Market (2026-2032)
- Romania Airport Wireless Infrastructure Market (2026-2032)
- Qatar Airport Wireless Infrastructure Market (2026-2032)
- Philippines Airport Wireless Infrastructure Market (2026-2032)
- Japan Airport Wireless Infrastructure Market (2026-2032)
- Taiwan Airport Winter Services Market (2026-2032)
- Vietnam Airport Winter Services Market (2026-2032)
Industry Events and Analyst Meet

HIMTEX 2026

India Refining Summit 2026

India EV Show 2026

EV tech India Expo 2026

Auto Tech Asia 2026
Whitepaper
- Middle East & Africa Commercial Security Market Click here to view more.
- Middle East & Africa Fire Safety Systems & Equipment Market Click here to view more.
- GCC Drone Market Click here to view more.
- Middle East Lighting Fixture Market Click here to view more.
- GCC Physical & Perimeter Security Market Click here to view more.