Estonia In-Line Process Viscometer Market (2026-2032) | Forecast, Outlook, Companies, Drivers, Revenue, Growth, Segments, Demand, Strategic Insights, Competition, Supply, Opportunities, Industry, Analysis, Value, Share, Challenges, Investment Trends, Size, Strategy, Competitive, Consumer Insights, Restraints, Pricing Analysis, Trends, Segmentation
Market Forecast By Technology Type (Rotational, Torsional Oscillation, Vibration, Moving Piston), By Application (Industrial, Pharmaceutical, Food Processing, Chemical), By End User (Manufacturing Plants, Pharmaceutical Companies, Food and Beverage Manufacturers, Chemical Industries), By Product Type (Rotational Viscometers, Torsional Oscillation Viscometers, Vibration Viscometers, Moving Piston Viscometers) And Competitive Landscape
| Product Code: ETC12537951 | Publication Date: Apr 2025 | Updated Date: Apr 2026 | Product Type: Market Research Report | |
| Publisher: 6Wresearch | Author: Sachin Kumar Rai | No. of Pages: 65 | No. of Figures: 34 | No. of Tables: 19 |
Estonia In-Line Process Viscometer Market Size (2020-2030)
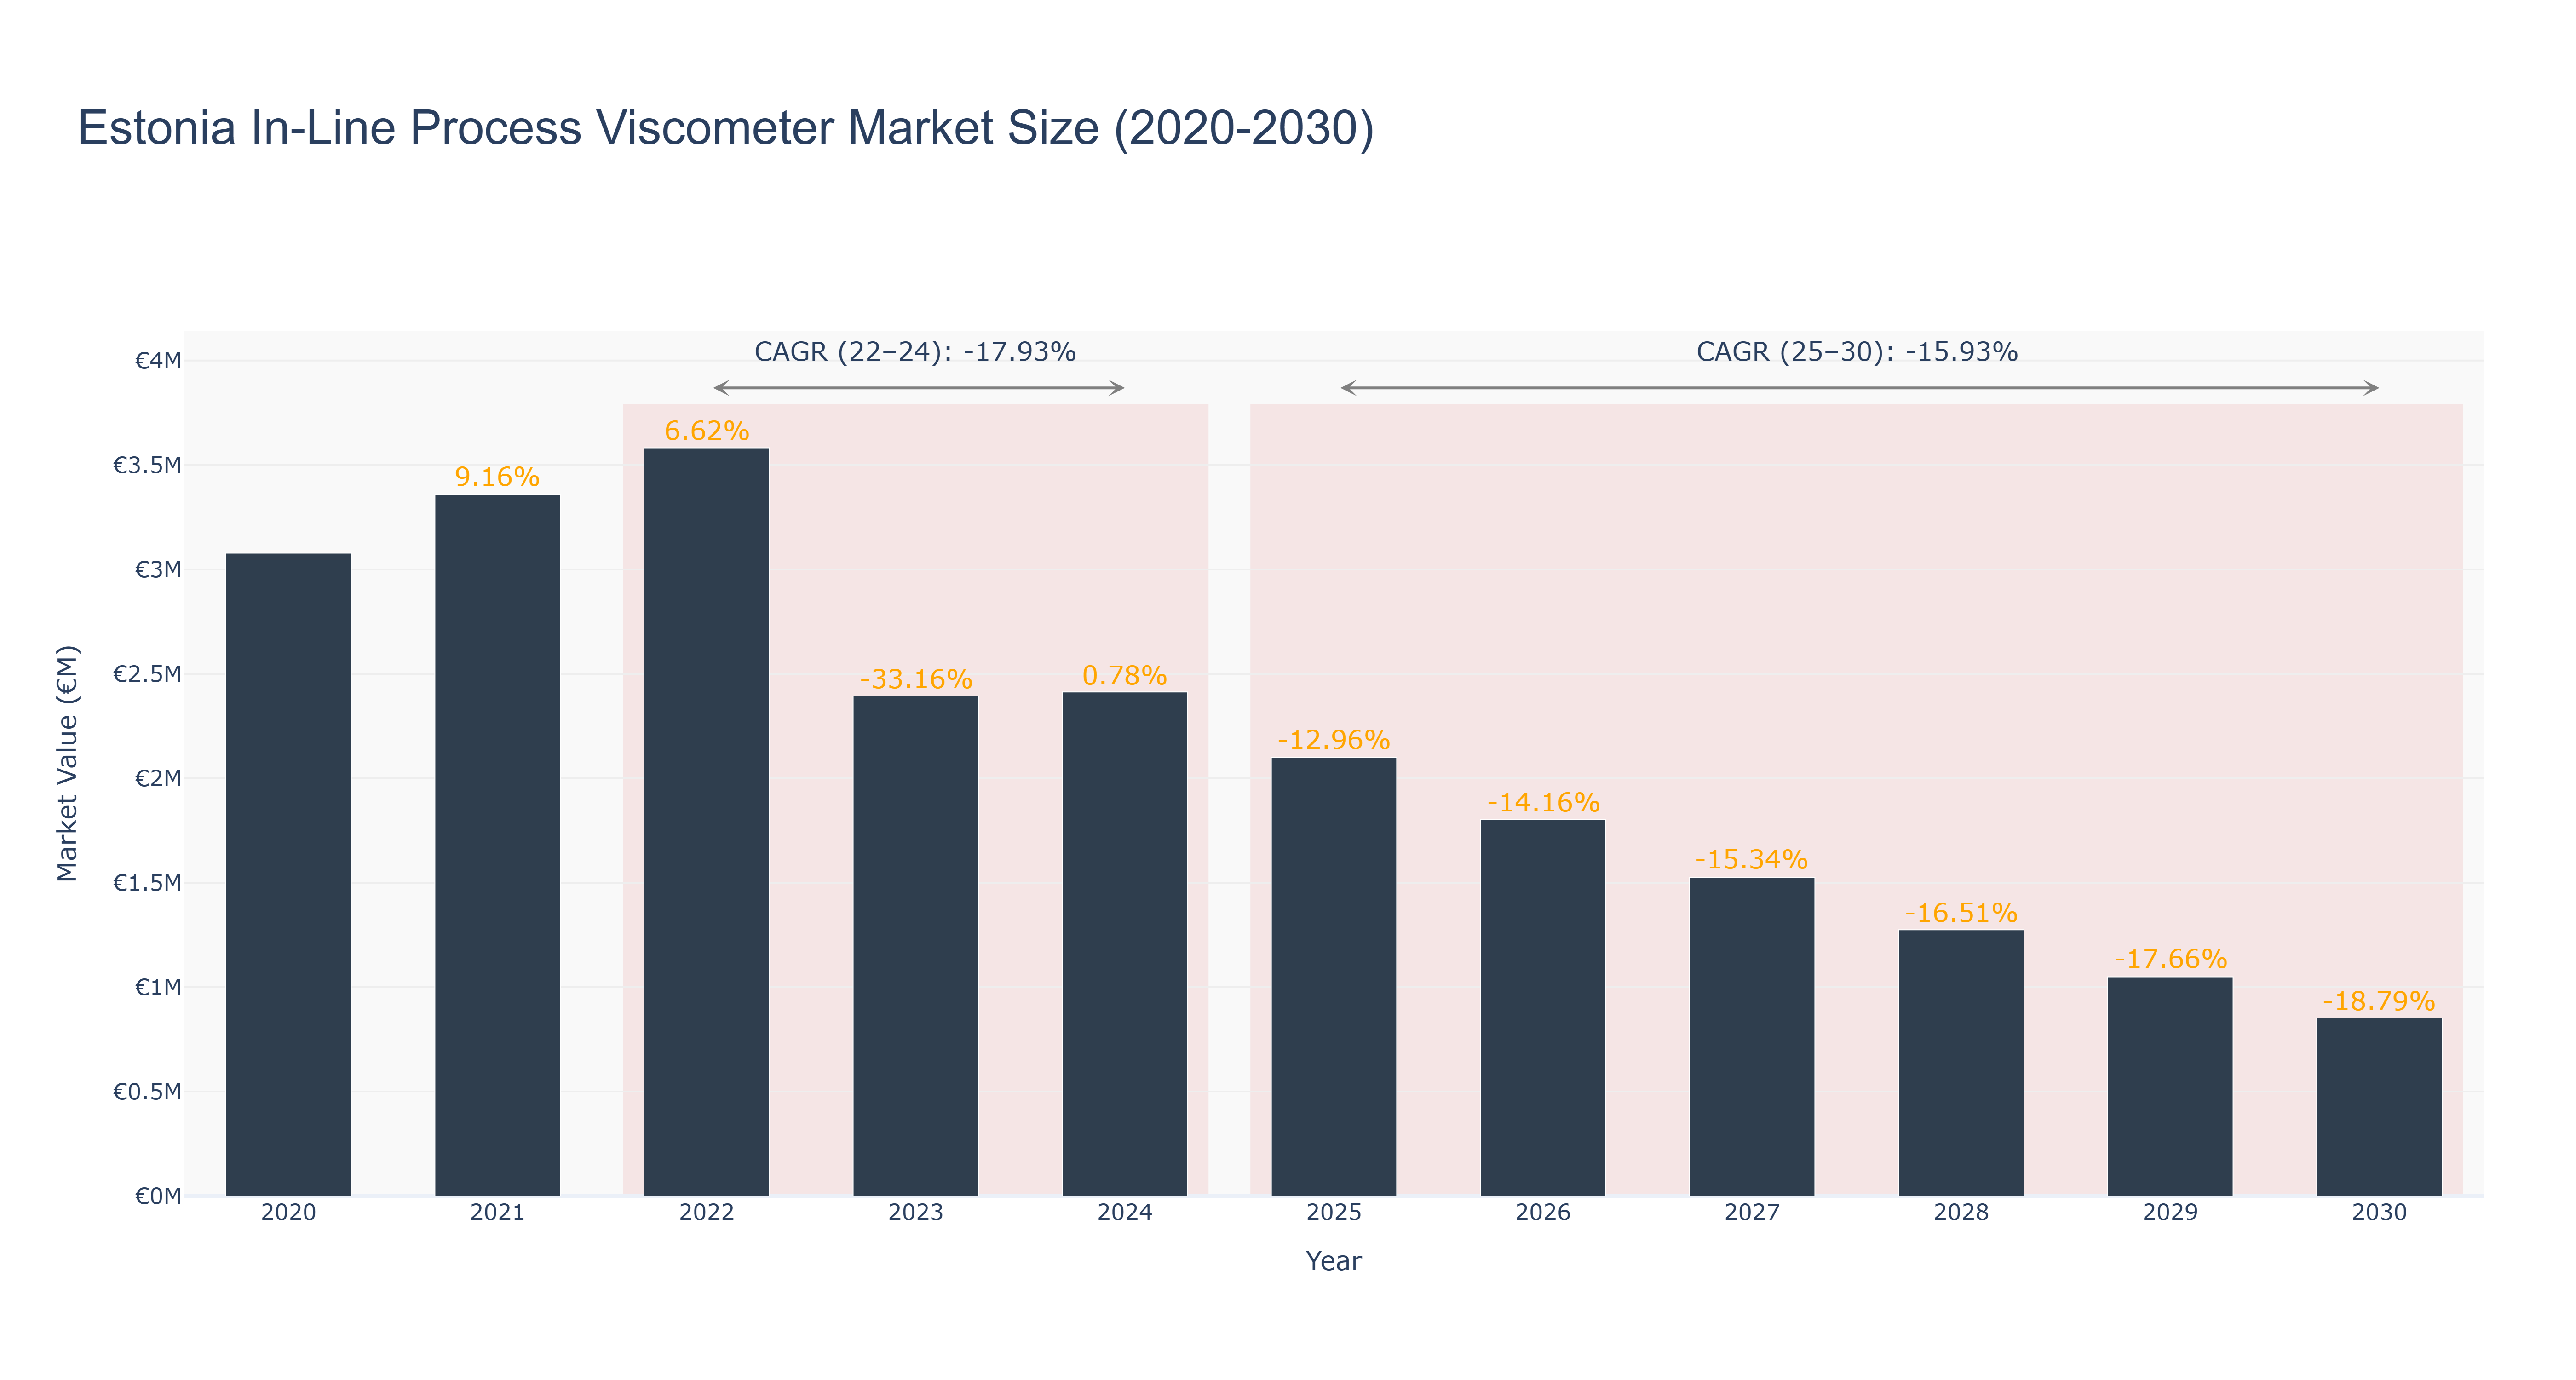
The Estonia In-Line Process Viscometer Market reached its peak size of €3.58 million in 2022, after witnessing a steady growth trajectory from €3.08 million in 2020 to €3.36 million in 2021, followed by a 6.62% increase in 2022. However, the market experienced a significant decline in 2023, with a market size of €2.39 million and a dramatic growth rate of -33.16%. The actual market from 2022 to 2024 shows a compounded annual growth rate (CAGR) of -17.93%. Looking ahead, the forecasted values from 2025 to 2030 indicate a continued contraction, with a projected CAGR of -15.93%, ultimately leading to a market size of approximately €852.19 thousand by 2030. This decline can be attributed to decreased industrial demand and shifts toward alternative technologies. Despite this downturn, potential macro drivers, such as advancements in automation and process optimization, could revive interest in viscometer technologies in the long-term future.
Estonia In-Line Process Viscometer Market: Production & Trade Performance (2019-2025)
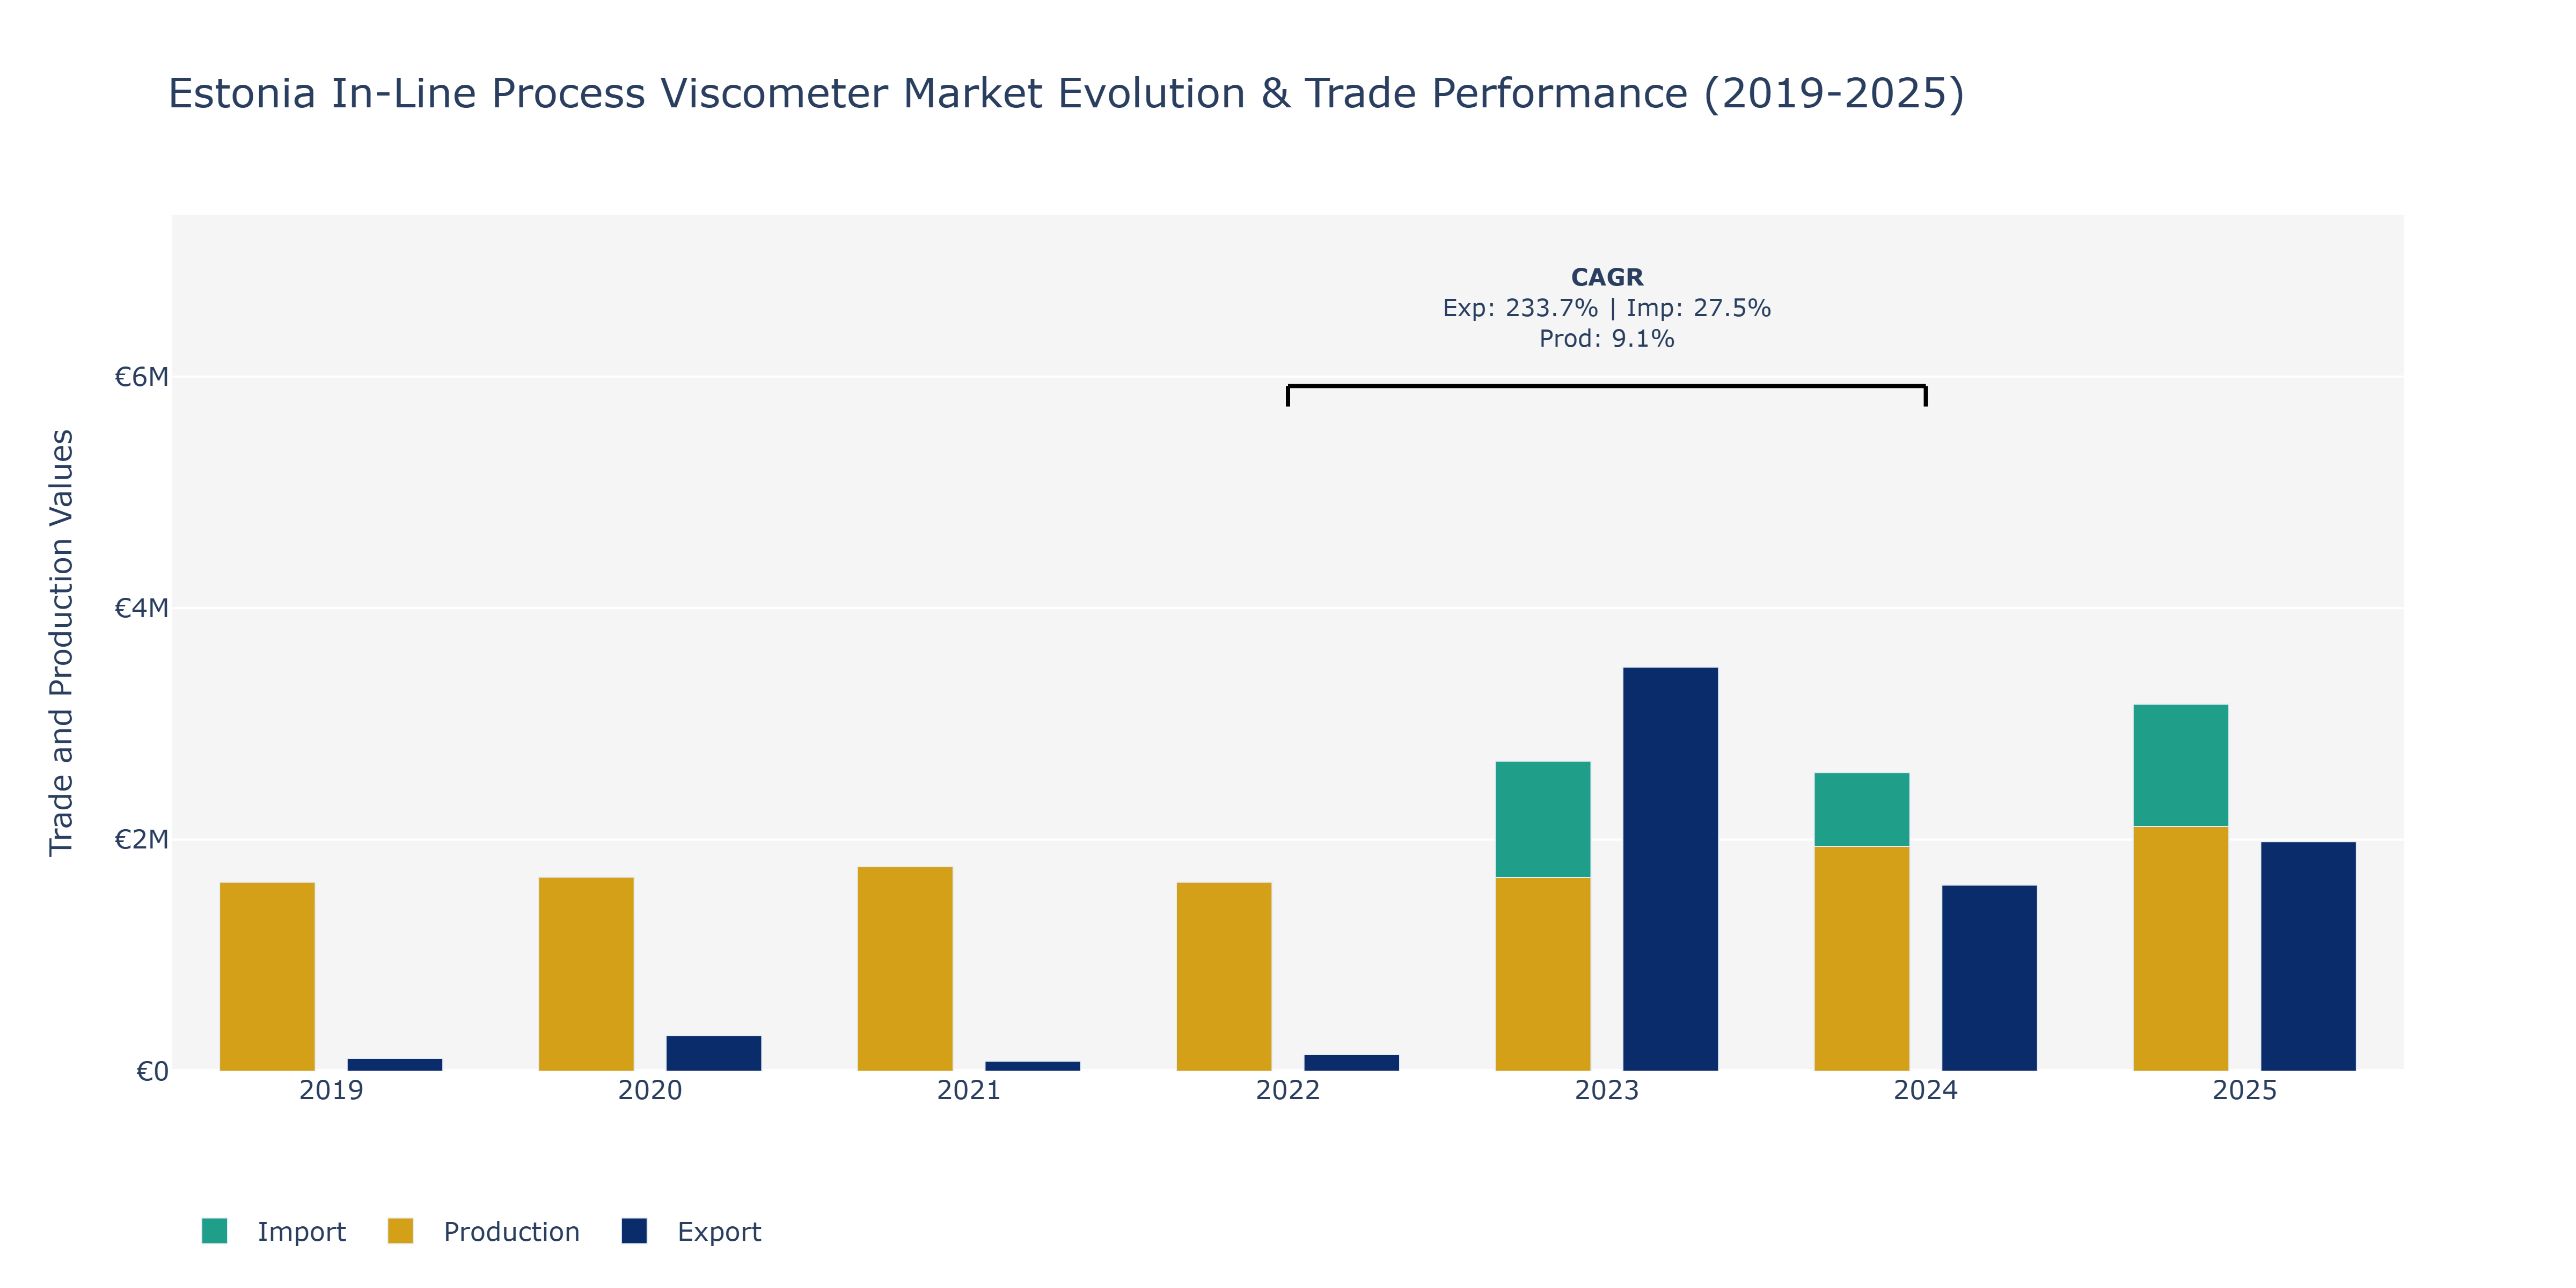
The Estonia In-Line Process Viscometer Market witnessed dynamic shifts in exports, imports, and production from 2019 to 2025. Exports surged from €110.75 thousand in 2019 to a peak of €3.49 million in 2023, attributed to increased demand for viscometers globally. However, a notable decline to €1.98 million in 2025 suggests potential market saturation or varying international trade dynamics. Imports followed a fluctuating trend, reaching €3.17 million in 2025 after a peak in 2020 at €1.32 million, possibly indicating evolving supply chain strategies or changes in domestic production capabilities. Production value climbed steadily each year, marking a steady growth trajectory from €1.63 million in 2019 to €2.11 million in 2025, reflecting Estonia's strengthening manufacturing sector and technological advancements in viscometer production processes. These trends align with the market's technological advancements and increasing applications in sectors like pharmaceuticals, chemicals, and food processing, as validated by industry reports on the growing demand for in-line process viscometers in various sectors.
Key Highlights of the Report:
- Estonia In-Line Process Viscometer Market Outlook
- Market Size of Estonia In-Line Process Viscometer Market, 2025
- Forecast of Estonia In-Line Process Viscometer Market, 2032
- Historical Data and Forecast of Estonia In-Line Process Viscometer Revenues & Volume for the Period 2022 - 2032F
- Estonia In-Line Process Viscometer Market Trend Evolution
- Estonia In-Line Process Viscometer Market Drivers and Challenges
- Estonia In-Line Process Viscometer Price Trends
- Estonia In-Line Process Viscometer Porter's Five Forces
- Estonia In-Line Process Viscometer Industry Life Cycle
- Historical Data and Forecast of Estonia In-Line Process Viscometer Market Revenues & Volume By Technology Type for the Period 2022 - 2032F
- Historical Data and Forecast of Estonia In-Line Process Viscometer Market Revenues & Volume By Rotational for the Period 2022 - 2032F
- Historical Data and Forecast of Estonia In-Line Process Viscometer Market Revenues & Volume By Torsional Oscillation for the Period 2022 - 2032F
- Historical Data and Forecast of Estonia In-Line Process Viscometer Market Revenues & Volume By Vibration for the Period 2022 - 2032F
- Historical Data and Forecast of Estonia In-Line Process Viscometer Market Revenues & Volume By Moving Piston for the Period 2022 - 2032F
- Historical Data and Forecast of Estonia In-Line Process Viscometer Market Revenues & Volume By Application for the Period 2022 - 2032F
- Historical Data and Forecast of Estonia In-Line Process Viscometer Market Revenues & Volume By Industrial for the Period 2022 - 2032F
- Historical Data and Forecast of Estonia In-Line Process Viscometer Market Revenues & Volume By Pharmaceutical for the Period 2022 - 2032F
- Historical Data and Forecast of Estonia In-Line Process Viscometer Market Revenues & Volume By Food Processing for the Period 2022 - 2032F
- Historical Data and Forecast of Estonia In-Line Process Viscometer Market Revenues & Volume By Chemical for the Period 2022 - 2032F
- Historical Data and Forecast of Estonia In-Line Process Viscometer Market Revenues & Volume By End User for the Period 2022 - 2032F
- Historical Data and Forecast of Estonia In-Line Process Viscometer Market Revenues & Volume By Manufacturing Plants for the Period 2022 - 2032F
- Historical Data and Forecast of Estonia In-Line Process Viscometer Market Revenues & Volume By Pharmaceutical Companies for the Period 2022 - 2032F
- Historical Data and Forecast of Estonia In-Line Process Viscometer Market Revenues & Volume By Food and Beverage Manufacturers for the Period 2022 - 2032F
- Historical Data and Forecast of Estonia In-Line Process Viscometer Market Revenues & Volume By Chemical Industries for the Period 2022 - 2032F
- Historical Data and Forecast of Estonia In-Line Process Viscometer Market Revenues & Volume By Product Type for the Period 2022 - 2032F
- Historical Data and Forecast of Estonia In-Line Process Viscometer Market Revenues & Volume By Rotational Viscometers for the Period 2022 - 2032F
- Historical Data and Forecast of Estonia In-Line Process Viscometer Market Revenues & Volume By Torsional Oscillation Viscometers for the Period 2022 - 2032F
- Historical Data and Forecast of Estonia In-Line Process Viscometer Market Revenues & Volume By Vibration Viscometers for the Period 2022 - 2032F
- Historical Data and Forecast of Estonia In-Line Process Viscometer Market Revenues & Volume By Moving Piston Viscometers for the Period 2022 - 2032F
- Estonia In-Line Process Viscometer Import Export Trade Statistics
- Market Opportunity Assessment By Technology Type
- Market Opportunity Assessment By Application
- Market Opportunity Assessment By End User
- Market Opportunity Assessment By Product Type
- Estonia In-Line Process Viscometer Top Companies Market Share
- Estonia In-Line Process Viscometer Competitive Benchmarking By Technical and Operational Parameters
- Estonia In-Line Process Viscometer Company Profiles
- Estonia In-Line Process Viscometer Key Strategic Recommendations
Frequently Asked Questions About the Market Study (FAQs):
6Wresearch actively monitors the Estonia In-Line Process Viscometer Market and publishes its comprehensive annual report, highlighting emerging trends, growth drivers, revenue analysis, and forecast outlook. Our insights help businesses to make data-backed strategic decisions with ongoing market dynamics. Our analysts track relevent industries related to the Estonia In-Line Process Viscometer Market, allowing our clients with actionable intelligence and reliable forecasts tailored to emerging regional needs.
Yes, we provide customisation as per your requirements. To learn more, feel free to contact us on sales@6wresearch.com
1 Executive Summary |
2 Introduction |
2.1 Key Highlights of the Report |
2.2 Report Description |
2.3 Market Scope & Segmentation |
2.4 Research Methodology |
2.5 Assumptions |
3 Estonia In-Line Process Viscometer Market Overview |
3.1 Estonia Country Macro Economic Indicators |
3.2 Estonia In-Line Process Viscometer Market Revenues & Volume, 2022 & 2032F |
3.3 Estonia In-Line Process Viscometer Market - Industry Life Cycle |
3.4 Estonia In-Line Process Viscometer Market - Porter's Five Forces |
3.5 Estonia In-Line Process Viscometer Market Revenues & Volume Share, By Technology Type, 2022 & 2032F |
3.6 Estonia In-Line Process Viscometer Market Revenues & Volume Share, By Application, 2022 & 2032F |
3.7 Estonia In-Line Process Viscometer Market Revenues & Volume Share, By End User, 2022 & 2032F |
3.8 Estonia In-Line Process Viscometer Market Revenues & Volume Share, By Product Type, 2022 & 2032F |
4 Estonia In-Line Process Viscometer Market Dynamics |
4.1 Impact Analysis |
4.2 Market Drivers |
4.2.1 Increasing demand for real-time viscosity measurement in manufacturing processes |
4.2.2 Growing focus on process optimization and efficiency in industries |
4.2.3 Advancements in technology leading to improved accuracy and reliability of in-line process viscometers |
4.3 Market Restraints |
4.3.1 High initial investment required for installing in-line process viscometers |
4.3.2 Lack of awareness about the benefits of in-line viscosity measurement technology |
4.3.3 Challenges in integrating in-line process viscometers with existing manufacturing systems |
5 Estonia In-Line Process Viscometer Market Trends |
6 Estonia In-Line Process Viscometer Market, By Types |
6.1 Estonia In-Line Process Viscometer Market, By Technology Type |
6.1.1 Overview and Analysis |
6.1.2 Estonia In-Line Process Viscometer Market Revenues & Volume, By Technology Type, 2022 - 2032F |
6.1.3 Estonia In-Line Process Viscometer Market Revenues & Volume, By Rotational, 2022 - 2032F |
6.1.4 Estonia In-Line Process Viscometer Market Revenues & Volume, By Torsional Oscillation, 2022 - 2032F |
6.1.5 Estonia In-Line Process Viscometer Market Revenues & Volume, By Vibration, 2022 - 2032F |
6.1.6 Estonia In-Line Process Viscometer Market Revenues & Volume, By Moving Piston, 2022 - 2032F |
6.2 Estonia In-Line Process Viscometer Market, By Application |
6.2.1 Overview and Analysis |
6.2.2 Estonia In-Line Process Viscometer Market Revenues & Volume, By Industrial, 2022 - 2032F |
6.2.3 Estonia In-Line Process Viscometer Market Revenues & Volume, By Pharmaceutical, 2022 - 2032F |
6.2.4 Estonia In-Line Process Viscometer Market Revenues & Volume, By Food Processing, 2022 - 2032F |
6.2.5 Estonia In-Line Process Viscometer Market Revenues & Volume, By Chemical, 2022 - 2032F |
6.3 Estonia In-Line Process Viscometer Market, By End User |
6.3.1 Overview and Analysis |
6.3.2 Estonia In-Line Process Viscometer Market Revenues & Volume, By Manufacturing Plants, 2022 - 2032F |
6.3.3 Estonia In-Line Process Viscometer Market Revenues & Volume, By Pharmaceutical Companies, 2022 - 2032F |
6.3.4 Estonia In-Line Process Viscometer Market Revenues & Volume, By Food and Beverage Manufacturers, 2022 - 2032F |
6.3.5 Estonia In-Line Process Viscometer Market Revenues & Volume, By Chemical Industries, 2022 - 2032F |
6.4 Estonia In-Line Process Viscometer Market, By Product Type |
6.4.1 Overview and Analysis |
6.4.2 Estonia In-Line Process Viscometer Market Revenues & Volume, By Rotational Viscometers, 2022 - 2032F |
6.4.3 Estonia In-Line Process Viscometer Market Revenues & Volume, By Torsional Oscillation Viscometers, 2022 - 2032F |
6.4.4 Estonia In-Line Process Viscometer Market Revenues & Volume, By Vibration Viscometers, 2022 - 2032F |
6.4.5 Estonia In-Line Process Viscometer Market Revenues & Volume, By Moving Piston Viscometers, 2022 - 2032F |
7 Estonia In-Line Process Viscometer Market Import-Export Trade Statistics |
7.1 Estonia In-Line Process Viscometer Market Export to Major Countries |
7.2 Estonia In-Line Process Viscometer Market Imports from Major Countries |
8 Estonia In-Line Process Viscometer Market Key Performance Indicators |
8.1 Mean Time Between Failures (MTBF) of in-line process viscometers |
8.2 Percentage increase in process efficiency after implementing in-line viscometers |
8.3 Number of industries adopting in-line process viscometers |
8.4 Average time saved in production processes by using in-line viscometers |
8.5 Rate of return on investment (ROI) for companies utilizing in-line process viscometers |
9 Estonia In-Line Process Viscometer Market - Opportunity Assessment |
9.1 Estonia In-Line Process Viscometer Market Opportunity Assessment, By Technology Type, 2022 & 2032F |
9.2 Estonia In-Line Process Viscometer Market Opportunity Assessment, By Application, 2022 & 2032F |
9.3 Estonia In-Line Process Viscometer Market Opportunity Assessment, By End User, 2022 & 2032F |
9.4 Estonia In-Line Process Viscometer Market Opportunity Assessment, By Product Type, 2022 & 2032F |
10 Estonia In-Line Process Viscometer Market - Competitive Landscape |
10.1 Estonia In-Line Process Viscometer Market Revenue Share, By Companies, 2025 |
10.2 Estonia In-Line Process Viscometer Market Competitive Benchmarking, By Operating and Technical Parameters |
11 Company Profiles |
12 Recommendations |
13 Disclaimer |
Export potential assessment - trade Analytics for 2030
Export potential enables firms to identify high-growth global markets with greater confidence by combining advanced trade intelligence with a structured quantitative methodology. The framework analyzes emerging demand trends and country-level import patterns while integrating macroeconomic and trade datasets such as GDP and population forecasts, bilateral import–export flows, tariff structures, elasticity differentials between developed and developing economies, geographic distance, and import demand projections. Using weighted trade values from 2020–2024 as the base period to project country-to-country export potential for 2030, these inputs are operationalized through calculated drivers such as gravity model parameters, tariff impact factors, and projected GDP per-capita growth. Through an analysis of hidden potentials, demand hotspots, and market conditions that are most favorable to success, this method enables firms to focus on target countries, maximize returns, and global expansion with data, backed by accuracy.
By factoring in the projected importer demand gap that is currently unmet and could be potential opportunity, it identifies the potential for the Exporter (Country) among 190 countries, against the general trade analysis, which identifies the biggest importer or exporter.
To discover high-growth global markets and optimize your business strategy:
Click Here
Pricing
- Single User License$ 1,995
- Department License$ 2,400
- Site License$ 3,120
- Global License$ 3,795

Search
Thought Leadership and Analyst Meet


Our Clients
Latest Reports
- Canada Cloud CFD Market (2026-2032) | Size & Revenue, Industry, Growth, Competitive Landscape, Forecast, Segmentation, Value, Outlook, Trends, Share, Analysis, Companies
- Taiwan Food Delivery Platform Market (2026-2032) | Companies, Outlook, Analysis, Trends, Value, Revenue, Segmentation, Share, Forecast, Competitive Landscape, Growth, Size & Forecast
- United Kingdom (UK) Long-term Care Insurance Market (2026-2032) | Growth, Share, Consumer Insights, Drivers, Opportunities, Competition, Pricing Analysis, Segments, Restraints, Companies, Competitive, Value, Outlook, Size, Demand, Analysis, Challenges, Strategic Insights, Investment Trends, Revenue, Trends, Supply, Forecast
- United Kingdom (UK) Long Term Care Market (2026-2032) | Companies, Outlook, Analysis, Trends, Value, Revenue, Segmentation, Share, Forecast, Competitive Landscape, Growth, Size & Forecast
- Iraq Insulation and Waterproofing Market (2026-2032) | Outlook, Drivers, Growth, Size, Share, Industry, Revenue, Trends, Demand, Competitive, Strategic Insights, Opportunities, Segments, Companies, Challenges, Strategy, Consumer Insights, Analysis, Investment Trends, Value, Segmentation, Forecast, Restraints
- India Switchgear Market Outlook (2026-2032) | Size, Share, Trends, Growth, Revenue, Forecast, Analysis, Value, Outlook
- Pakistan Contraceptive Implants Market (2025-2031) | Demand, Growth, Size, Share, Industry, Pricing Analysis, Competitive, Strategic Insights, Strategy, Consumer Insights, Analysis, Investment Trends, Opportunities, Revenue, Segments, Value, Segmentation, Supply, Forecast, Restraints, Outlook, Competition, Drivers, Trends, Companies, Challenges
- Sri Lanka Packaging Market (2026-2032) | Outlook, Competition, Drivers, Trends, Demand, Pricing Analysis, Competitive, Strategic Insights, Companies, Challenges, Strategy, Consumer Insights, Analysis, Investment Trends, Opportunities, Growth, Size, Share, Industry, Revenue, Segments, Value, Segmentation, Supply, Forecast, Restraints
- India Kids Watches Market (2026-2032) | Strategy, Consumer Insights, Analysis, Investment Trends, Opportunities, Growth, Size, Share, Industry, Revenue, Segments, Value, Segmentation, Supply, Forecast, Restraints, Outlook, Competition, Drivers, Trends, Demand, Pricing Analysis, Competitive, Strategic Insights, Companies, Challenges
- Saudi Arabia Core Assurance Service Market (2025-2031) | Strategy, Consumer Insights, Analysis, Investment Trends, Opportunities, Growth, Size, Share, Industry, Revenue, Segments, Value, Segmentation, Supply, Forecast, Restraints, Outlook, Competition, Drivers, Trends, Demand, Pricing Analysis, Competitive, Strategic Insights, Companies, Challenges
Industry Events and Analyst Meet

India EV Show 2026

EV tech India Expo 2026

Auto Tech Asia 2026

Battery Tech India 2026

Smart Production Solutions Guangzhou 2026
Whitepaper
- Middle East & Africa Commercial Security Market Click here to view more.
- Middle East & Africa Fire Safety Systems & Equipment Market Click here to view more.
- GCC Drone Market Click here to view more.
- Middle East Lighting Fixture Market Click here to view more.
- GCC Physical & Perimeter Security Market Click here to view more.
6WResearch In News
- Doha a strategic location for EV manufacturing hub: IPA Qatar
- Demand for luxury TVs surging in the GCC, says Samsung
- Empowering Growth: The Thriving Journey of Bangladesh’s Cable Industry
- Demand for luxury TVs surging in the GCC, says Samsung
- Video call with a traditional healer? Once unthinkable, it’s now common in South Africa
- Intelligent Buildings To Smooth GCC’s Path To Net Zero