Estonia Isosorbide Market (2025-2031) | Industry, Segmentation, Growth, Revenue, Size, Value, Outlook, Analysis, Forecast, Share, Trends & Companies
Market Forecast By Product (Oil-Based Isosorbide, Water-Based Isosorbide, Silicone-Based Isosorbide), By Application (PEIT, Polycarbonate, Polyesters Isosorbide Succinate, Polyurethane, Isosorbide Diesters, Others), By End-use (Polymers and Resins, Additives, Others) And Competitive Landscape
| Product Code: ETC4811307 | Publication Date: Nov 2023 | Updated Date: Nov 2025 | Product Type: Market Research Report | |
| Publisher: 6Wresearch | Author: Sachin Kumar Rai | No. of Pages: 60 | No. of Figures: 30 | No. of Tables: 5 |
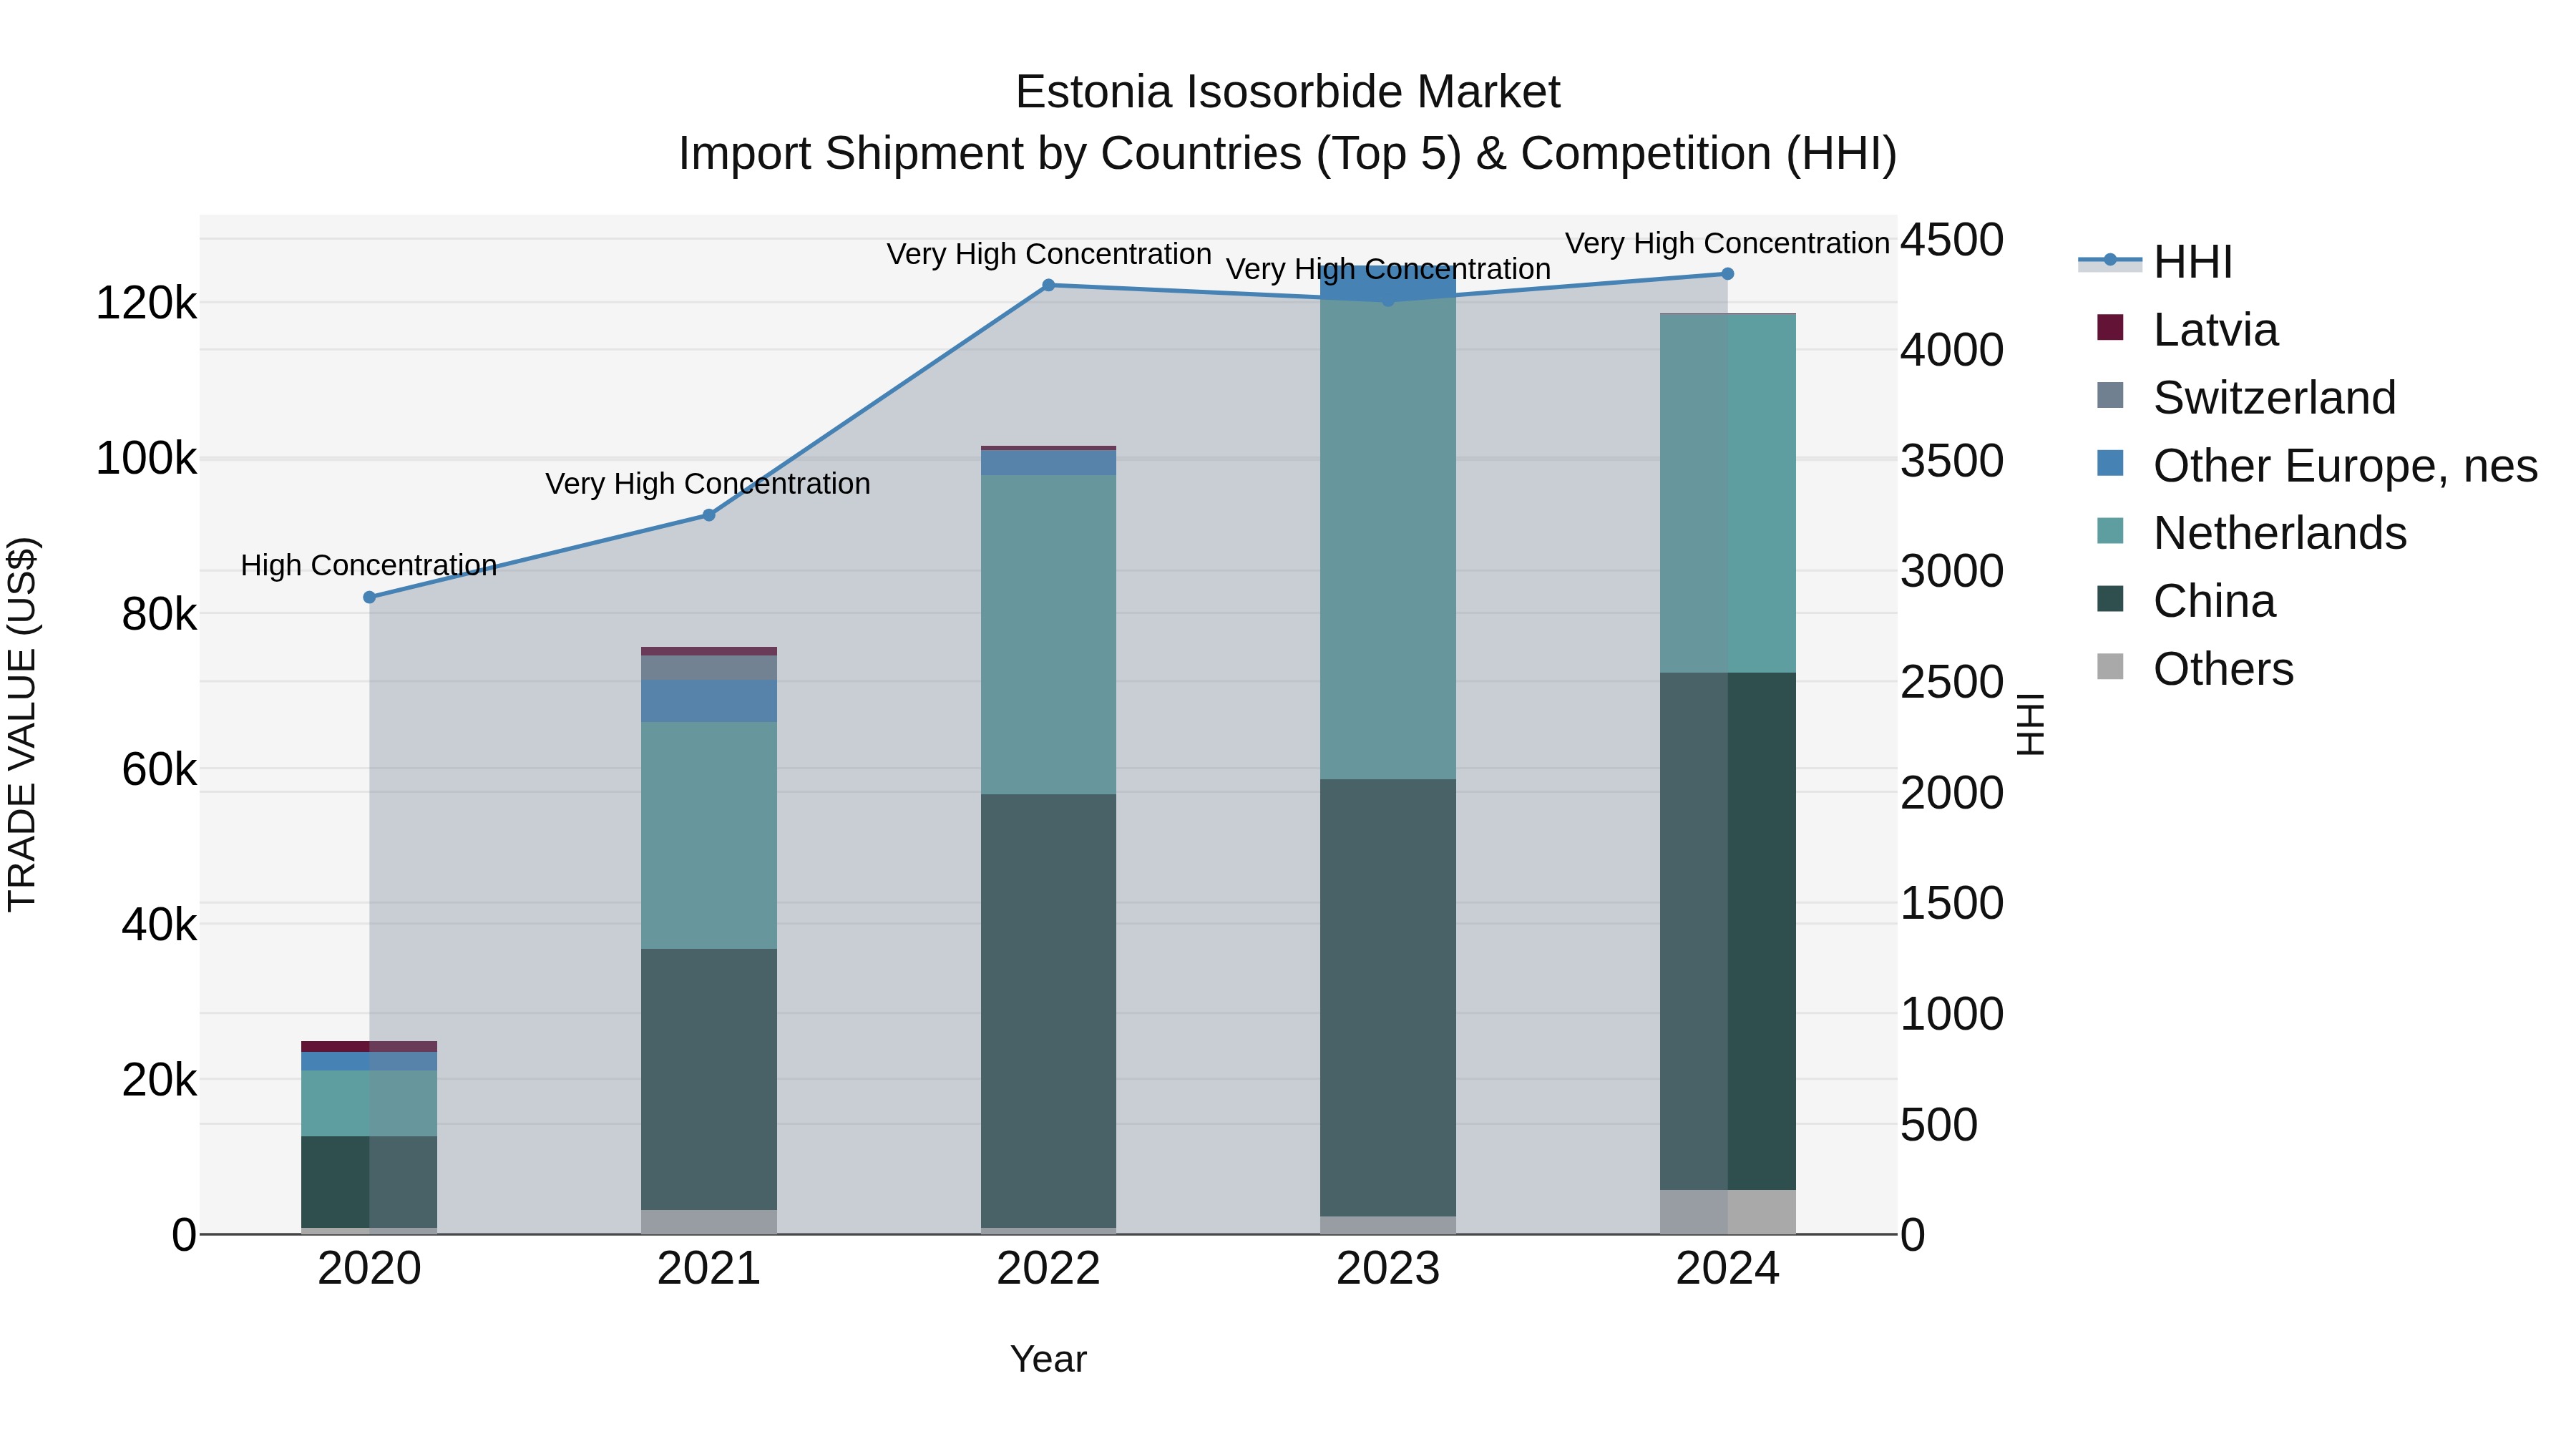
Estonia Isosorbide Market Top 5 Importing Countries and Market Competition (HHI) Analysis
In 2024, Estonia continued to see significant import shipments of isosorbide, with top exporting countries being China, Netherlands, Poland, Finland, and Metropolitan France. The high Herfindahl-Hirschman Index (HHI) indicates a concentrated market. The impressive compound annual growth rate (CAGR) of 47.83% from 2020 to 2024 showcases a thriving market, although there was a slight decline in growth rate from 2023 to 2024 at -4.93%. Estonia`s reliance on these key exporting countries highlights the importance of monitoring trends and market dynamics in the isosorbide industry.
Estonia Isosorbide Market Overview
The isosorbide market in Estonia is witnessing growth due to its increasing use as a bio-based material in the production of plastics and polymers. Isosorbide is an important component in the manufacturing of biodegradable plastics, which are gaining popularity due to environmental concerns. With a rising emphasis on sustainable materials, Estonia is seeing increased demand for isosorbide in industries such as packaging, automotive, and electronics. This market is expected to grow as the demand for eco-friendly and renewable materials increases.
Drivers of the market
The isosorbide market in Estonia is fueled by its use as a sustainable alternative in polymers and its application in pharmaceuticals. The growing demand for bio-based materials aligns with the countrys sustainability goals.
Challenges of the market
The isosorbide market is challenged by the high production costs associated with bio-based manufacturing processes. Despite its eco-friendly appeal, the cost of producing isosorbide remains a significant hurdle for its widespread adoption, particularly in industries that are price-sensitive. Additionally, the market faces competition from traditional petroleum-based products, which are often less expensive and easier to produce at scale. While demand for sustainable products is increasing, especially in the packaging and plastics industries, regulatory and technological hurdles need to be overcome to make isosorbide a viable alternative at a competitive price. Market fragmentation and the limited number of suppliers in the space also present challenges in scaling production.
Government Policy of the market
Estonia supports the development of isosorbide as a renewable and sustainable material used in the production of bio-based plastics, pharmaceuticals, and chemicals. The government encourages research into its applications while ensuring that isosorbide production meets EU environmental, safety, and sustainability regulations.
Key Highlights of the Report:
- Estonia Isosorbide Market Outlook
- Market Size of Estonia Isosorbide Market, 2024
- Forecast of Estonia Isosorbide Market, 2031
- Historical Data and Forecast of Estonia Isosorbide Revenues & Volume for the Period 2021-2031
- Estonia Isosorbide Market Trend Evolution
- Estonia Isosorbide Market Drivers and Challenges
- Estonia Isosorbide Price Trends
- Estonia Isosorbide Porter`s Five Forces
- Estonia Isosorbide Industry Life Cycle
- Historical Data and Forecast of Estonia Isosorbide Market Revenues & Volume By Product for the Period 2021-2031
- Historical Data and Forecast of Estonia Isosorbide Market Revenues & Volume By Oil-Based Isosorbide for the Period 2021-2031
- Historical Data and Forecast of Estonia Isosorbide Market Revenues & Volume By Water-Based Isosorbide for the Period 2021-2031
- Historical Data and Forecast of Estonia Isosorbide Market Revenues & Volume By Silicone-Based Isosorbide for the Period 2021-2031
- Historical Data and Forecast of Estonia Isosorbide Market Revenues & Volume By Application for the Period 2021-2031
- Historical Data and Forecast of Estonia Isosorbide Market Revenues & Volume By PEIT for the Period 2021-2031
- Historical Data and Forecast of Estonia Isosorbide Market Revenues & Volume By Polycarbonate for the Period 2021-2031
- Historical Data and Forecast of Estonia Isosorbide Market Revenues & Volume By Polyesters Isosorbide Succinate for the Period 2021-2031
- Historical Data and Forecast of Estonia Isosorbide Market Revenues & Volume By Polyurethane for the Period 2021-2031
- Historical Data and Forecast of Estonia Isosorbide Market Revenues & Volume By Isosorbide Diesters for the Period 2021-2031
- Historical Data and Forecast of Estonia Isosorbide Market Revenues & Volume By Others for the Period 2021-2031
- Historical Data and Forecast of Estonia Isosorbide Market Revenues & Volume By End-use for the Period 2021-2031
- Historical Data and Forecast of Estonia Isosorbide Market Revenues & Volume By Polymers and Resins for the Period 2021-2031
- Historical Data and Forecast of Estonia Isosorbide Market Revenues & Volume By Additives for the Period 2021-2031
- Historical Data and Forecast of Estonia Isosorbide Market Revenues & Volume By Others for the Period 2021-2031
- Estonia Isosorbide Import Export Trade Statistics
- Market Opportunity Assessment By Product
- Market Opportunity Assessment By Application
- Market Opportunity Assessment By End-use
- Estonia Isosorbide Top Companies Market Share
- Estonia Isosorbide Competitive Benchmarking By Technical and Operational Parameters
- Estonia Isosorbide Company Profiles
- Estonia Isosorbide Key Strategic Recommendations
Frequently Asked Questions About the Market Study (FAQs):
6Wresearch actively monitors the Estonia Isosorbide Market and publishes its comprehensive annual report, highlighting emerging trends, growth drivers, revenue analysis, and forecast outlook. Our insights help businesses to make data-backed strategic decisions with ongoing market dynamics. Our analysts track relevent industries related to the Estonia Isosorbide Market, allowing our clients with actionable intelligence and reliable forecasts tailored to emerging regional needs.
Yes, we provide customisation as per your requirements. To learn more, feel free to contact us on sales@6wresearch.com
1 Executive Summary |
2 Introduction |
2.1 Key Highlights of the Report |
2.2 Report Description |
2.3 Market Scope & Segmentation |
2.4 Research Methodology |
2.5 Assumptions |
3 Estonia Isosorbide Market Overview |
3.1 Estonia Country Macro Economic Indicators |
3.2 Estonia Isosorbide Market Revenues & Volume, 2021 & 2031F |
3.3 Estonia Isosorbide Market - Industry Life Cycle |
3.4 Estonia Isosorbide Market - Porter's Five Forces |
3.5 Estonia Isosorbide Market Revenues & Volume Share, By Product, 2021 & 2031F |
3.6 Estonia Isosorbide Market Revenues & Volume Share, By Application, 2021 & 2031F |
3.7 Estonia Isosorbide Market Revenues & Volume Share, By End-use, 2021 & 2031F |
4 Estonia Isosorbide Market Dynamics |
4.1 Impact Analysis |
4.2 Market Drivers |
4.3 Market Restraints |
5 Estonia Isosorbide Market Trends |
6 Estonia Isosorbide Market Segmentations |
6.1 Estonia Isosorbide Market, By Product |
6.1.1 Overview and Analysis |
6.1.2 Estonia Isosorbide Market Revenues & Volume, By Oil-Based Isosorbide, 2021-2031F |
6.1.3 Estonia Isosorbide Market Revenues & Volume, By Water-Based Isosorbide, 2021-2031F |
6.1.4 Estonia Isosorbide Market Revenues & Volume, By Silicone-Based Isosorbide, 2021-2031F |
6.2 Estonia Isosorbide Market, By Application |
6.2.1 Overview and Analysis |
6.2.2 Estonia Isosorbide Market Revenues & Volume, By PEIT, 2021-2031F |
6.2.3 Estonia Isosorbide Market Revenues & Volume, By Polycarbonate, 2021-2031F |
6.2.4 Estonia Isosorbide Market Revenues & Volume, By Polyesters Isosorbide Succinate, 2021-2031F |
6.2.5 Estonia Isosorbide Market Revenues & Volume, By Polyurethane, 2021-2031F |
6.2.6 Estonia Isosorbide Market Revenues & Volume, By Isosorbide Diesters, 2021-2031F |
6.2.7 Estonia Isosorbide Market Revenues & Volume, By Others, 2021-2031F |
6.3 Estonia Isosorbide Market, By End-use |
6.3.1 Overview and Analysis |
6.3.2 Estonia Isosorbide Market Revenues & Volume, By Polymers and Resins, 2021-2031F |
6.3.3 Estonia Isosorbide Market Revenues & Volume, By Additives, 2021-2031F |
6.3.4 Estonia Isosorbide Market Revenues & Volume, By Others, 2021-2031F |
7 Estonia Isosorbide Market Import-Export Trade Statistics |
7.1 Estonia Isosorbide Market Export to Major Countries |
7.2 Estonia Isosorbide Market Imports from Major Countries |
8 Estonia Isosorbide Market Key Performance Indicators |
9 Estonia Isosorbide Market - Opportunity Assessment |
9.1 Estonia Isosorbide Market Opportunity Assessment, By Product, 2021 & 2031F |
9.2 Estonia Isosorbide Market Opportunity Assessment, By Application, 2021 & 2031F |
9.3 Estonia Isosorbide Market Opportunity Assessment, By End-use, 2021 & 2031F |
10 Estonia Isosorbide Market - Competitive Landscape |
10.1 Estonia Isosorbide Market Revenue Share, By Companies, 2024 |
10.2 Estonia Isosorbide Market Competitive Benchmarking, By Operating and Technical Parameters |
11 Company Profiles |
12 Recommendations | 13 Disclaimer |
Export potential assessment - trade Analytics for 2030
Export potential enables firms to identify high-growth global markets with greater confidence by combining advanced trade intelligence with a structured quantitative methodology. The framework analyzes emerging demand trends and country-level import patterns while integrating macroeconomic and trade datasets such as GDP and population forecasts, bilateral import–export flows, tariff structures, elasticity differentials between developed and developing economies, geographic distance, and import demand projections. Using weighted trade values from 2020–2024 as the base period to project country-to-country export potential for 2030, these inputs are operationalized through calculated drivers such as gravity model parameters, tariff impact factors, and projected GDP per-capita growth. Through an analysis of hidden potentials, demand hotspots, and market conditions that are most favorable to success, this method enables firms to focus on target countries, maximize returns, and global expansion with data, backed by accuracy.
By factoring in the projected importer demand gap that is currently unmet and could be potential opportunity, it identifies the potential for the Exporter (Country) among 190 countries, against the general trade analysis, which identifies the biggest importer or exporter.
To discover high-growth global markets and optimize your business strategy:
Click Here
Pricing
- Single User License$ 1,995
- Department License$ 2,400
- Site License$ 3,120
- Global License$ 3,795

Search
Thought Leadership and Analyst Meet


Our Clients
Latest Reports
- Taiwan Food Delivery Platform Market (2026-2032) | Companies, Outlook, Analysis, Trends, Value, Revenue, Segmentation, Share, Forecast, Competitive Landscape, Growth, Size & Forecast
- United Kingdom (UK) Long-term Care Insurance Market (2026-2032) | Growth, Share, Consumer Insights, Drivers, Opportunities, Competition, Pricing Analysis, Segments, Restraints, Companies, Competitive, Value, Outlook, Size, Demand, Analysis, Challenges, Strategic Insights, Investment Trends, Revenue, Trends, Supply, Forecast
- United Kingdom (UK) Long Term Care Market (2026-2032) | Companies, Outlook, Analysis, Trends, Value, Revenue, Segmentation, Share, Forecast, Competitive Landscape, Growth, Size & Forecast
- Iraq Insulation and Waterproofing Market (2026-2032) | Outlook, Drivers, Growth, Size, Share, Industry, Revenue, Trends, Demand, Competitive, Strategic Insights, Opportunities, Segments, Companies, Challenges, Strategy, Consumer Insights, Analysis, Investment Trends, Value, Segmentation, Forecast, Restraints
- India Switchgear Market Outlook (2026-2032) | Size, Share, Trends, Growth, Revenue, Forecast, Analysis, Value, Outlook
- Pakistan Contraceptive Implants Market (2025-2031) | Demand, Growth, Size, Share, Industry, Pricing Analysis, Competitive, Strategic Insights, Strategy, Consumer Insights, Analysis, Investment Trends, Opportunities, Revenue, Segments, Value, Segmentation, Supply, Forecast, Restraints, Outlook, Competition, Drivers, Trends, Companies, Challenges
- Sri Lanka Packaging Market (2026-2032) | Outlook, Competition, Drivers, Trends, Demand, Pricing Analysis, Competitive, Strategic Insights, Companies, Challenges, Strategy, Consumer Insights, Analysis, Investment Trends, Opportunities, Growth, Size, Share, Industry, Revenue, Segments, Value, Segmentation, Supply, Forecast, Restraints
- India Kids Watches Market (2026-2032) | Strategy, Consumer Insights, Analysis, Investment Trends, Opportunities, Growth, Size, Share, Industry, Revenue, Segments, Value, Segmentation, Supply, Forecast, Restraints, Outlook, Competition, Drivers, Trends, Demand, Pricing Analysis, Competitive, Strategic Insights, Companies, Challenges
- Saudi Arabia Core Assurance Service Market (2025-2031) | Strategy, Consumer Insights, Analysis, Investment Trends, Opportunities, Growth, Size, Share, Industry, Revenue, Segments, Value, Segmentation, Supply, Forecast, Restraints, Outlook, Competition, Drivers, Trends, Demand, Pricing Analysis, Competitive, Strategic Insights, Companies, Challenges
- Romania Uninterruptible Power Supply (UPS) Market (2026-2032) | Industry, Analysis, Revenue, Size, Forecast, Outlook, Value, Trends, Share, Growth & Companies
Industry Events and Analyst Meet

India EV Show 2026

EV tech India Expo 2026

Auto Tech Asia 2026

Battery Tech India 2026

Smart Production Solutions Guangzhou 2026
Whitepaper
- Middle East & Africa Commercial Security Market Click here to view more.
- Middle East & Africa Fire Safety Systems & Equipment Market Click here to view more.
- GCC Drone Market Click here to view more.
- Middle East Lighting Fixture Market Click here to view more.
- GCC Physical & Perimeter Security Market Click here to view more.
6WResearch In News
- Doha a strategic location for EV manufacturing hub: IPA Qatar
- Demand for luxury TVs surging in the GCC, says Samsung
- Empowering Growth: The Thriving Journey of Bangladesh’s Cable Industry
- Demand for luxury TVs surging in the GCC, says Samsung
- Video call with a traditional healer? Once unthinkable, it’s now common in South Africa
- Intelligent Buildings To Smooth GCC’s Path To Net Zero