Estonia LNG Bunkering Market (2025-2031) | Industry, Value, Size, Forecast, Share, Outlook, Revenue, Companies, Analysis, Segmentation, Trends & Growth
Market Forecast By Product Type (Truck-to-Ship, Port-to-Ship, Ship-to-Ship, Portable Tanks), By Application (Container Fleet, Tanker Fleet, Cargo Fleet, Ferries, Inland Vessels, Others) And Competitive Landscape
| Product Code: ETC4823809 | Publication Date: Nov 2023 | Updated Date: Nov 2025 | Product Type: Market Research Report | |
| Publisher: 6Wresearch | Author: Sachin Kumar Rai | No. of Pages: 60 | No. of Figures: 30 | No. of Tables: 5 |
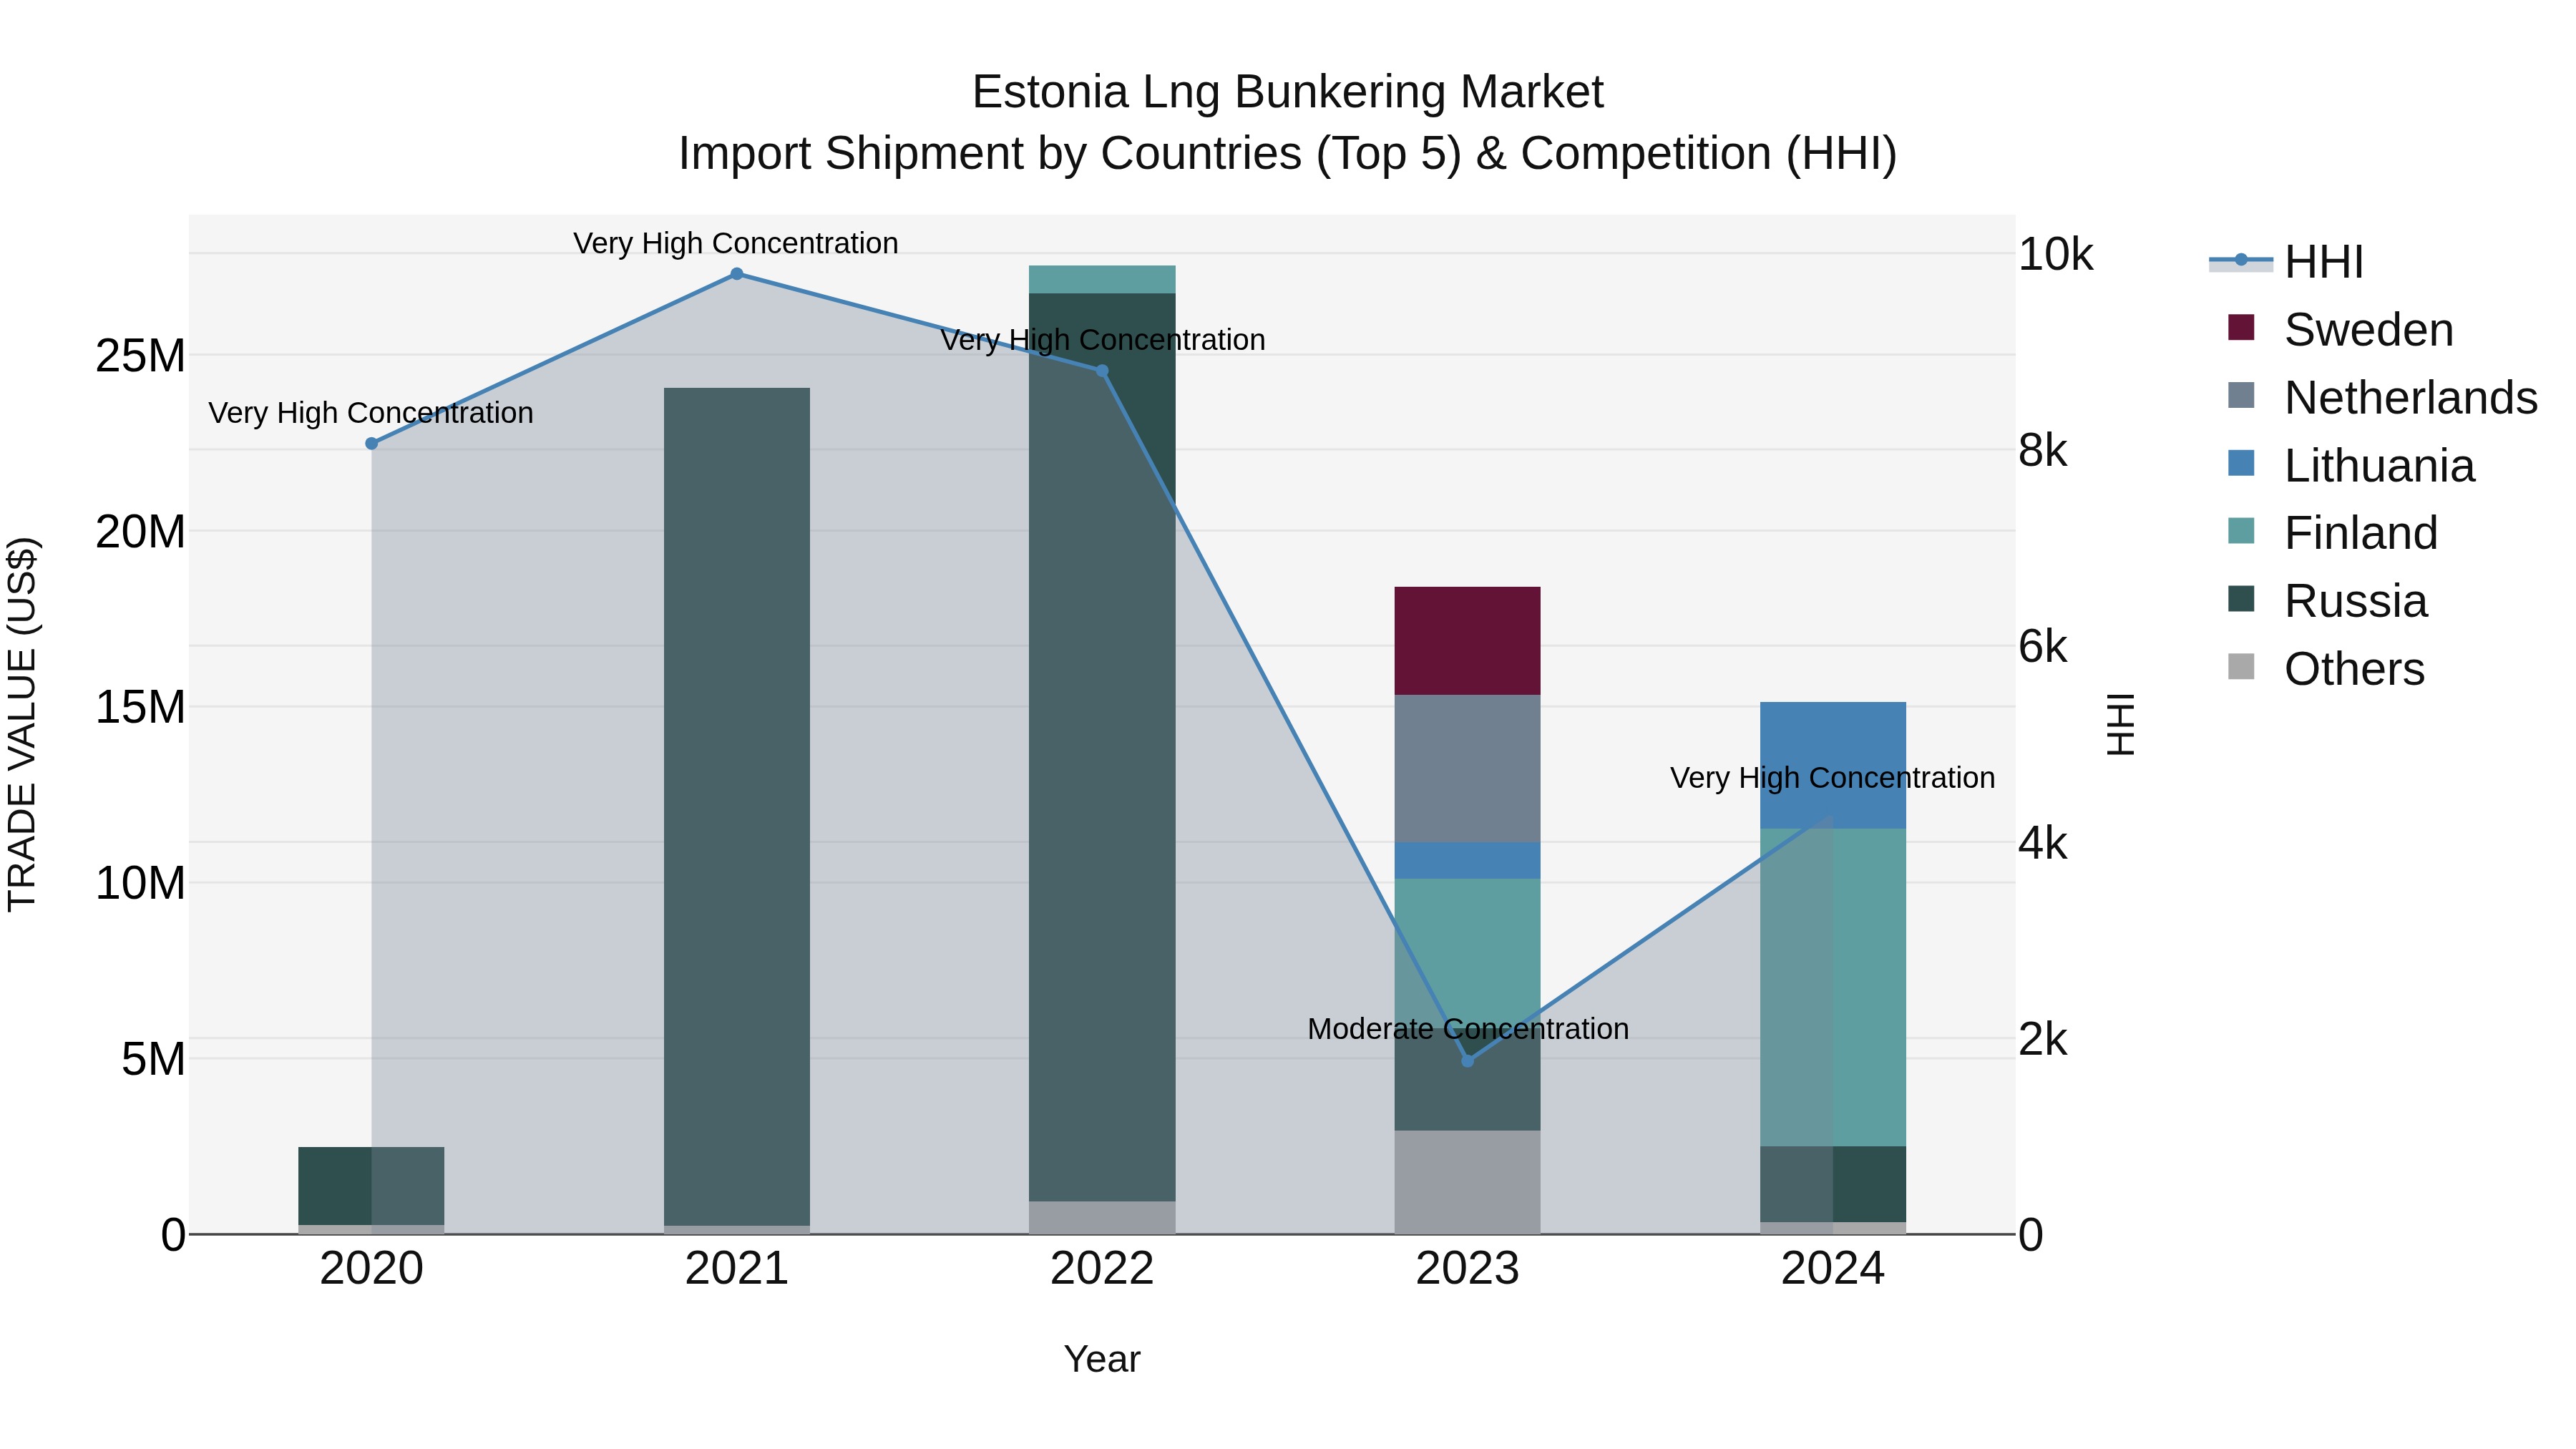
Estonia Lng Bunkering Market Top 5 Importing Countries and Market Competition (HHI) Analysis
The LNG bunkering import shipments to Estonia in 2024 saw a significant increase in concentration, with top exporting countries being Finland, Lithuania, Russia, Latvia, and Germany. The Herfindahl-Hirschman Index (HHI) indicated a shift from moderate to very high concentration from 2023 to 2024, reflecting a consolidating market. Despite the strong compound annual growth rate (CAGR) of 57.03% from 2020 to 2024, there was a slight decline in the growth rate from 2023 to 2024 at -17.78%. This data suggests a dynamic and evolving landscape in LNG bunkering imports to Estonia, driven by key exporting nations.
Estonia LNG Bunkering Market Overview
The LNG bunkering market in Estonia is emerging as a key sector in the regions efforts to reduce emissions from the maritime industry. LNG is seen as a cleaner alternative to traditional marine fuels, and Estonia, with its strategic location in the Baltic Sea, is poised to capitalize on this trend. The growth of LNG bunkering facilities in the region aligns with global efforts to decarbonize maritime transport.
Drivers of the market
Estonias focus on environmental sustainability and reducing carbon emissions is a significant driver of the LNG (liquefied natural gas) bunkering market. With Estonia being a part of the European Union, which promotes the use of cleaner fuels, the demand for LNG as an alternative to traditional marine fuels is increasing. The growing shipping industry, particularly with the Baltic Sea regions emphasis on decarbonizing maritime operations, accelerates the adoption of LNG bunkering services in Estonia. Additionally, the development of LNG infrastructure and port facilities in Estonia further supports the growth of this market.
Challenges of the market
The Estonia LNG Bunkering Market faces challenges related to the infrastructure required for the storage, transportation, and distribution of liquefied natural gas (LNG) for marine vessels. Developing LNG bunkering facilities and ensuring their efficiency is capital-intensive, requiring substantial investment in both technology and logistics. Additionally, the market must overcome regulatory hurdles related to safety standards, emissions regulations, and the integration of LNG as an alternative marine fuel. The volatility of natural gas prices and competition from other alternative fuels, such as hydrogen and ammonia, also add uncertainty to the markets growth trajectory.
Government Policy of the market
The Estonian government actively supports the LNG bunkering market to reduce maritime emissions. Policies include investment in LNG infrastructure at ports and incentives for shipping companies transitioning to cleaner fuels, in line with EU decarbonization goals.
Key Highlights of the Report:
- Estonia LNG Bunkering Market Outlook
- Market Size of Estonia LNG Bunkering Market, 2024
- Forecast of Estonia LNG Bunkering Market, 2031
- Historical Data and Forecast of Estonia LNG Bunkering Revenues & Volume for the Period 2021-2031
- Estonia LNG Bunkering Market Trend Evolution
- Estonia LNG Bunkering Market Drivers and Challenges
- Estonia LNG Bunkering Price Trends
- Estonia LNG Bunkering Porter`s Five Forces
- Estonia LNG Bunkering Industry Life Cycle
- Historical Data and Forecast of Estonia LNG Bunkering Market Revenues & Volume By Product Type for the Period 2021-2031
- Historical Data and Forecast of Estonia LNG Bunkering Market Revenues & Volume By Truck-to-Ship for the Period 2021-2031
- Historical Data and Forecast of Estonia LNG Bunkering Market Revenues & Volume By Port-to-Ship for the Period 2021-2031
- Historical Data and Forecast of Estonia LNG Bunkering Market Revenues & Volume By Ship-to-Ship for the Period 2021-2031
- Historical Data and Forecast of Estonia LNG Bunkering Market Revenues & Volume By Portable Tanks for the Period 2021-2031
- Historical Data and Forecast of Estonia LNG Bunkering Market Revenues & Volume By Application for the Period 2021-2031
- Historical Data and Forecast of Estonia LNG Bunkering Market Revenues & Volume By Container Fleet for the Period 2021-2031
- Historical Data and Forecast of Estonia LNG Bunkering Market Revenues & Volume By Tanker Fleet for the Period 2021-2031
- Historical Data and Forecast of Estonia LNG Bunkering Market Revenues & Volume By Cargo Fleet for the Period 2021-2031
- Historical Data and Forecast of Estonia LNG Bunkering Market Revenues & Volume By Ferries for the Period 2021-2031
- Historical Data and Forecast of Estonia LNG Bunkering Market Revenues & Volume By Inland Vessels for the Period 2021-2031
- Historical Data and Forecast of Estonia LNG Bunkering Market Revenues & Volume By Others for the Period 2021-2031
- Estonia LNG Bunkering Import Export Trade Statistics
- Market Opportunity Assessment By Product Type
- Market Opportunity Assessment By Application
- Estonia LNG Bunkering Top Companies Market Share
- Estonia LNG Bunkering Competitive Benchmarking By Technical and Operational Parameters
- Estonia LNG Bunkering Company Profiles
- Estonia LNG Bunkering Key Strategic Recommendations
Frequently Asked Questions About the Market Study (FAQs):
6Wresearch actively monitors the Estonia LNG Bunkering Market and publishes its comprehensive annual report, highlighting emerging trends, growth drivers, revenue analysis, and forecast outlook. Our insights help businesses to make data-backed strategic decisions with ongoing market dynamics. Our analysts track relevent industries related to the Estonia LNG Bunkering Market, allowing our clients with actionable intelligence and reliable forecasts tailored to emerging regional needs.
Yes, we provide customisation as per your requirements. To learn more, feel free to contact us on sales@6wresearch.com
1 Executive Summary |
2 Introduction |
2.1 Key Highlights of the Report |
2.2 Report Description |
2.3 Market Scope & Segmentation |
2.4 Research Methodology |
2.5 Assumptions |
3 Estonia LNG Bunkering Market Overview |
3.1 Estonia Country Macro Economic Indicators |
3.2 Estonia LNG Bunkering Market Revenues & Volume, 2021 & 2031F |
3.3 Estonia LNG Bunkering Market - Industry Life Cycle |
3.4 Estonia LNG Bunkering Market - Porter's Five Forces |
3.5 Estonia LNG Bunkering Market Revenues & Volume Share, By Product Type, 2021 & 2031F |
3.6 Estonia LNG Bunkering Market Revenues & Volume Share, By Application, 2021 & 2031F |
4 Estonia LNG Bunkering Market Dynamics |
4.1 Impact Analysis |
4.2 Market Drivers |
4.3 Market Restraints |
5 Estonia LNG Bunkering Market Trends |
6 Estonia LNG Bunkering Market Segmentations |
6.1 Estonia LNG Bunkering Market, By Product Type |
6.1.1 Overview and Analysis |
6.1.2 Estonia LNG Bunkering Market Revenues & Volume, By Truck-to-Ship, 2021-2031F |
6.1.3 Estonia LNG Bunkering Market Revenues & Volume, By Port-to-Ship, 2021-2031F |
6.1.4 Estonia LNG Bunkering Market Revenues & Volume, By Ship-to-Ship, 2021-2031F | 6.1.6 Estonia LNG Bunkering Market Revenues & Volume, By Portable Tanks, 2021-2031F |
6.2 Estonia LNG Bunkering Market, By Application |
6.2.1 Overview and Analysis |
6.2.2 Estonia LNG Bunkering Market Revenues & Volume, By Container Fleet, 2021-2031F |
6.2.3 Estonia LNG Bunkering Market Revenues & Volume, By Tanker Fleet, 2021-2031F |
6.2.4 Estonia LNG Bunkering Market Revenues & Volume, By Cargo Fleet, 2021-2031F |
6.2.5 Estonia LNG Bunkering Market Revenues & Volume, By Ferries, 2021-2031F |
6.2.6 Estonia LNG Bunkering Market Revenues & Volume, By Inland Vessels, 2021-2031F |
6.2.7 Estonia LNG Bunkering Market Revenues & Volume, By Others, 2021-2031F |
7 Estonia LNG Bunkering Market Import-Export Trade Statistics |
7.1 Estonia LNG Bunkering Market Export to Major Countries |
7.2 Estonia LNG Bunkering Market Imports from Major Countries |
8 Estonia LNG Bunkering Market Key Performance Indicators |
9 Estonia LNG Bunkering Market - Opportunity Assessment |
9.1 Estonia LNG Bunkering Market Opportunity Assessment, By Product Type, 2021 & 2031F |
9.2 Estonia LNG Bunkering Market Opportunity Assessment, By Application, 2021 & 2031F |
10 Estonia LNG Bunkering Market - Competitive Landscape |
10.1 Estonia LNG Bunkering Market Revenue Share, By Companies, 2024 |
10.2 Estonia LNG Bunkering Market Competitive Benchmarking, By Operating and Technical Parameters |
11 Company Profiles |
12 Recommendations | 13 Disclaimer |
Export potential assessment - trade Analytics for 2030
Export potential enables firms to identify high-growth global markets with greater confidence by combining advanced trade intelligence with a structured quantitative methodology. The framework analyzes emerging demand trends and country-level import patterns while integrating macroeconomic and trade datasets such as GDP and population forecasts, bilateral import–export flows, tariff structures, elasticity differentials between developed and developing economies, geographic distance, and import demand projections. Using weighted trade values from 2020–2024 as the base period to project country-to-country export potential for 2030, these inputs are operationalized through calculated drivers such as gravity model parameters, tariff impact factors, and projected GDP per-capita growth. Through an analysis of hidden potentials, demand hotspots, and market conditions that are most favorable to success, this method enables firms to focus on target countries, maximize returns, and global expansion with data, backed by accuracy.
By factoring in the projected importer demand gap that is currently unmet and could be potential opportunity, it identifies the potential for the Exporter (Country) among 190 countries, against the general trade analysis, which identifies the biggest importer or exporter.
To discover high-growth global markets and optimize your business strategy:
Click Here
Pricing
- Single User License$ 1,995
- Department License$ 2,400
- Site License$ 3,120
- Global License$ 3,795

Search
Thought Leadership and Analyst Meet


Our Clients
Related Reports
- India Switchgear Market Outlook (2026 - 2032) | Size, Share, Trends, Growth, Revenue, Forecast, Analysis, Value, Outlook
- Pakistan Contraceptive Implants Market (2025-2031) | Demand, Growth, Size, Share, Industry, Pricing Analysis, Competitive, Strategic Insights, Strategy, Consumer Insights, Analysis, Investment Trends, Opportunities, Revenue, Segments, Value, Segmentation, Supply, Forecast, Restraints, Outlook, Competition, Drivers, Trends, Companies, Challenges
- Sri Lanka Packaging Market (2026-2032) | Outlook, Competition, Drivers, Trends, Demand, Pricing Analysis, Competitive, Strategic Insights, Companies, Challenges, Strategy, Consumer Insights, Analysis, Investment Trends, Opportunities, Growth, Size, Share, Industry, Revenue, Segments, Value, Segmentation, Supply, Forecast, Restraints
- India Kids Watches Market (2026-2032) | Strategy, Consumer Insights, Analysis, Investment Trends, Opportunities, Growth, Size, Share, Industry, Revenue, Segments, Value, Segmentation, Supply, Forecast, Restraints, Outlook, Competition, Drivers, Trends, Demand, Pricing Analysis, Competitive, Strategic Insights, Companies, Challenges
- Saudi Arabia Core Assurance Service Market (2025-2031) | Strategy, Consumer Insights, Analysis, Investment Trends, Opportunities, Growth, Size, Share, Industry, Revenue, Segments, Value, Segmentation, Supply, Forecast, Restraints, Outlook, Competition, Drivers, Trends, Demand, Pricing Analysis, Competitive, Strategic Insights, Companies, Challenges
- Romania Uninterruptible Power Supply (UPS) Market (2026-2032) | Industry, Analysis, Revenue, Size, Forecast, Outlook, Value, Trends, Share, Growth & Companies
- Saudi Arabia Car Window Tinting Film, Paint Protection Film (PPF), and Ceramic Coating Market (2025-2031) | Strategy, Consumer Insights, Analysis, Investment Trends, Opportunities, Growth, Size, Share, Industry, Revenue, Segments, Value, Segmentation, Supply, Forecast, Restraints, Outlook, Competition, Drivers, Trends, Demand, Pricing Analysis, Competitive, Strategic Insights, Companies, Challenges
- South Africa Stationery Market (2025-2031) | Share, Size, Industry, Value, Growth, Revenue, Analysis, Trends, Segmentation & Outlook
- Afghanistan Rocking Chairs And Adirondack Chairs Market (2026-2032) | Size & Revenue, Competitive Landscape, Share, Segmentation, Industry, Value, Outlook, Analysis, Trends, Growth, Forecast, Companies
- Afghanistan Apparel Market (2026-2032) | Growth, Outlook, Industry, Segmentation, Forecast, Size, Companies, Trends, Value, Share, Analysis & Revenue
Industry Events and Analyst Meet

India EV Show 2026

EV tech India Expo 2026

Auto Tech Asia 2026

Battery Tech India 2026

Smart Production Solutions Guangzhou 2026
Whitepaper
- Middle East & Africa Commercial Security Market Click here to view more.
- Middle East & Africa Fire Safety Systems & Equipment Market Click here to view more.
- GCC Drone Market Click here to view more.
- Middle East Lighting Fixture Market Click here to view more.
- GCC Physical & Perimeter Security Market Click here to view more.
6WResearch In News
- Doha a strategic location for EV manufacturing hub: IPA Qatar
- Demand for luxury TVs surging in the GCC, says Samsung
- Empowering Growth: The Thriving Journey of Bangladesh’s Cable Industry
- Demand for luxury TVs surging in the GCC, says Samsung
- Video call with a traditional healer? Once unthinkable, it’s now common in South Africa
- Intelligent Buildings To Smooth GCC’s Path To Net Zero