Estonia Manhole Cover Market (2026-2032) | Drivers, Demand, Segments, Investment Trends, Analysis, Strategic Insights, Forecast, Pricing Analysis, Outlook, Restraints, Companies, Revenue, Growth, Consumer Insights, Industry, Strategy, Share, Supply, Challenges, Competition, Opportunities, Segmentation, Trends, Value, Size, Competitive
Market Forecast By Type (Cast Iron Cover, Composite Cover, Concrete Cover), By Application (Drainage Systems, Utility Access, Sewer Systems), By End User (Municipal Corporations, Construction Industry, Infrastructure Projects), By Distribution Channel (Direct Sales, Wholesale Suppliers, Online Sales) And Competitive Landscape
| Product Code: ETC12909471 | Publication Date: Apr 2025 | Updated Date: Apr 2026 | Product Type: Market Research Report | |
| Publisher: 6Wresearch | Author: Sachin Kumar Rai | No. of Pages: 65 | No. of Figures: 34 | No. of Tables: 19 |
Estonia Manhole Cover Market Size (2020-2030)
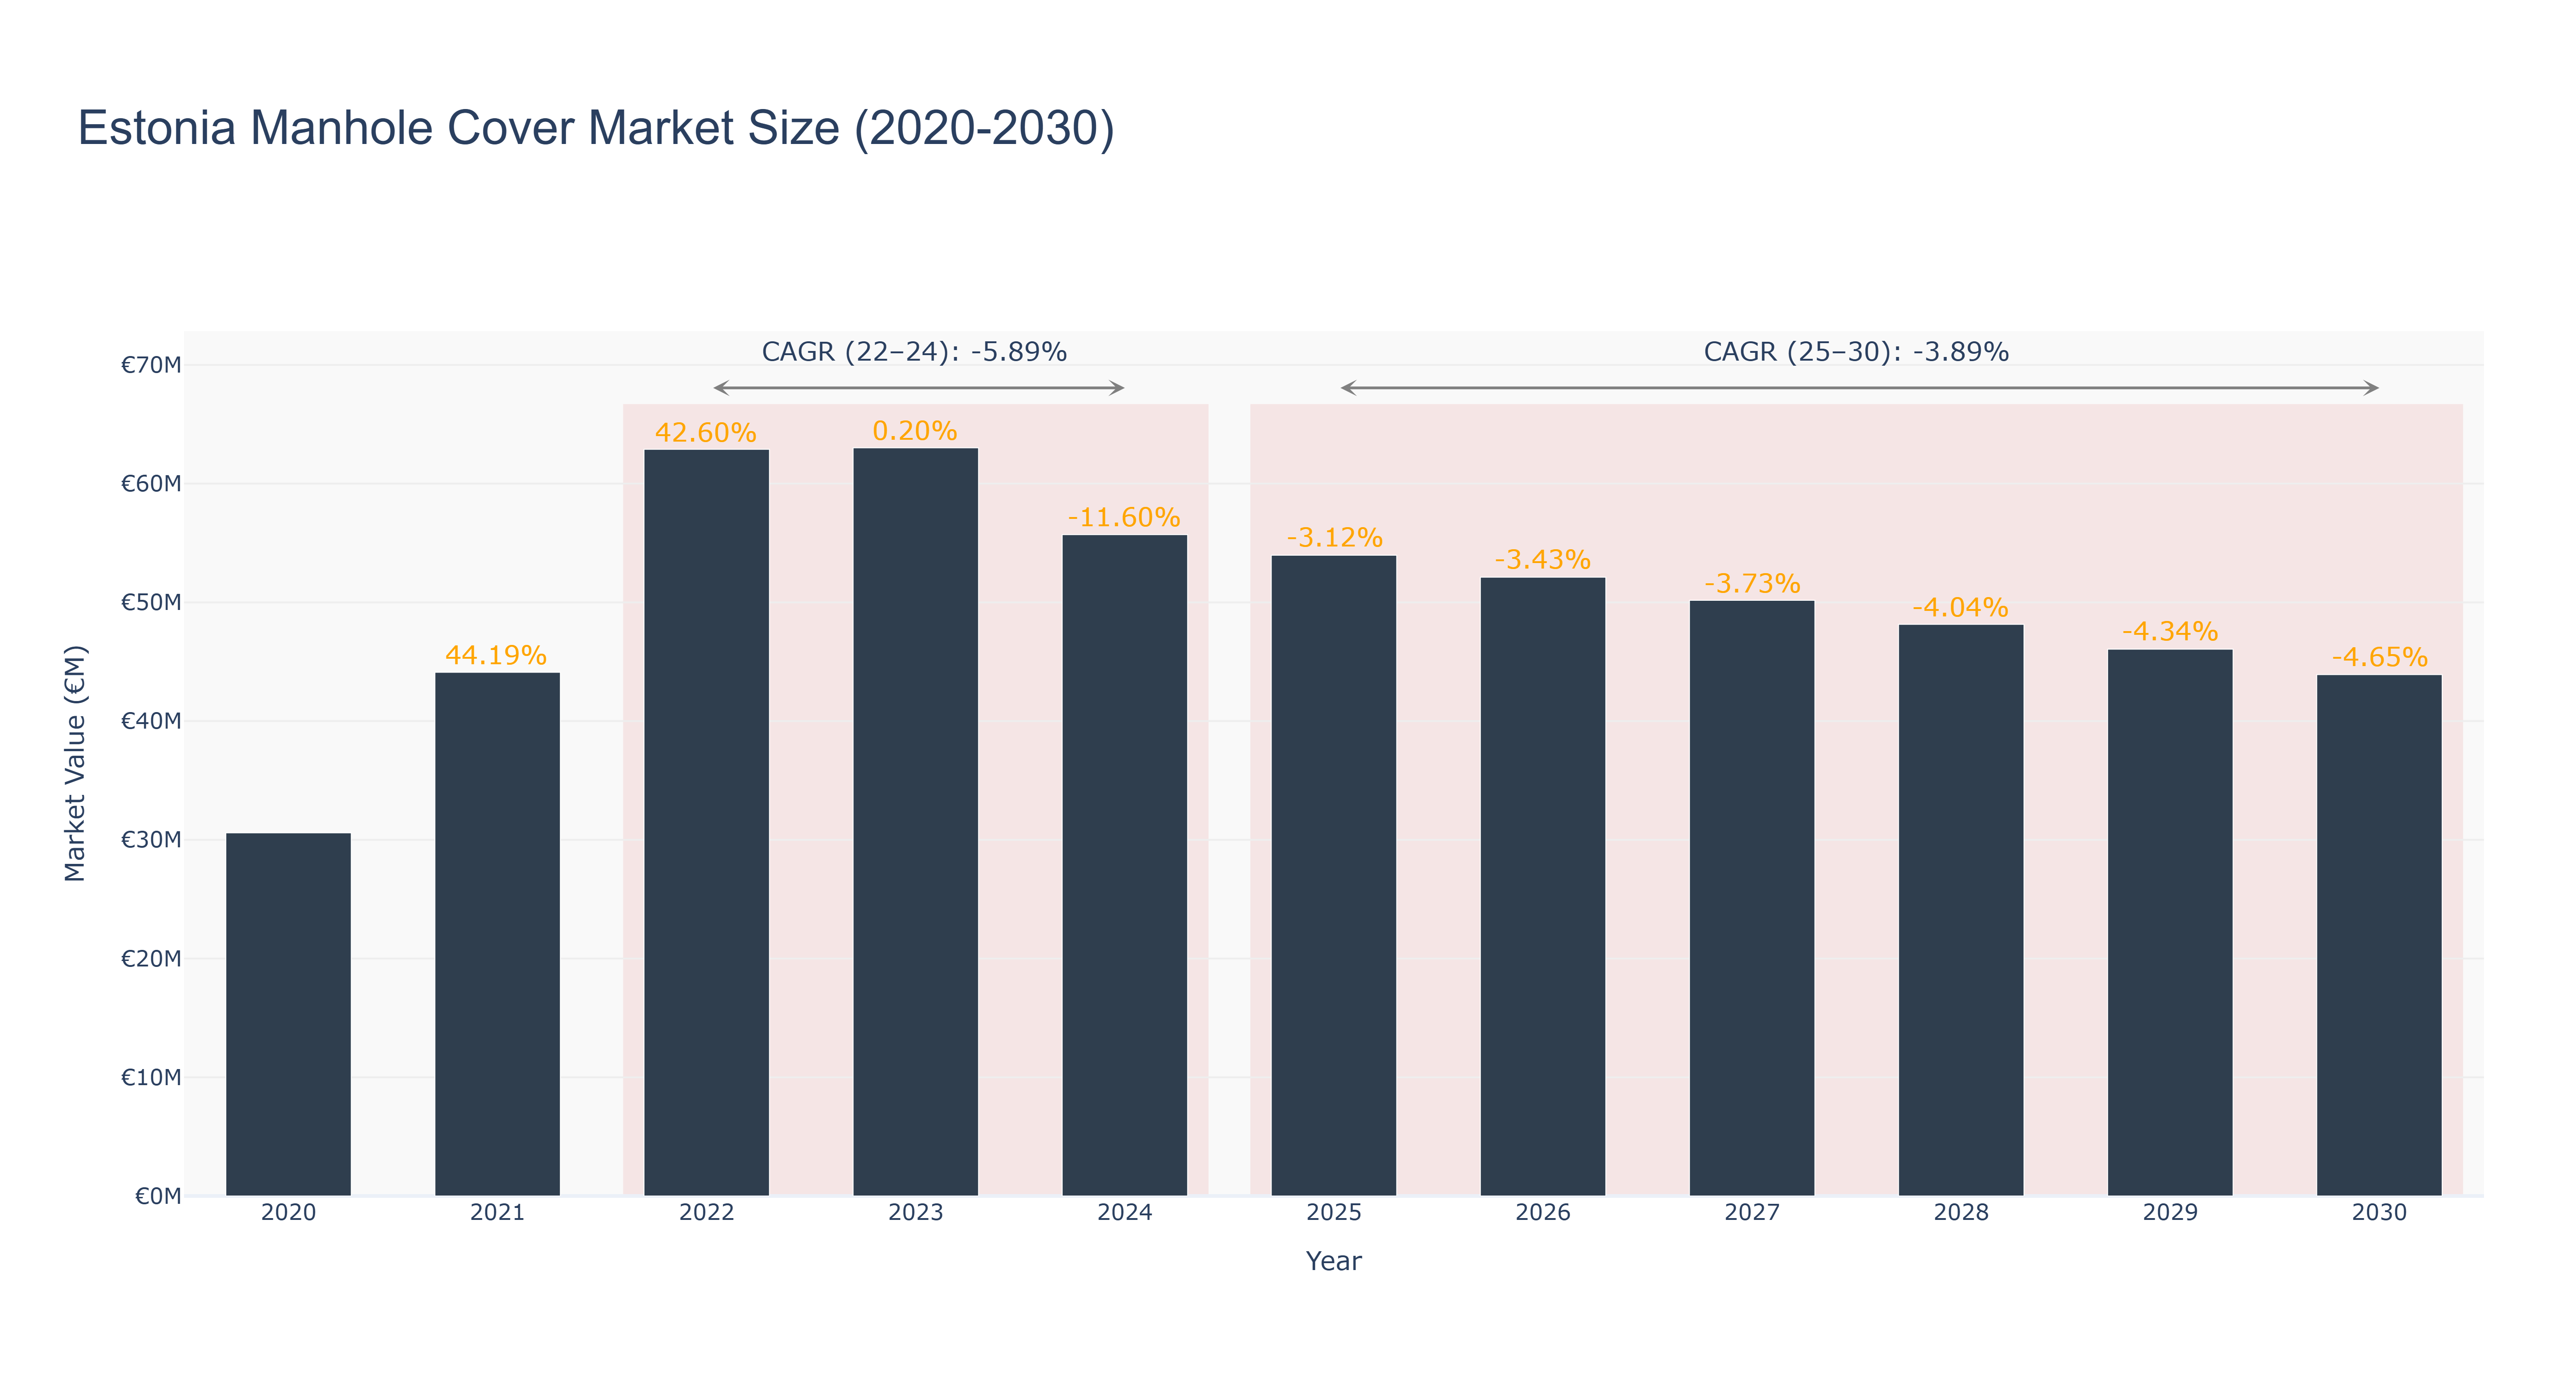
The Estonia Manhole Cover Market experienced significant growth from 2020 to 2022, with the market size peaking at €62.89 million in 2022, driven by increased urban infrastructure investments and a heightened focus on public safety. However, this growth trajectory shifted dramatically in 2023, with only a marginal increase to €63.02 million, followed by a sharp decline to €55.70 million in 2024, reflecting a negative compound annual growth rate (CAGR) of -5.89% for the actual 2022-2024 period. Looking ahead, the forecasted market sizes are projected to continue this downward trend, with estimates showing a decline to €43.91 million by 2030, resulting in a CAGR of -3.89% for the 2025-2030 period. The long-term outlook suggests that reduced public spending and a slowdown in new construction projects will further impact demand for manhole covers, unless mitigated by potential urban renewal initiatives or infrastructure upgrades in the coming years.
Estonia Manhole Cover Market: Production & Trade Performance (2019-2025)
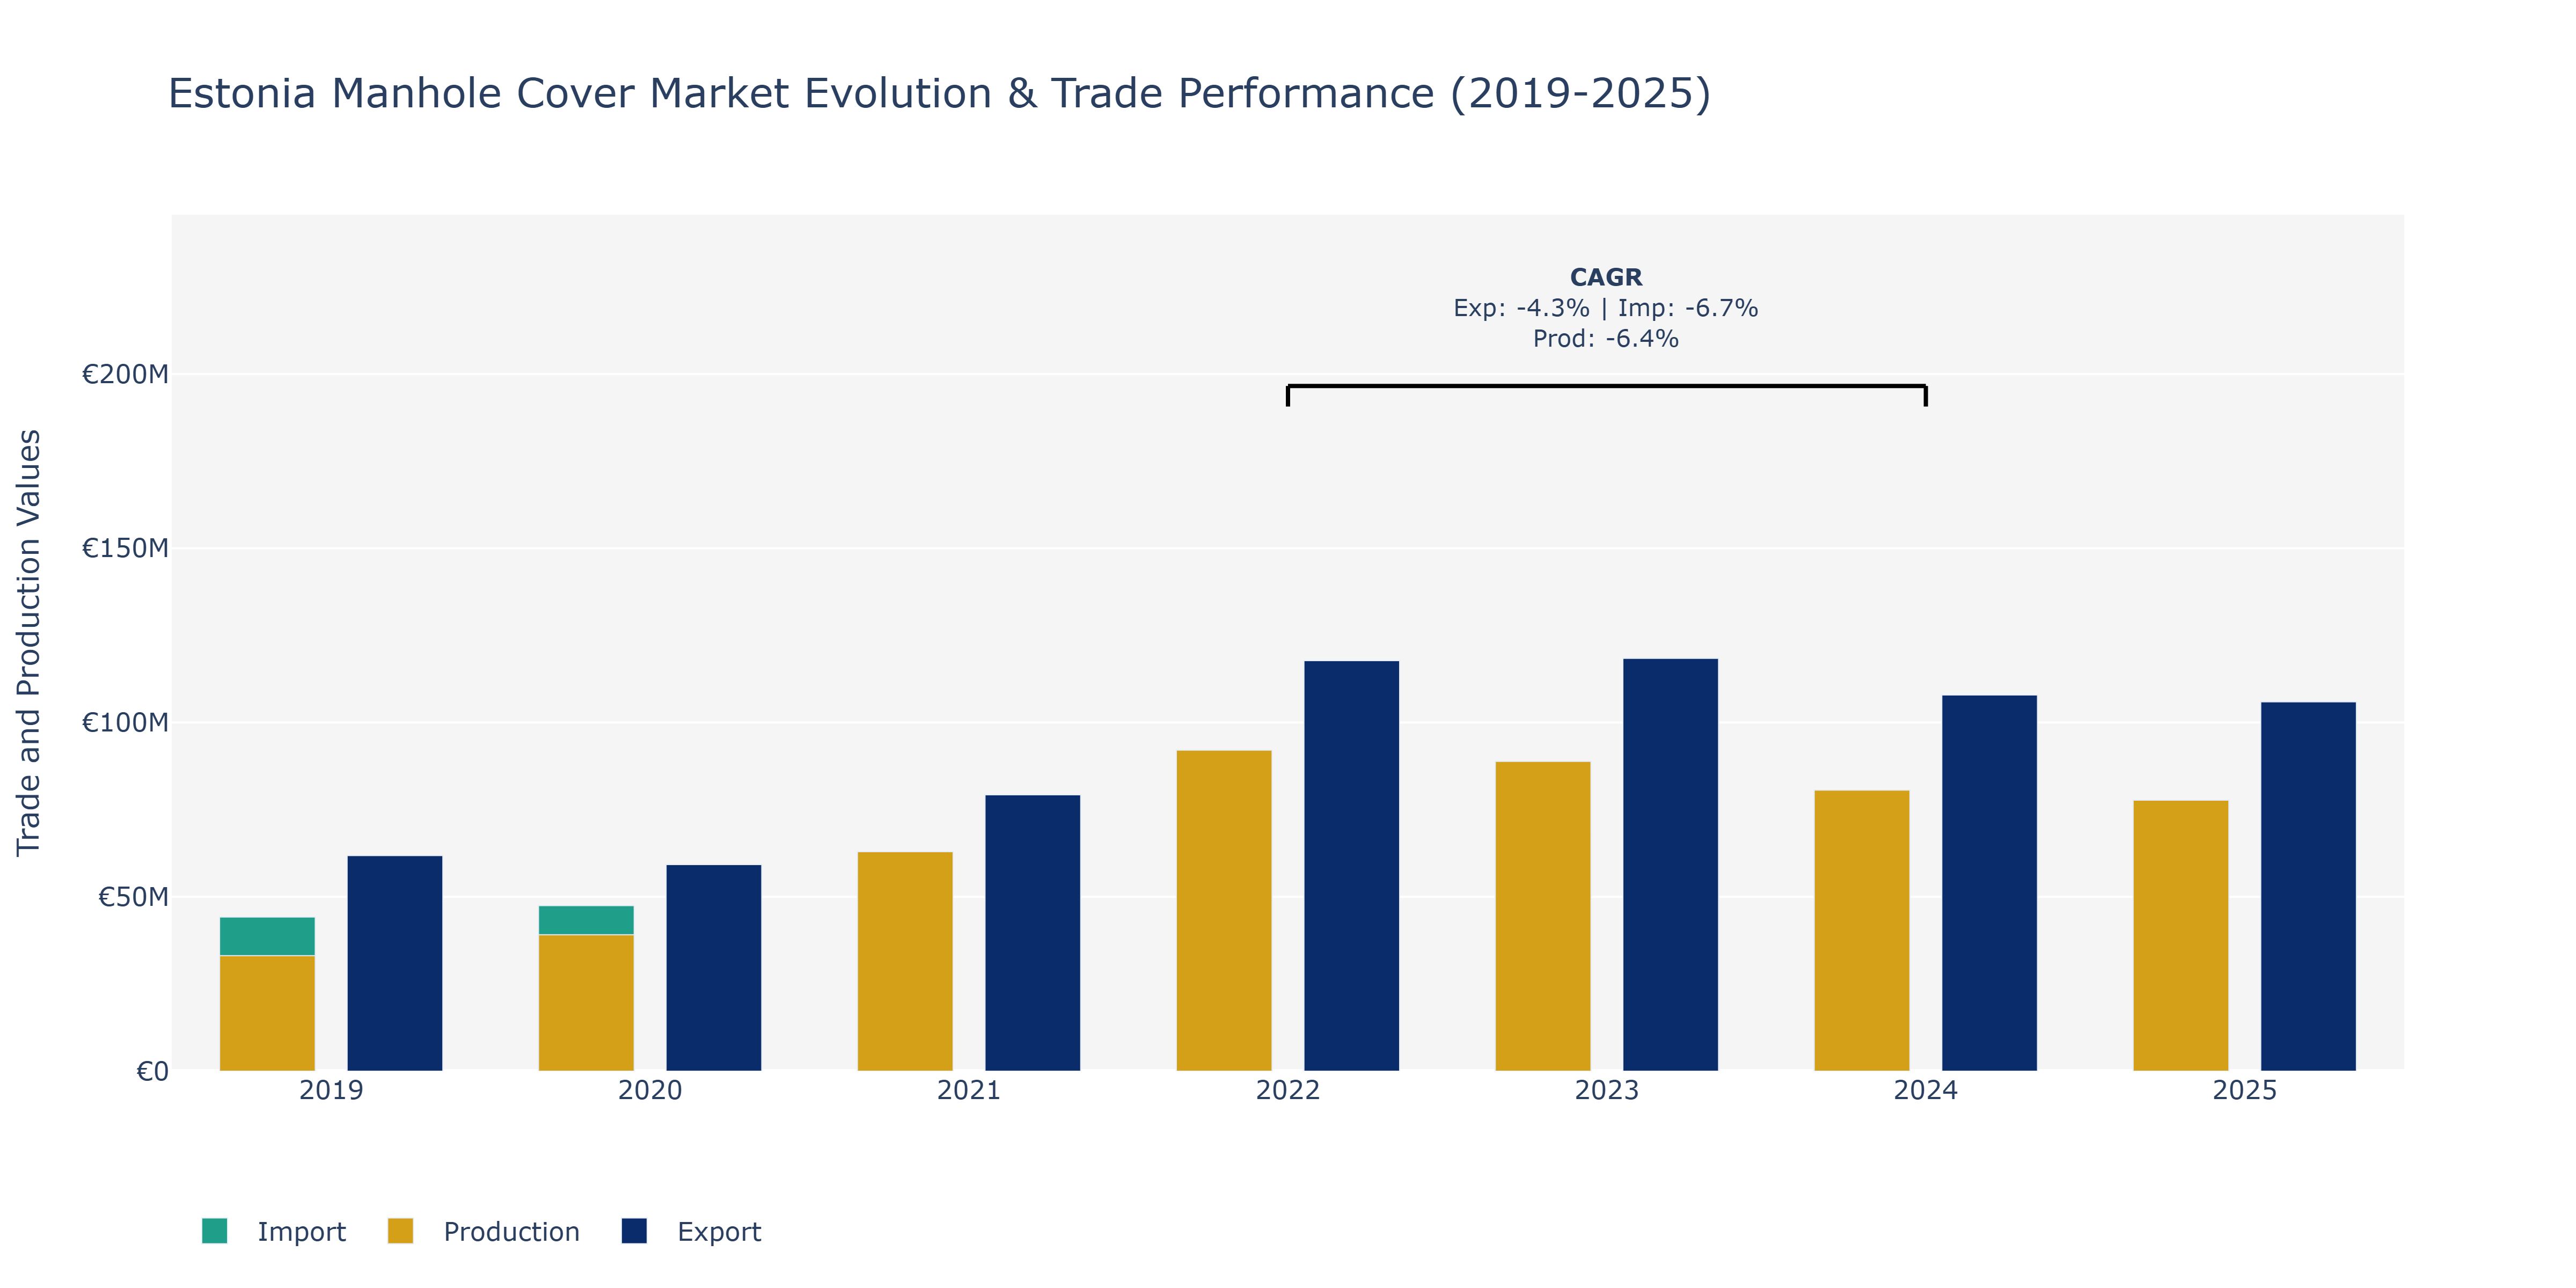
Between 2019 and 2025, the Estonia Manhole Cover Market experienced notable fluctuations in exports, imports, and production. Exports showed a general downward trend, reaching a peak of €118.41 million in 2023 before declining to €105.95 million in 2025. Imports followed a similar pattern, hitting a peak of €83.38 million in 2022 and then decreasing to €69.83 million in 2025. Production levels also peaked in 2022 at €92.11 million before decreasing to €77.74 million in 2025. These fluctuations could be attributed to various factors such as changes in global demand for construction materials, economic conditions affecting infrastructure development projects, and shifts in competition within the market. The declining production and trade figures may also reflect challenges faced by the industry in adapting to evolving regulations or technological advancements aimed at improving infrastructure durability and sustainability.
Key Highlights of the Report:
- Estonia Manhole Cover Market Outlook
- Market Size of Estonia Manhole Cover Market, 2025
- Forecast of Estonia Manhole Cover Market, 2032
- Historical Data and Forecast of Estonia Manhole Cover Revenues & Volume for the Period 2022 - 2032F
- Estonia Manhole Cover Market Trend Evolution
- Estonia Manhole Cover Market Drivers and Challenges
- Estonia Manhole Cover Price Trends
- Estonia Manhole Cover Porter's Five Forces
- Estonia Manhole Cover Industry Life Cycle
- Historical Data and Forecast of Estonia Manhole Cover Market Revenues & Volume By Type for the Period 2022 - 2032F
- Historical Data and Forecast of Estonia Manhole Cover Market Revenues & Volume By Cast Iron Cover for the Period 2022 - 2032F
- Historical Data and Forecast of Estonia Manhole Cover Market Revenues & Volume By Composite Cover for the Period 2022 - 2032F
- Historical Data and Forecast of Estonia Manhole Cover Market Revenues & Volume By Concrete Cover for the Period 2022 - 2032F
- Historical Data and Forecast of Estonia Manhole Cover Market Revenues & Volume By Application for the Period 2022 - 2032F
- Historical Data and Forecast of Estonia Manhole Cover Market Revenues & Volume By Drainage Systems for the Period 2022 - 2032F
- Historical Data and Forecast of Estonia Manhole Cover Market Revenues & Volume By Utility Access for the Period 2022 - 2032F
- Historical Data and Forecast of Estonia Manhole Cover Market Revenues & Volume By Sewer Systems for the Period 2022 - 2032F
- Historical Data and Forecast of Estonia Manhole Cover Market Revenues & Volume By End User for the Period 2022 - 2032F
- Historical Data and Forecast of Estonia Manhole Cover Market Revenues & Volume By Municipal Corporations for the Period 2022 - 2032F
- Historical Data and Forecast of Estonia Manhole Cover Market Revenues & Volume By Construction Industry for the Period 2022 - 2032F
- Historical Data and Forecast of Estonia Manhole Cover Market Revenues & Volume By Infrastructure Projects for the Period 2022 - 2032F
- Historical Data and Forecast of Estonia Manhole Cover Market Revenues & Volume By Distribution Channel for the Period 2022 - 2032F
- Historical Data and Forecast of Estonia Manhole Cover Market Revenues & Volume By Direct Sales for the Period 2022 - 2032F
- Historical Data and Forecast of Estonia Manhole Cover Market Revenues & Volume By Wholesale Suppliers for the Period 2022 - 2032F
- Historical Data and Forecast of Estonia Manhole Cover Market Revenues & Volume By Online Sales for the Period 2022 - 2032F
- Estonia Manhole Cover Import Export Trade Statistics
- Market Opportunity Assessment By Type
- Market Opportunity Assessment By Application
- Market Opportunity Assessment By End User
- Market Opportunity Assessment By Distribution Channel
- Estonia Manhole Cover Top Companies Market Share
- Estonia Manhole Cover Competitive Benchmarking By Technical and Operational Parameters
- Estonia Manhole Cover Company Profiles
- Estonia Manhole Cover Key Strategic Recommendations
Frequently Asked Questions About the Market Study (FAQs):
6Wresearch actively monitors the Estonia Manhole Cover Market and publishes its comprehensive annual report, highlighting emerging trends, growth drivers, revenue analysis, and forecast outlook. Our insights help businesses to make data-backed strategic decisions with ongoing market dynamics. Our analysts track relevent industries related to the Estonia Manhole Cover Market, allowing our clients with actionable intelligence and reliable forecasts tailored to emerging regional needs.
Yes, we provide customisation as per your requirements. To learn more, feel free to contact us on sales@6wresearch.com
1 Executive Summary |
2 Introduction |
2.1 Key Highlights of the Report |
2.2 Report Description |
2.3 Market Scope & Segmentation |
2.4 Research Methodology |
2.5 Assumptions |
3 Estonia Manhole Cover Market Overview |
3.1 Estonia Country Macro Economic Indicators |
3.2 Estonia Manhole Cover Market Revenues & Volume, 2022 & 2032F |
3.3 Estonia Manhole Cover Market - Industry Life Cycle |
3.4 Estonia Manhole Cover Market - Porter's Five Forces |
3.5 Estonia Manhole Cover Market Revenues & Volume Share, By Type, 2022 & 2032F |
3.6 Estonia Manhole Cover Market Revenues & Volume Share, By Application, 2022 & 2032F |
3.7 Estonia Manhole Cover Market Revenues & Volume Share, By End User, 2022 & 2032F |
3.8 Estonia Manhole Cover Market Revenues & Volume Share, By Distribution Channel, 2022 & 2032F |
4 Estonia Manhole Cover Market Dynamics |
4.1 Impact Analysis |
4.2 Market Drivers |
4.2.1 Increasing urban infrastructure development projects in Estonia |
4.2.2 Government initiatives to improve public utilities and sanitation systems |
4.2.3 Growing focus on sustainable and durable infrastructure solutions |
4.3 Market Restraints |
4.3.1 Limited budget allocation for infrastructure projects |
4.3.2 Competition from alternative materials like composite and plastic |
4.3.3 Regulatory challenges related to product standards and specifications |
5 Estonia Manhole Cover Market Trends |
6 Estonia Manhole Cover Market, By Types |
6.1 Estonia Manhole Cover Market, By Type |
6.1.1 Overview and Analysis |
6.1.2 Estonia Manhole Cover Market Revenues & Volume, By Type, 2022 - 2032F |
6.1.3 Estonia Manhole Cover Market Revenues & Volume, By Cast Iron Cover, 2022 - 2032F |
6.1.4 Estonia Manhole Cover Market Revenues & Volume, By Composite Cover, 2022 - 2032F |
6.1.5 Estonia Manhole Cover Market Revenues & Volume, By Concrete Cover, 2022 - 2032F |
6.2 Estonia Manhole Cover Market, By Application |
6.2.1 Overview and Analysis |
6.2.2 Estonia Manhole Cover Market Revenues & Volume, By Drainage Systems, 2022 - 2032F |
6.2.3 Estonia Manhole Cover Market Revenues & Volume, By Utility Access, 2022 - 2032F |
6.2.4 Estonia Manhole Cover Market Revenues & Volume, By Sewer Systems, 2022 - 2032F |
6.3 Estonia Manhole Cover Market, By End User |
6.3.1 Overview and Analysis |
6.3.2 Estonia Manhole Cover Market Revenues & Volume, By Municipal Corporations, 2022 - 2032F |
6.3.3 Estonia Manhole Cover Market Revenues & Volume, By Construction Industry, 2022 - 2032F |
6.3.4 Estonia Manhole Cover Market Revenues & Volume, By Infrastructure Projects, 2022 - 2032F |
6.4 Estonia Manhole Cover Market, By Distribution Channel |
6.4.1 Overview and Analysis |
6.4.2 Estonia Manhole Cover Market Revenues & Volume, By Direct Sales, 2022 - 2032F |
6.4.3 Estonia Manhole Cover Market Revenues & Volume, By Wholesale Suppliers, 2022 - 2032F |
6.4.4 Estonia Manhole Cover Market Revenues & Volume, By Online Sales, 2022 - 2032F |
7 Estonia Manhole Cover Market Import-Export Trade Statistics |
7.1 Estonia Manhole Cover Market Export to Major Countries |
7.2 Estonia Manhole Cover Market Imports from Major Countries |
8 Estonia Manhole Cover Market Key Performance Indicators |
8.1 Percentage of infrastructure projects using traditional manhole covers |
8.2 Adoption rate of eco-friendly manhole cover materials |
8.3 Number of new product innovations and technologies introduced to the market |
9 Estonia Manhole Cover Market - Opportunity Assessment |
9.1 Estonia Manhole Cover Market Opportunity Assessment, By Type, 2022 & 2032F |
9.2 Estonia Manhole Cover Market Opportunity Assessment, By Application, 2022 & 2032F |
9.3 Estonia Manhole Cover Market Opportunity Assessment, By End User, 2022 & 2032F |
9.4 Estonia Manhole Cover Market Opportunity Assessment, By Distribution Channel, 2022 & 2032F |
10 Estonia Manhole Cover Market - Competitive Landscape |
10.1 Estonia Manhole Cover Market Revenue Share, By Companies, 2025 |
10.2 Estonia Manhole Cover Market Competitive Benchmarking, By Operating and Technical Parameters |
11 Company Profiles |
12 Recommendations |
13 Disclaimer |
Export potential assessment - trade Analytics for 2030
Export potential enables firms to identify high-growth global markets with greater confidence by combining advanced trade intelligence with a structured quantitative methodology. The framework analyzes emerging demand trends and country-level import patterns while integrating macroeconomic and trade datasets such as GDP and population forecasts, bilateral import–export flows, tariff structures, elasticity differentials between developed and developing economies, geographic distance, and import demand projections. Using weighted trade values from 2020–2024 as the base period to project country-to-country export potential for 2030, these inputs are operationalized through calculated drivers such as gravity model parameters, tariff impact factors, and projected GDP per-capita growth. Through an analysis of hidden potentials, demand hotspots, and market conditions that are most favorable to success, this method enables firms to focus on target countries, maximize returns, and global expansion with data, backed by accuracy.
By factoring in the projected importer demand gap that is currently unmet and could be potential opportunity, it identifies the potential for the Exporter (Country) among 190 countries, against the general trade analysis, which identifies the biggest importer or exporter.
To discover high-growth global markets and optimize your business strategy:
Click Here
Pricing
- Single User License$ 1,995
- Department License$ 2,400
- Site License$ 3,120
- Global License$ 3,795

Search
Thought Leadership and Analyst Meet


Our Clients
Latest Reports
- Philippines Polyhydroxybutyrate-co-Hydroxyvalerate Market (2026-2032) | Trends, Insights, Challenges, Restraints, Competition, Size, Value, Forecast, Pricing, Share, Outlook, Revenue, Investment Opportunities, Strategy, Drivers, Demand, Growth, segmentation, Analysis, Companies
- Peru Polyhydroxybutyrate-co-Hydroxyvalerate Market (2026-2032) | Growth, Demand, Challenges, Share, Trends, Analysis, Pricing, Investment Opportunities, Drivers, Value, Forecast, Competition, Size, Companies, Insights, Outlook, Restraints, segmentation, Revenue, Strategy
- Pakistan Polyhydroxybutyrate-co-Hydroxyvalerate Market (2026-2032) | Restraints, segmentation, Pricing, Forecast, Share, Strategy, Competition, Trends, Insights, Drivers, Challenges, Growth, Revenue, Outlook, Value, Investment Opportunities, Companies, Size, Analysis, Demand
- Oman Polyhydroxybutyrate-co-Hydroxyvalerate Market (2026-2032) | Drivers, segmentation, Insights, Competition, Pricing, Outlook, Size, Revenue, Challenges, Forecast, Analysis, Growth, Value, Share, Trends, Investment Opportunities, Strategy, Restraints, Companies, Demand
- Nigeria Polyhydroxybutyrate-co-Hydroxyvalerate Market (2026-2032) | Value, Investment Opportunities, Analysis, Revenue, Restraints, Pricing, Outlook, Competition, Demand, Growth, Forecast, Companies, Trends, Challenges, segmentation, Drivers, Insights, Share, Size, Strategy
- Nepal Polyhydroxybutyrate-co-Hydroxyvalerate Market (2026-2032) | Insights, Analysis, Drivers, Share, Revenue, Demand, segmentation, Investment Opportunities, Competition, Forecast, Growth, Pricing, Companies, Strategy, Trends, Restraints, Challenges, Outlook, Size, Value
- Myanmar Polyhydroxybutyrate-co-Hydroxyvalerate Market (2026-2032) | Outlook, Revenue, Strategy, Restraints, Drivers, segmentation, Share, Forecast, Competition, Insights, Growth, Pricing, Size, Demand, Value, Companies, Trends, Challenges, Investment Opportunities, Analysis
- Morocco Polyhydroxybutyrate-co-Hydroxyvalerate Market (2026-2032) | Outlook, Investment Opportunities, Restraints, Strategy, Forecast, Challenges, Drivers, Growth, Companies, segmentation, Trends, Size, Competition, Revenue, Demand, Insights, Share, Analysis, Value, Pricing
- Mexico Polyhydroxybutyrate-co-Hydroxyvalerate Market (2026-2032) | Size, Drivers, Outlook, Share, Strategy, Growth, Pricing, Challenges, Companies, Demand, Value, Investment Opportunities, Restraints, Trends, Forecast, segmentation, Analysis, Insights, Competition, Revenue
- Malaysia Polyhydroxybutyrate-co-Hydroxyvalerate Market (2026-2032) | Share, segmentation, Size, Companies, Analysis, Insights, Forecast, Value, Revenue, Drivers, Restraints, Challenges, Investment Opportunities, Trends, Competition, Strategy, Demand, Growth, Outlook, Pricing
Industry Events and Analyst Meet

HIMTEX 2026

India Refining Summit 2026

India EV Show 2026

EV tech India Expo 2026

Auto Tech Asia 2026
Whitepaper
- Middle East & Africa Commercial Security Market Click here to view more.
- Middle East & Africa Fire Safety Systems & Equipment Market Click here to view more.
- GCC Drone Market Click here to view more.
- Middle East Lighting Fixture Market Click here to view more.
- GCC Physical & Perimeter Security Market Click here to view more.
6WResearch In News
- Doha a strategic location for EV manufacturing hub: IPA Qatar
- Demand for luxury TVs surging in the GCC, says Samsung
- Empowering Growth: The Thriving Journey of Bangladesh’s Cable Industry
- Demand for luxury TVs surging in the GCC, says Samsung
- Video call with a traditional healer? Once unthinkable, it’s now common in South Africa
- Intelligent Buildings To Smooth GCC’s Path To Net Zero