Estonia Maple syrup Market (2025-2031) | Revenue, Segmentation, Share, Value, Trends, Industry, Growth, Companies, Outlook, Forecast, Size & Analysis
Market Forecast By Raw Material (Red Maple, Black Maple, Sugar Maple), By Application (Baking Powder, Waffles, Pancakes, French Toast, Oatmeal), By Distribution Channel (Online Stores, Retail Stores, Super/Hypermarket) And Competitive Landscape
| Product Code: ETC4808514 | Publication Date: Nov 2023 | Updated Date: Nov 2025 | Product Type: Market Research Report | |
| Publisher: 6Wresearch | Author: Sachin Kumar Rai | No. of Pages: 60 | No. of Figures: 30 | No. of Tables: 5 |
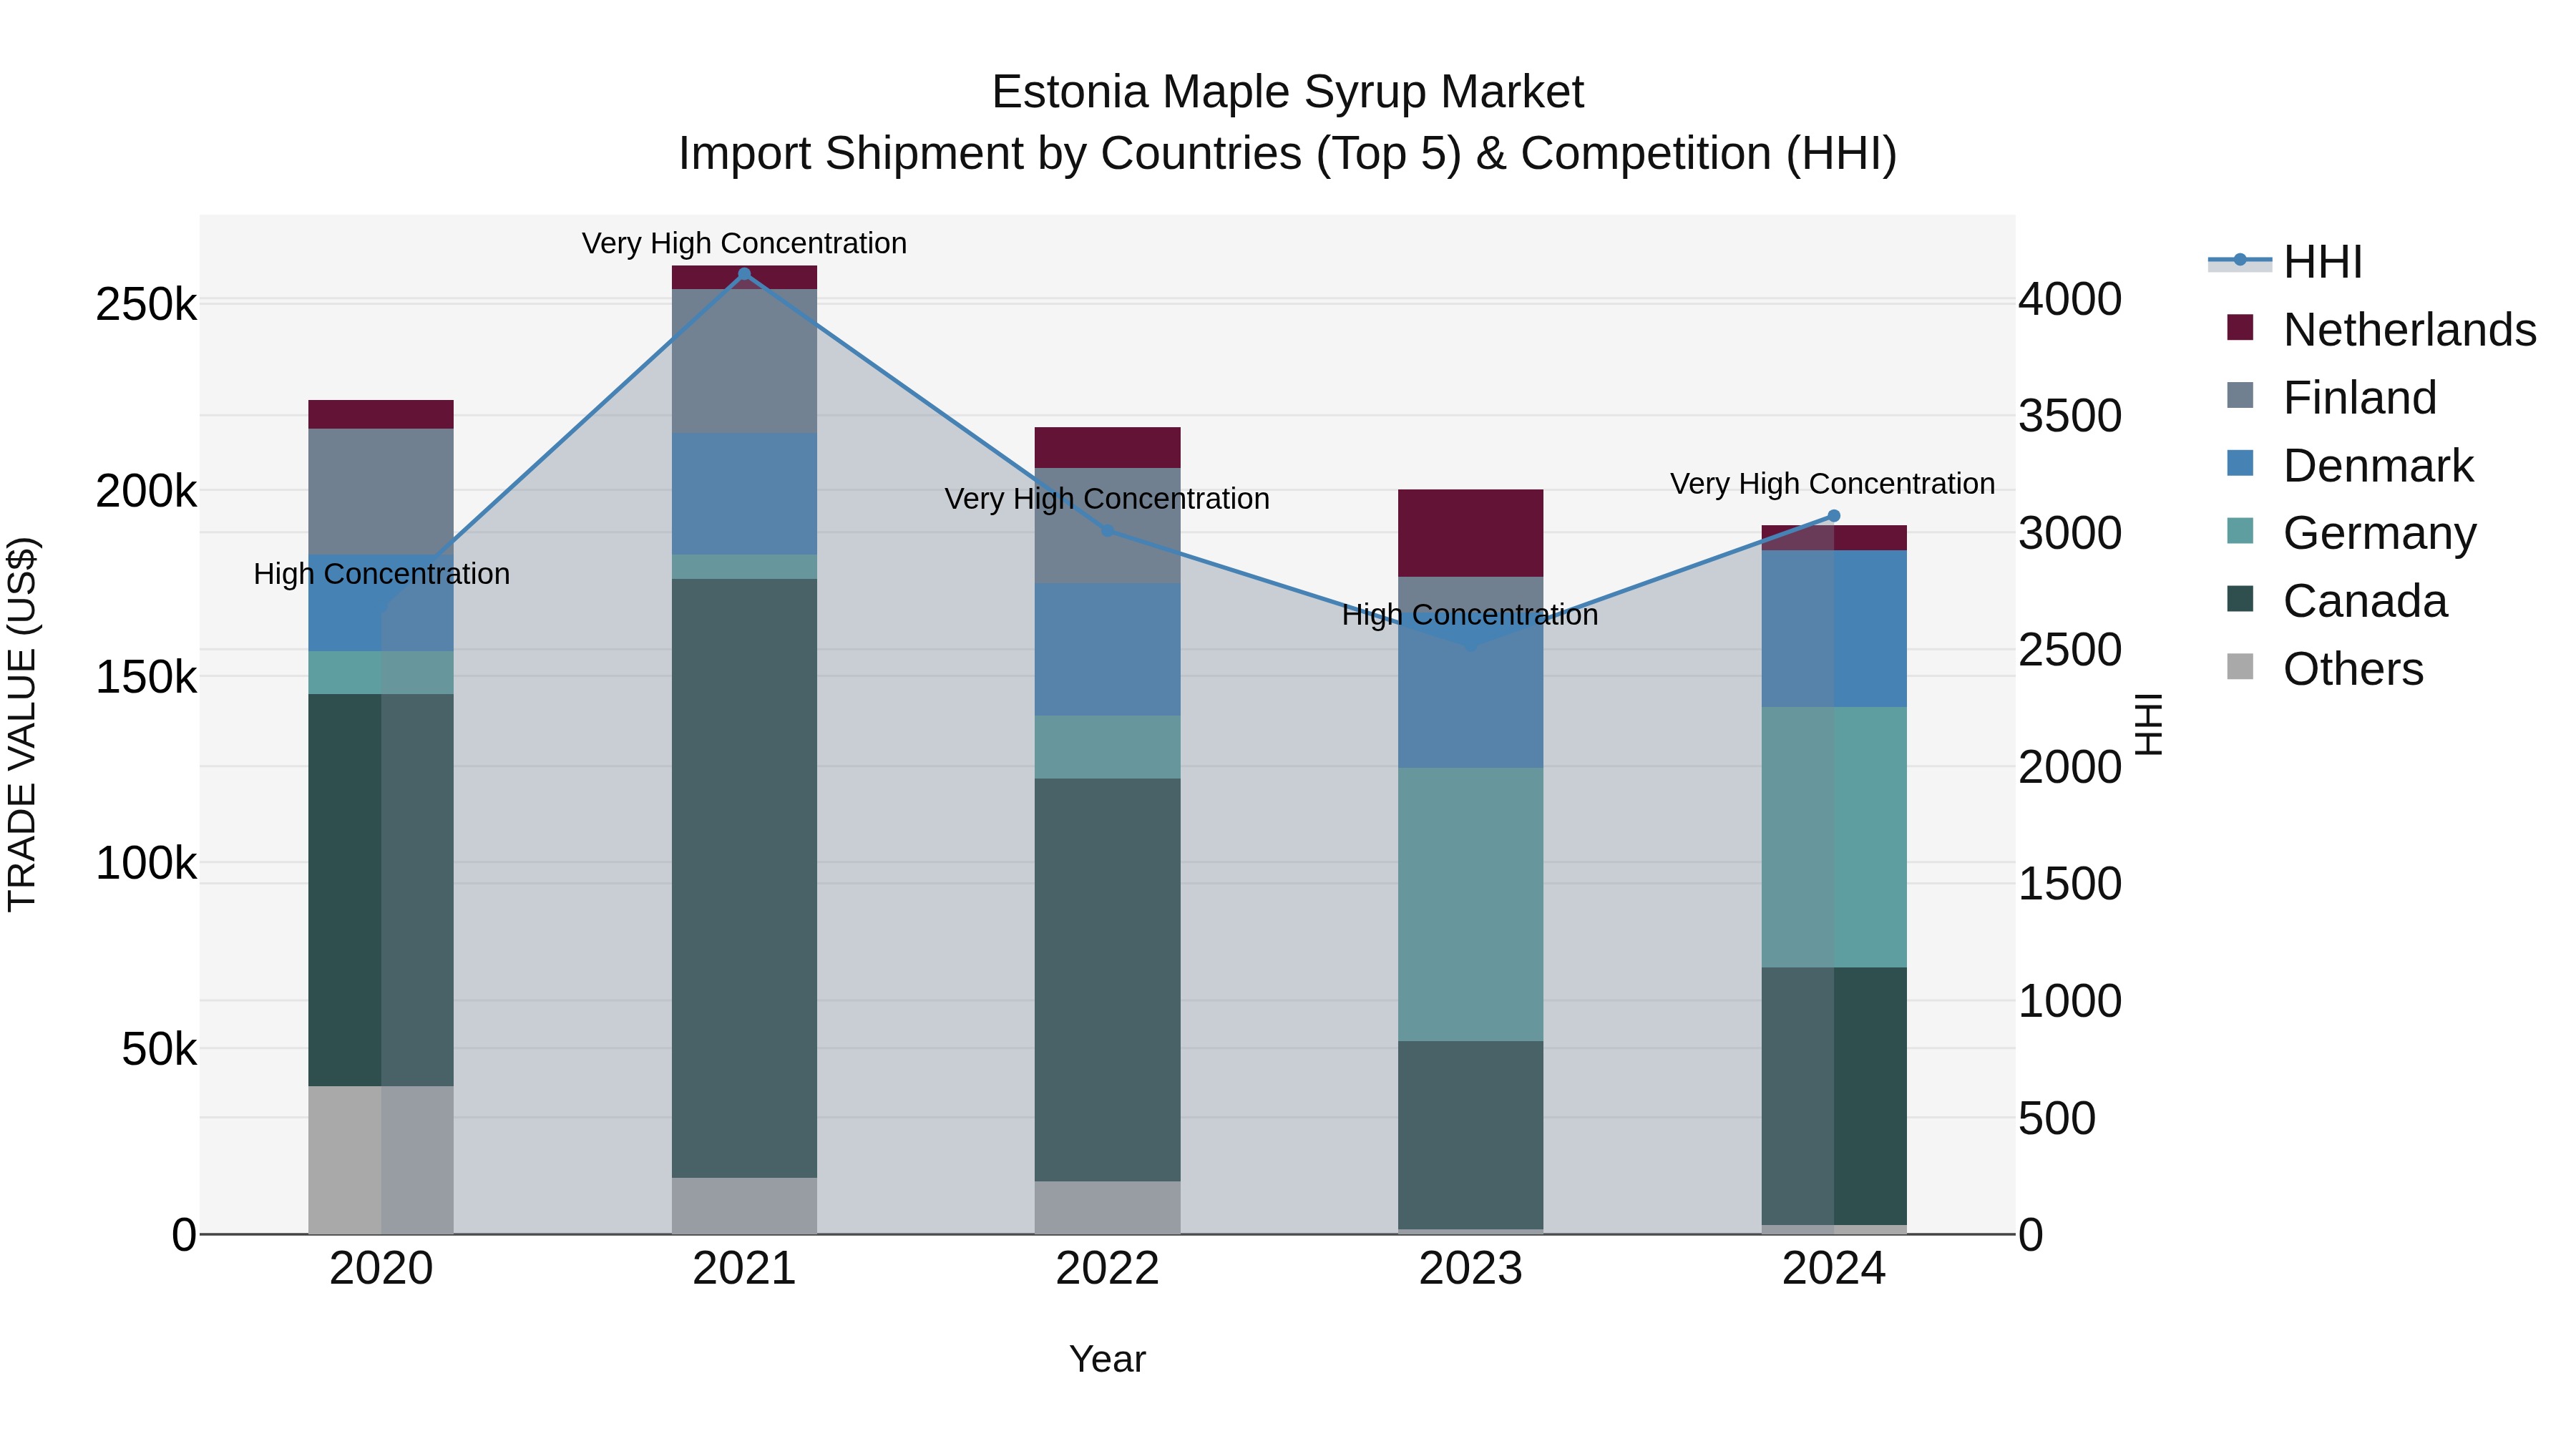
Estonia Maple Syrup Market Top 5 Importing Countries and Market Competition (HHI) Analysis
In 2024, Estonia saw an increase in maple syrup import shipments from top exporting countries such as Germany, Canada, Denmark, Netherlands, and Mexico. The high concentration of Herfindahl-Hirschman Index (HHI) in 2023 escalated to very high concentration in 2024, indicating a more consolidated market. Despite a negative Compound Annual Growth Rate (CAGR) of -3.97% from 2020 to 2024, the growth rate improved slightly in 2024 with a decrease of -4.8% compared to the previous year. This suggests a challenging market environment but also hints at potential stabilization in the future.
Estonia Maple syrup Market Overview
The maple syrup market in Estonia is growing as consumer preferences shift toward natural and organic sweeteners. Maple syrup, known for its rich flavor and health benefits, is increasingly popular as an alternative to refined sugars and artificial sweeteners. While Estonia does not produce maple syrup on a large scale, there is a rising demand for imported maple syrup, particularly in the premium food sector. The market is driven by the health-conscious trend, with consumers seeking out organic and sustainably sourced products. The demand for maple syrup in Estonia is also supported by growing interest in international cuisines and breakfast products.
Drivers of the market
The Estonia maple syrup market is driven by growing consumer interest in natural and organic sweeteners as healthier alternatives to refined sugar. Maple syrup, known for its unique flavor and natural composition, is gaining popularity among consumers who seek authentic, minimally processed food products. As Estonian consumers become more health-conscious and environmentally aware, the demand for organic and sustainably sourced maple syrup rises. Additionally, the expanding culinary use of maple syrup in baking, beverages, and sauces boosts its market growth.
Challenges of the market
The Estonia Maple Syrup Market is faced with challenges related to sourcing and pricing. Maple syrup is not native to Estonia, so there is a reliance on imports, and the supply chain is vulnerable to fluctuations in the production levels from key producing regions like Canada and the U.S. Additionally, there is growing competition from cheaper, artificial syrups, which pressure the market to reduce prices. Moreover, consumer awareness regarding the health benefits of maple syrup versus alternatives remains a challenge in growing demand.
Government Policy of the market
The government encourages the maple syrup market by promoting imports and fostering trade relations with key producers. Policies focus on ensuring product quality and compliance with EU food safety standards to meet consumer demand.
Key Highlights of the Report:
- Estonia Maple syrup Market Outlook
- Market Size of Estonia Maple syrup Market, 2024
- Forecast of Estonia Maple syrup Market, 2031
- Historical Data and Forecast of Estonia Maple syrup Revenues & Volume for the Period 2021-2031
- Estonia Maple syrup Market Trend Evolution
- Estonia Maple syrup Market Drivers and Challenges
- Estonia Maple syrup Price Trends
- Estonia Maple syrup Porter`s Five Forces
- Estonia Maple syrup Industry Life Cycle
- Historical Data and Forecast of Estonia Maple syrup Market Revenues & Volume By Raw Material for the Period 2021-2031
- Historical Data and Forecast of Estonia Maple syrup Market Revenues & Volume By Red Maple for the Period 2021-2031
- Historical Data and Forecast of Estonia Maple syrup Market Revenues & Volume By Black Maple for the Period 2021-2031
- Historical Data and Forecast of Estonia Maple syrup Market Revenues & Volume By Sugar Maple for the Period 2021-2031
- Historical Data and Forecast of Estonia Maple syrup Market Revenues & Volume By Application for the Period 2021-2031
- Historical Data and Forecast of Estonia Maple syrup Market Revenues & Volume By Baking Powder for the Period 2021-2031
- Historical Data and Forecast of Estonia Maple syrup Market Revenues & Volume By Waffles for the Period 2021-2031
- Historical Data and Forecast of Estonia Maple syrup Market Revenues & Volume By Pancakes for the Period 2021-2031
- Historical Data and Forecast of Estonia Maple syrup Market Revenues & Volume By French Toast for the Period 2021-2031
- Historical Data and Forecast of Estonia Maple syrup Market Revenues & Volume By Oatmeal for the Period 2021-2031
- Historical Data and Forecast of Estonia Maple syrup Market Revenues & Volume By Distribution Channel for the Period 2021-2031
- Historical Data and Forecast of Estonia Maple syrup Market Revenues & Volume By Online Stores for the Period 2021-2031
- Historical Data and Forecast of Estonia Maple syrup Market Revenues & Volume By Retail Stores for the Period 2021-2031
- Historical Data and Forecast of Estonia Maple syrup Market Revenues & Volume By Super/Hypermarket for the Period 2021-2031
- Estonia Maple syrup Import Export Trade Statistics
- Market Opportunity Assessment By Raw Material
- Market Opportunity Assessment By Application
- Market Opportunity Assessment By Distribution Channel
- Estonia Maple syrup Top Companies Market Share
- Estonia Maple syrup Competitive Benchmarking By Technical and Operational Parameters
- Estonia Maple syrup Company Profiles
- Estonia Maple syrup Key Strategic Recommendations
Frequently Asked Questions About the Market Study (FAQs):
6Wresearch actively monitors the Estonia Maple syrup Market and publishes its comprehensive annual report, highlighting emerging trends, growth drivers, revenue analysis, and forecast outlook. Our insights help businesses to make data-backed strategic decisions with ongoing market dynamics. Our analysts track relevent industries related to the Estonia Maple syrup Market, allowing our clients with actionable intelligence and reliable forecasts tailored to emerging regional needs.
Yes, we provide customisation as per your requirements. To learn more, feel free to contact us on sales@6wresearch.com
1 Executive Summary |
2 Introduction |
2.1 Key Highlights of the Report |
2.2 Report Description |
2.3 Market Scope & Segmentation |
2.4 Research Methodology |
2.5 Assumptions |
3 Estonia Maple syrup Market Overview |
3.1 Estonia Country Macro Economic Indicators |
3.2 Estonia Maple syrup Market Revenues & Volume, 2021 & 2031F |
3.3 Estonia Maple syrup Market - Industry Life Cycle |
3.4 Estonia Maple syrup Market - Porter's Five Forces |
3.5 Estonia Maple syrup Market Revenues & Volume Share, By Raw Material, 2021 & 2031F |
3.6 Estonia Maple syrup Market Revenues & Volume Share, By Application, 2021 & 2031F |
3.7 Estonia Maple syrup Market Revenues & Volume Share, By Distribution Channel, 2021 & 2031F |
4 Estonia Maple syrup Market Dynamics |
4.1 Impact Analysis |
4.2 Market Drivers |
4.3 Market Restraints |
5 Estonia Maple syrup Market Trends |
6 Estonia Maple syrup Market Segmentations |
6.1 Estonia Maple syrup Market, By Raw Material |
6.1.1 Overview and Analysis |
6.1.2 Estonia Maple syrup Market Revenues & Volume, By Red Maple, 2021-2031F |
6.1.3 Estonia Maple syrup Market Revenues & Volume, By Black Maple, 2021-2031F |
6.1.4 Estonia Maple syrup Market Revenues & Volume, By Sugar Maple, 2021-2031F |
6.2 Estonia Maple syrup Market, By Application |
6.2.1 Overview and Analysis |
6.2.2 Estonia Maple syrup Market Revenues & Volume, By Baking Powder, 2021-2031F |
6.2.3 Estonia Maple syrup Market Revenues & Volume, By Waffles, 2021-2031F |
6.2.4 Estonia Maple syrup Market Revenues & Volume, By Pancakes, 2021-2031F |
6.2.5 Estonia Maple syrup Market Revenues & Volume, By French Toast, 2021-2031F |
6.2.6 Estonia Maple syrup Market Revenues & Volume, By Oatmeal, 2021-2031F |
6.3 Estonia Maple syrup Market, By Distribution Channel |
6.3.1 Overview and Analysis |
6.3.2 Estonia Maple syrup Market Revenues & Volume, By Online Stores, 2021-2031F |
6.3.3 Estonia Maple syrup Market Revenues & Volume, By Retail Stores, 2021-2031F |
6.3.4 Estonia Maple syrup Market Revenues & Volume, By Super/Hypermarket, 2021-2031F |
7 Estonia Maple syrup Market Import-Export Trade Statistics |
7.1 Estonia Maple syrup Market Export to Major Countries |
7.2 Estonia Maple syrup Market Imports from Major Countries |
8 Estonia Maple syrup Market Key Performance Indicators |
9 Estonia Maple syrup Market - Opportunity Assessment |
9.1 Estonia Maple syrup Market Opportunity Assessment, By Raw Material, 2021 & 2031F |
9.2 Estonia Maple syrup Market Opportunity Assessment, By Application, 2021 & 2031F |
9.3 Estonia Maple syrup Market Opportunity Assessment, By Distribution Channel, 2021 & 2031F |
10 Estonia Maple syrup Market - Competitive Landscape |
10.1 Estonia Maple syrup Market Revenue Share, By Companies, 2024 |
10.2 Estonia Maple syrup Market Competitive Benchmarking, By Operating and Technical Parameters |
11 Company Profiles |
12 Recommendations | 13 Disclaimer |
Export potential assessment - trade Analytics for 2030
Export potential enables firms to identify high-growth global markets with greater confidence by combining advanced trade intelligence with a structured quantitative methodology. The framework analyzes emerging demand trends and country-level import patterns while integrating macroeconomic and trade datasets such as GDP and population forecasts, bilateral import–export flows, tariff structures, elasticity differentials between developed and developing economies, geographic distance, and import demand projections. Using weighted trade values from 2020–2024 as the base period to project country-to-country export potential for 2030, these inputs are operationalized through calculated drivers such as gravity model parameters, tariff impact factors, and projected GDP per-capita growth. Through an analysis of hidden potentials, demand hotspots, and market conditions that are most favorable to success, this method enables firms to focus on target countries, maximize returns, and global expansion with data, backed by accuracy.
By factoring in the projected importer demand gap that is currently unmet and could be potential opportunity, it identifies the potential for the Exporter (Country) among 190 countries, against the general trade analysis, which identifies the biggest importer or exporter.
To discover high-growth global markets and optimize your business strategy:
Click Here
Pricing
- Single User License$ 1,995
- Department License$ 2,400
- Site License$ 3,120
- Global License$ 3,795

Search
Thought Leadership and Analyst Meet


Our Clients
Latest Reports
- Philippines Polyhydroxybutyrate-co-Hydroxyvalerate Market (2026-2032) | Trends, Insights, Challenges, Restraints, Competition, Size, Value, Forecast, Pricing, Share, Outlook, Revenue, Investment Opportunities, Strategy, Drivers, Demand, Growth, segmentation, Analysis, Companies
- Peru Polyhydroxybutyrate-co-Hydroxyvalerate Market (2026-2032) | Growth, Demand, Challenges, Share, Trends, Analysis, Pricing, Investment Opportunities, Drivers, Value, Forecast, Competition, Size, Companies, Insights, Outlook, Restraints, segmentation, Revenue, Strategy
- Pakistan Polyhydroxybutyrate-co-Hydroxyvalerate Market (2026-2032) | Restraints, segmentation, Pricing, Forecast, Share, Strategy, Competition, Trends, Insights, Drivers, Challenges, Growth, Revenue, Outlook, Value, Investment Opportunities, Companies, Size, Analysis, Demand
- Oman Polyhydroxybutyrate-co-Hydroxyvalerate Market (2026-2032) | Drivers, segmentation, Insights, Competition, Pricing, Outlook, Size, Revenue, Challenges, Forecast, Analysis, Growth, Value, Share, Trends, Investment Opportunities, Strategy, Restraints, Companies, Demand
- Nigeria Polyhydroxybutyrate-co-Hydroxyvalerate Market (2026-2032) | Value, Investment Opportunities, Analysis, Revenue, Restraints, Pricing, Outlook, Competition, Demand, Growth, Forecast, Companies, Trends, Challenges, segmentation, Drivers, Insights, Share, Size, Strategy
- Nepal Polyhydroxybutyrate-co-Hydroxyvalerate Market (2026-2032) | Insights, Analysis, Drivers, Share, Revenue, Demand, segmentation, Investment Opportunities, Competition, Forecast, Growth, Pricing, Companies, Strategy, Trends, Restraints, Challenges, Outlook, Size, Value
- Myanmar Polyhydroxybutyrate-co-Hydroxyvalerate Market (2026-2032) | Outlook, Revenue, Strategy, Restraints, Drivers, segmentation, Share, Forecast, Competition, Insights, Growth, Pricing, Size, Demand, Value, Companies, Trends, Challenges, Investment Opportunities, Analysis
- Morocco Polyhydroxybutyrate-co-Hydroxyvalerate Market (2026-2032) | Outlook, Investment Opportunities, Restraints, Strategy, Forecast, Challenges, Drivers, Growth, Companies, segmentation, Trends, Size, Competition, Revenue, Demand, Insights, Share, Analysis, Value, Pricing
- Mexico Polyhydroxybutyrate-co-Hydroxyvalerate Market (2026-2032) | Size, Drivers, Outlook, Share, Strategy, Growth, Pricing, Challenges, Companies, Demand, Value, Investment Opportunities, Restraints, Trends, Forecast, segmentation, Analysis, Insights, Competition, Revenue
- Malaysia Polyhydroxybutyrate-co-Hydroxyvalerate Market (2026-2032) | Share, segmentation, Size, Companies, Analysis, Insights, Forecast, Value, Revenue, Drivers, Restraints, Challenges, Investment Opportunities, Trends, Competition, Strategy, Demand, Growth, Outlook, Pricing
Industry Events and Analyst Meet

HIMTEX 2026

India Refining Summit 2026

India EV Show 2026

EV tech India Expo 2026

Auto Tech Asia 2026
Whitepaper
- Middle East & Africa Commercial Security Market Click here to view more.
- Middle East & Africa Fire Safety Systems & Equipment Market Click here to view more.
- GCC Drone Market Click here to view more.
- Middle East Lighting Fixture Market Click here to view more.
- GCC Physical & Perimeter Security Market Click here to view more.
6WResearch In News
- Doha a strategic location for EV manufacturing hub: IPA Qatar
- Demand for luxury TVs surging in the GCC, says Samsung
- Empowering Growth: The Thriving Journey of Bangladesh’s Cable Industry
- Demand for luxury TVs surging in the GCC, says Samsung
- Video call with a traditional healer? Once unthinkable, it’s now common in South Africa
- Intelligent Buildings To Smooth GCC’s Path To Net Zero