Estonia Natural Vanillin Market (2025-2031) | Segmentation, Companies, Growth, Value, Outlook, Revenue, Trends, Size, Forecast, Analysis, Share & Industry
Market Forecast By Source (Vanilla Bean Extract, Ferulic Acid Synthesis, Eugenol Synthesis), By Application (Food & Beverages, Pharmaceuticals, Cosmetics & Personal Care) And Competitive Landscape
| Product Code: ETC5790966 | Publication Date: Nov 2023 | Updated Date: Nov 2025 | Product Type: Market Research Report | |
| Publisher: 6Wresearch | Author: Summon Dutta | No. of Pages: 60 | No. of Figures: 30 | No. of Tables: 5 |
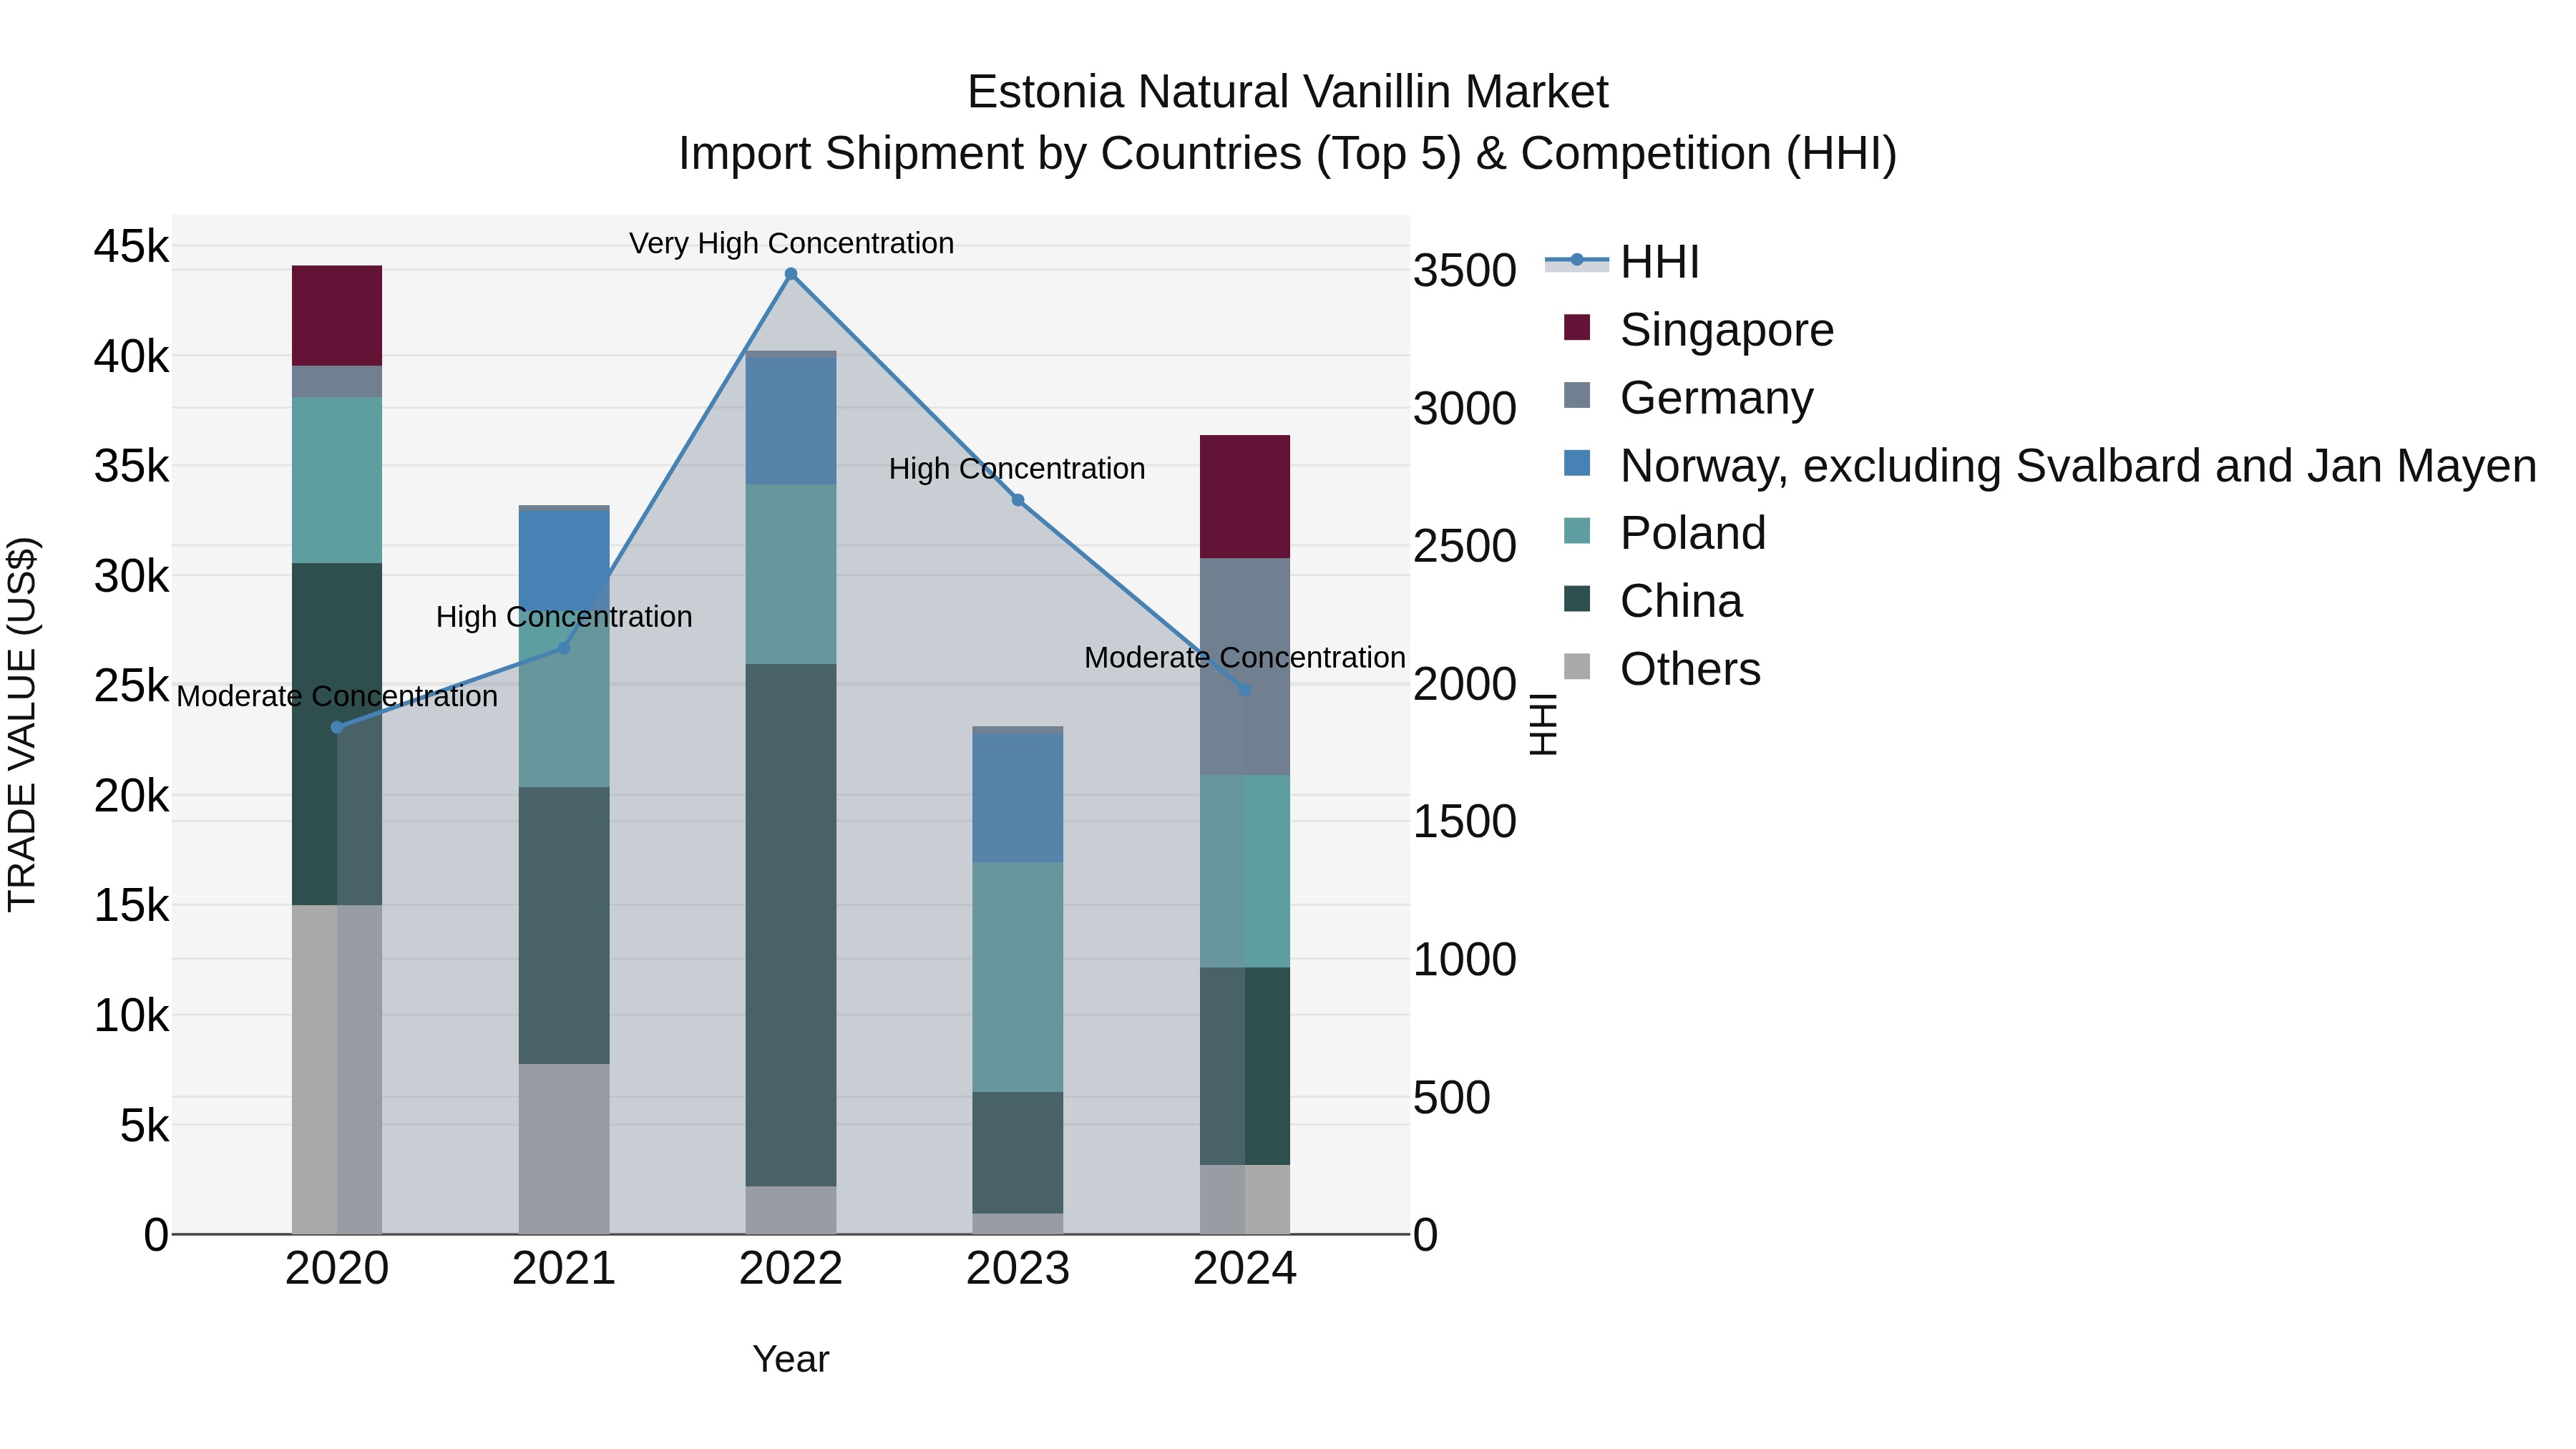
Estonia Natural Vanillin Market Top 5 Importing Countries and Market Competition (HHI) Analysis
Estonia`s natural vanillin import market saw a significant increase in concentration in 2024, with top exporters being Germany, China, Poland, Singapore, and the Netherlands. Despite a negative CAGR from 2020 to 2024, the market experienced a remarkable growth rate of 57.43% from 2023 to 2024. This dynamic shift suggests evolving market trends and potential opportunities for stakeholders to capitalize on the growing demand for natural vanillin in Estonia.
Estonia Natural Vanillin Market Overview
The natural vanillin market in Estonia is expanding as demand for natural flavoring agents grows in the food and beverage industry. Natural vanillin, derived from vanilla beans, is a popular flavoring in sweets, beverages, and fragrances. As consumer preference shifts toward natural and organic ingredients, the market for natural vanillin is expected to grow, supported by Estonias focus on sustainable food production.
Drivers of the market
The natural vanillin market in Estonia is expanding as demand for natural flavoring agents grows in the food, beverage, and fragrance industries. Natural vanillin, derived from sources such as vanilla beans and lignin, is increasingly replacing synthetic vanillin due to its perceived superior quality and natural origin. With Estonia`s emphasis on sustainability and its growing demand for clean-label and organic products, the natural vanillin market is poised for continued growth. This trend is further supported by consumer preferences for natural flavors and ingredients in food products.
Challenges of the market
The natural vanillin market in Estonia faces challenges due to the high cost of production, as natural vanillin is derived from vanilla beans, which are expensive and subject to supply chain disruptions. Synthetic vanillin, which is cheaper and more widely available, remains a strong competitor. Additionally, there are concerns about the environmental impact of vanilla cultivation, as well as the limited availability of natural vanillin sources. Companies in the market must navigate these challenges while meeting growing consumer demand for natural and sustainably sourced ingredients.
Government Policy of the market
Estonia`s policies on the natural vanillin market are focused on sustainability and health-conscious consumer choices. The government promotes the use of natural vanillin derived from renewable resources such as vanilla beans or lignin, as opposed to synthetic vanillin made from petrochemical sources. Regulatory frameworks are in place to ensure that natural vanillin production processes are safe and environmentally responsible, while also encouraging local agricultural practices that support the vanilla farming industry.
Key Highlights of the Report:
- Estonia Natural Vanillin Market Outlook
- Market Size of Estonia Natural Vanillin Market, 2024
- Forecast of Estonia Natural Vanillin Market, 2031
- Historical Data and Forecast of Estonia Natural Vanillin Revenues & Volume for the Period 2021-2031
- Estonia Natural Vanillin Market Trend Evolution
- Estonia Natural Vanillin Market Drivers and Challenges
- Estonia Natural Vanillin Price Trends
- Estonia Natural Vanillin Porter`s Five Forces
- Estonia Natural Vanillin Industry Life Cycle
- Historical Data and Forecast of Estonia Natural Vanillin Market Revenues & Volume By Source for the Period 2021-2031
- Historical Data and Forecast of Estonia Natural Vanillin Market Revenues & Volume By Vanilla Bean Extract for the Period 2021-2031
- Historical Data and Forecast of Estonia Natural Vanillin Market Revenues & Volume By Ferulic Acid Synthesis for the Period 2021-2031
- Historical Data and Forecast of Estonia Natural Vanillin Market Revenues & Volume By Eugenol Synthesis for the Period 2021-2031
- Historical Data and Forecast of Estonia Natural Vanillin Market Revenues & Volume By Application for the Period 2021-2031
- Historical Data and Forecast of Estonia Natural Vanillin Market Revenues & Volume By Food & Beverages for the Period 2021-2031
- Historical Data and Forecast of Estonia Natural Vanillin Market Revenues & Volume By Pharmaceuticals for the Period 2021-2031
- Historical Data and Forecast of Estonia Natural Vanillin Market Revenues & Volume By Cosmetics & Personal Care for the Period 2021-2031
- Estonia Natural Vanillin Import Export Trade Statistics
- Market Opportunity Assessment By Source
- Market Opportunity Assessment By Application
- Estonia Natural Vanillin Top Companies Market Share
- Estonia Natural Vanillin Competitive Benchmarking By Technical and Operational Parameters
- Estonia Natural Vanillin Company Profiles
- Estonia Natural Vanillin Key Strategic Recommendations
Frequently Asked Questions About the Market Study (FAQs):
6Wresearch actively monitors the Estonia Natural Vanillin Market and publishes its comprehensive annual report, highlighting emerging trends, growth drivers, revenue analysis, and forecast outlook. Our insights help businesses to make data-backed strategic decisions with ongoing market dynamics. Our analysts track relevent industries related to the Estonia Natural Vanillin Market, allowing our clients with actionable intelligence and reliable forecasts tailored to emerging regional needs.
Yes, we provide customisation as per your requirements. To learn more, feel free to contact us on sales@6wresearch.com
1 Executive Summary |
2 Introduction |
2.1 Key Highlights of the Report |
2.2 Report Description |
2.3 Market Scope & Segmentation |
2.4 Research Methodology |
2.5 Assumptions |
3 Estonia Natural Vanillin Market Overview |
3.1 Estonia Country Macro Economic Indicators |
3.2 Estonia Natural Vanillin Market Revenues & Volume, 2021 & 2031F |
3.3 Estonia Natural Vanillin Market - Industry Life Cycle |
3.4 Estonia Natural Vanillin Market - Porter's Five Forces |
3.5 Estonia Natural Vanillin Market Revenues & Volume Share, By Source, 2021 & 2031F |
3.6 Estonia Natural Vanillin Market Revenues & Volume Share, By Application, 2021 & 2031F |
4 Estonia Natural Vanillin Market Dynamics |
4.1 Impact Analysis |
4.2 Market Drivers |
4.2.1 Increasing demand for natural and clean label food products |
4.2.2 Growing awareness about health benefits of natural vanillin |
4.2.3 Rise in consumer preferences for sustainable and eco-friendly ingredients |
4.3 Market Restraints |
4.3.1 Limited availability and high cost of natural vanillin compared to synthetic alternatives |
4.3.2 Challenges in consistent quality and supply chain management of natural vanillin |
5 Estonia Natural Vanillin Market Trends |
6 Estonia Natural Vanillin Market Segmentations |
6.1 Estonia Natural Vanillin Market, By Source |
6.1.1 Overview and Analysis |
6.1.2 Estonia Natural Vanillin Market Revenues & Volume, By Vanilla Bean Extract, 2021-2031F |
6.1.3 Estonia Natural Vanillin Market Revenues & Volume, By Ferulic Acid Synthesis, 2021-2031F |
6.1.4 Estonia Natural Vanillin Market Revenues & Volume, By Eugenol Synthesis, 2021-2031F |
6.2 Estonia Natural Vanillin Market, By Application |
6.2.1 Overview and Analysis |
6.2.2 Estonia Natural Vanillin Market Revenues & Volume, By Food & Beverages, 2021-2031F |
6.2.3 Estonia Natural Vanillin Market Revenues & Volume, By Pharmaceuticals, 2021-2031F |
6.2.4 Estonia Natural Vanillin Market Revenues & Volume, By Cosmetics & Personal Care, 2021-2031F |
7 Estonia Natural Vanillin Market Import-Export Trade Statistics |
7.1 Estonia Natural Vanillin Market Export to Major Countries |
7.2 Estonia Natural Vanillin Market Imports from Major Countries |
8 Estonia Natural Vanillin Market Key Performance Indicators |
8.1 Percentage of food products using natural vanillin as an ingredient |
8.2 Number of new product launches featuring natural vanillin |
8.3 Investment in research and development for enhancing natural vanillin production techniques |
9 Estonia Natural Vanillin Market - Opportunity Assessment |
9.1 Estonia Natural Vanillin Market Opportunity Assessment, By Source, 2021 & 2031F |
9.2 Estonia Natural Vanillin Market Opportunity Assessment, By Application, 2021 & 2031F |
10 Estonia Natural Vanillin Market - Competitive Landscape |
10.1 Estonia Natural Vanillin Market Revenue Share, By Companies, 2024 |
10.2 Estonia Natural Vanillin Market Competitive Benchmarking, By Operating and Technical Parameters |
11 Company Profiles |
12 Recommendations | 13 Disclaimer |
Global Go To Market Strategy - 2030
Export potential enables firms to identify high-growth global markets with greater confidence by combining advanced trade intelligence with a structured quantitative methodology. The framework analyzes emerging demand trends and country-level import patterns while integrating macroeconomic and trade datasets such as GDP and population forecasts, bilateral import–export flows, tariff structures, elasticity differentials between developed and developing economies, geographic distance, and import demand projections. Using weighted trade values from 2020–2024 as the base period to project country-to-country export potential for 2030, these inputs are operationalized through calculated drivers such as gravity model parameters, tariff impact factors, and projected GDP per-capita growth. Through an analysis of hidden potentials, demand hotspots, and market conditions that are most favorable to success, this method enables firms to focus on target countries, maximize returns, and global expansion with data, backed by accuracy.
By factoring in the projected importer demand gap that is currently unmet and could be potential opportunity, it identifies the potential for the Exporter (Country) among 190 countries, against the general trade analysis, which identifies the biggest importer or exporter.
To discover high-growth global markets and optimize your business strategy:
Click Here
Pricing
- Single User License$ 1,995
- Department License$ 2,400
- Site License$ 3,120
- Global License$ 3,795

Leadership Perspectives from Industry Events
Search
Thought Leadership and Analyst Meet


Our Clients
6WResearch In News
- Doha a strategic location for EV manufacturing hub: IPA Qatar
- Demand for luxury TVs surging in the GCC, says Samsung
- Empowering Growth: The Thriving Journey of Bangladesh’s Cable Industry
- Demand for luxury TVs surging in the GCC, says Samsung
- Video call with a traditional healer? Once unthinkable, it’s now common in South Africa
- Intelligent Buildings To Smooth GCC’s Path To Net Zero
Latest Reports
- New Zealand Aseptic Manufacturing Market (2026-2032)
- Netherlands Aseptic Manufacturing Market (2026-2032)
- Nauru Aseptic Manufacturing Market (2026-2032)
- Namibia Aseptic Manufacturing Market (2026-2032)
- Mozambique Aseptic Manufacturing Market (2026-2032)
- Montenegro Aseptic Manufacturing Market (2026-2032)
- Mongolia Aseptic Manufacturing Market (2026-2032)
- Monaco Aseptic Manufacturing Market (2026-2032)
- Micronesia Aseptic Manufacturing Market (2026-2032)
- Mauritius Aseptic Manufacturing Market (2026-2032)
Industry Events and Analyst Meet

HIMTEX 2026

India Refining Summit 2026

India EV Show 2026

EV tech India Expo 2026

Auto Tech Asia 2026
Whitepaper
- Middle East & Africa Commercial Security Market Click here to view more.
- Middle East & Africa Fire Safety Systems & Equipment Market Click here to view more.
- GCC Drone Market Click here to view more.
- Middle East Lighting Fixture Market Click here to view more.
- GCC Physical & Perimeter Security Market Click here to view more.