Estonia Slate Products Market (2026-2032) | Revenue, Forecast, Companies, Industry, Size, Analysis, Value, Segmentation, Share, Outlook, Trends & Growth
Market Forecast By Type (Natural, Synthetic Slate), By Application (Roof, Floor, Wall, Others) And Competitive Landscape
| Product Code: ETC5148728 | Publication Date: Nov 2023 | Updated Date: Apr 2026 | Product Type: Market Research Report | |
| Publisher: 6Wresearch | Author: Shubham Padhi | No. of Pages: 60 | No. of Figures: 30 | No. of Tables: 5 |
Estonia Slate Products Market Size (2020-2030)
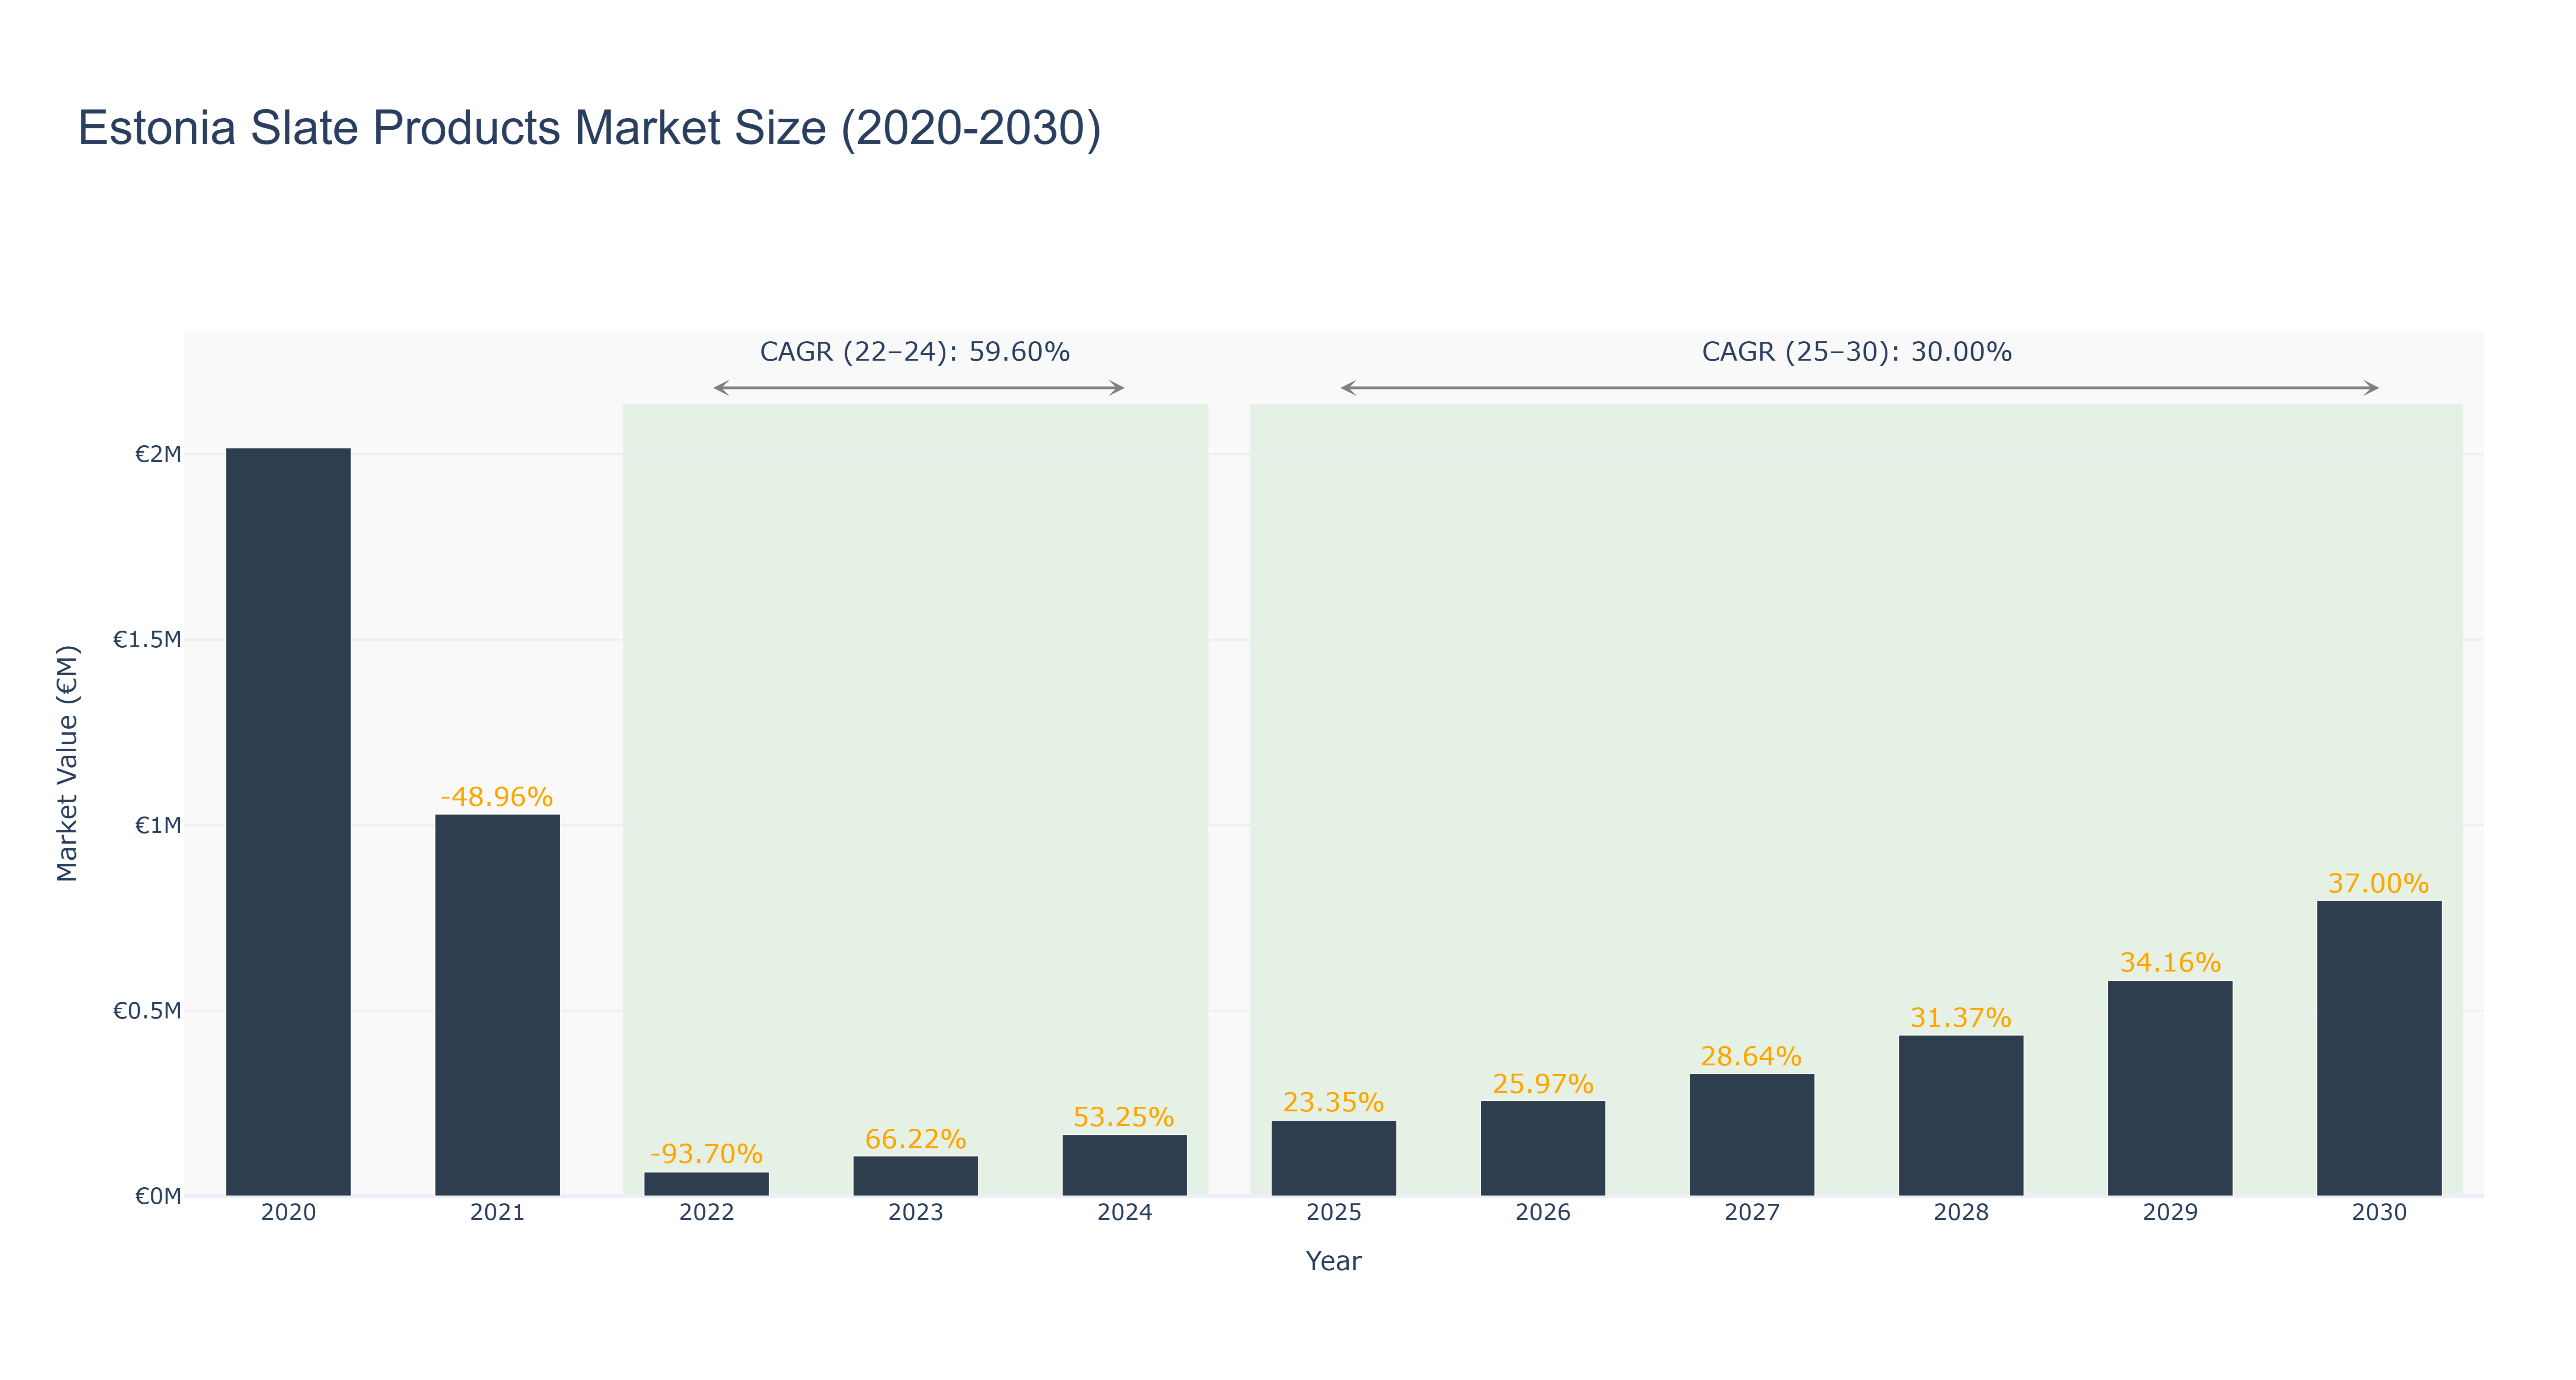
Estonia Slate Products Market has seen a fluctuating trend in recent years. The market peaked at €2.02 million in 2020 but experienced a significant decline to €0.06 million in 2022 due to economic instability. However, the market has shown signs of recovery, with a steady growth in subsequent years. The forecasted market size is expected to reach €0.80 million by 2030, indicating a promising upward trajectory. The CAGR from 2022 to 2024 stands at 59.60%, showcasing a rapid recovery phase, while the CAGR from 2025 to 2030 is projected at 30.0%, indicating sustained growth. Industry drivers such as increasing demand for sustainable construction materials and technological advancements are expected to further drive market growth. Looking ahead, upcoming infrastructure projects in Estonia are set to boost the demand for slate products, providing opportunities for market expansion and development.
Estonia Slate Products Market: Production & Trade Performance (2019-2025)
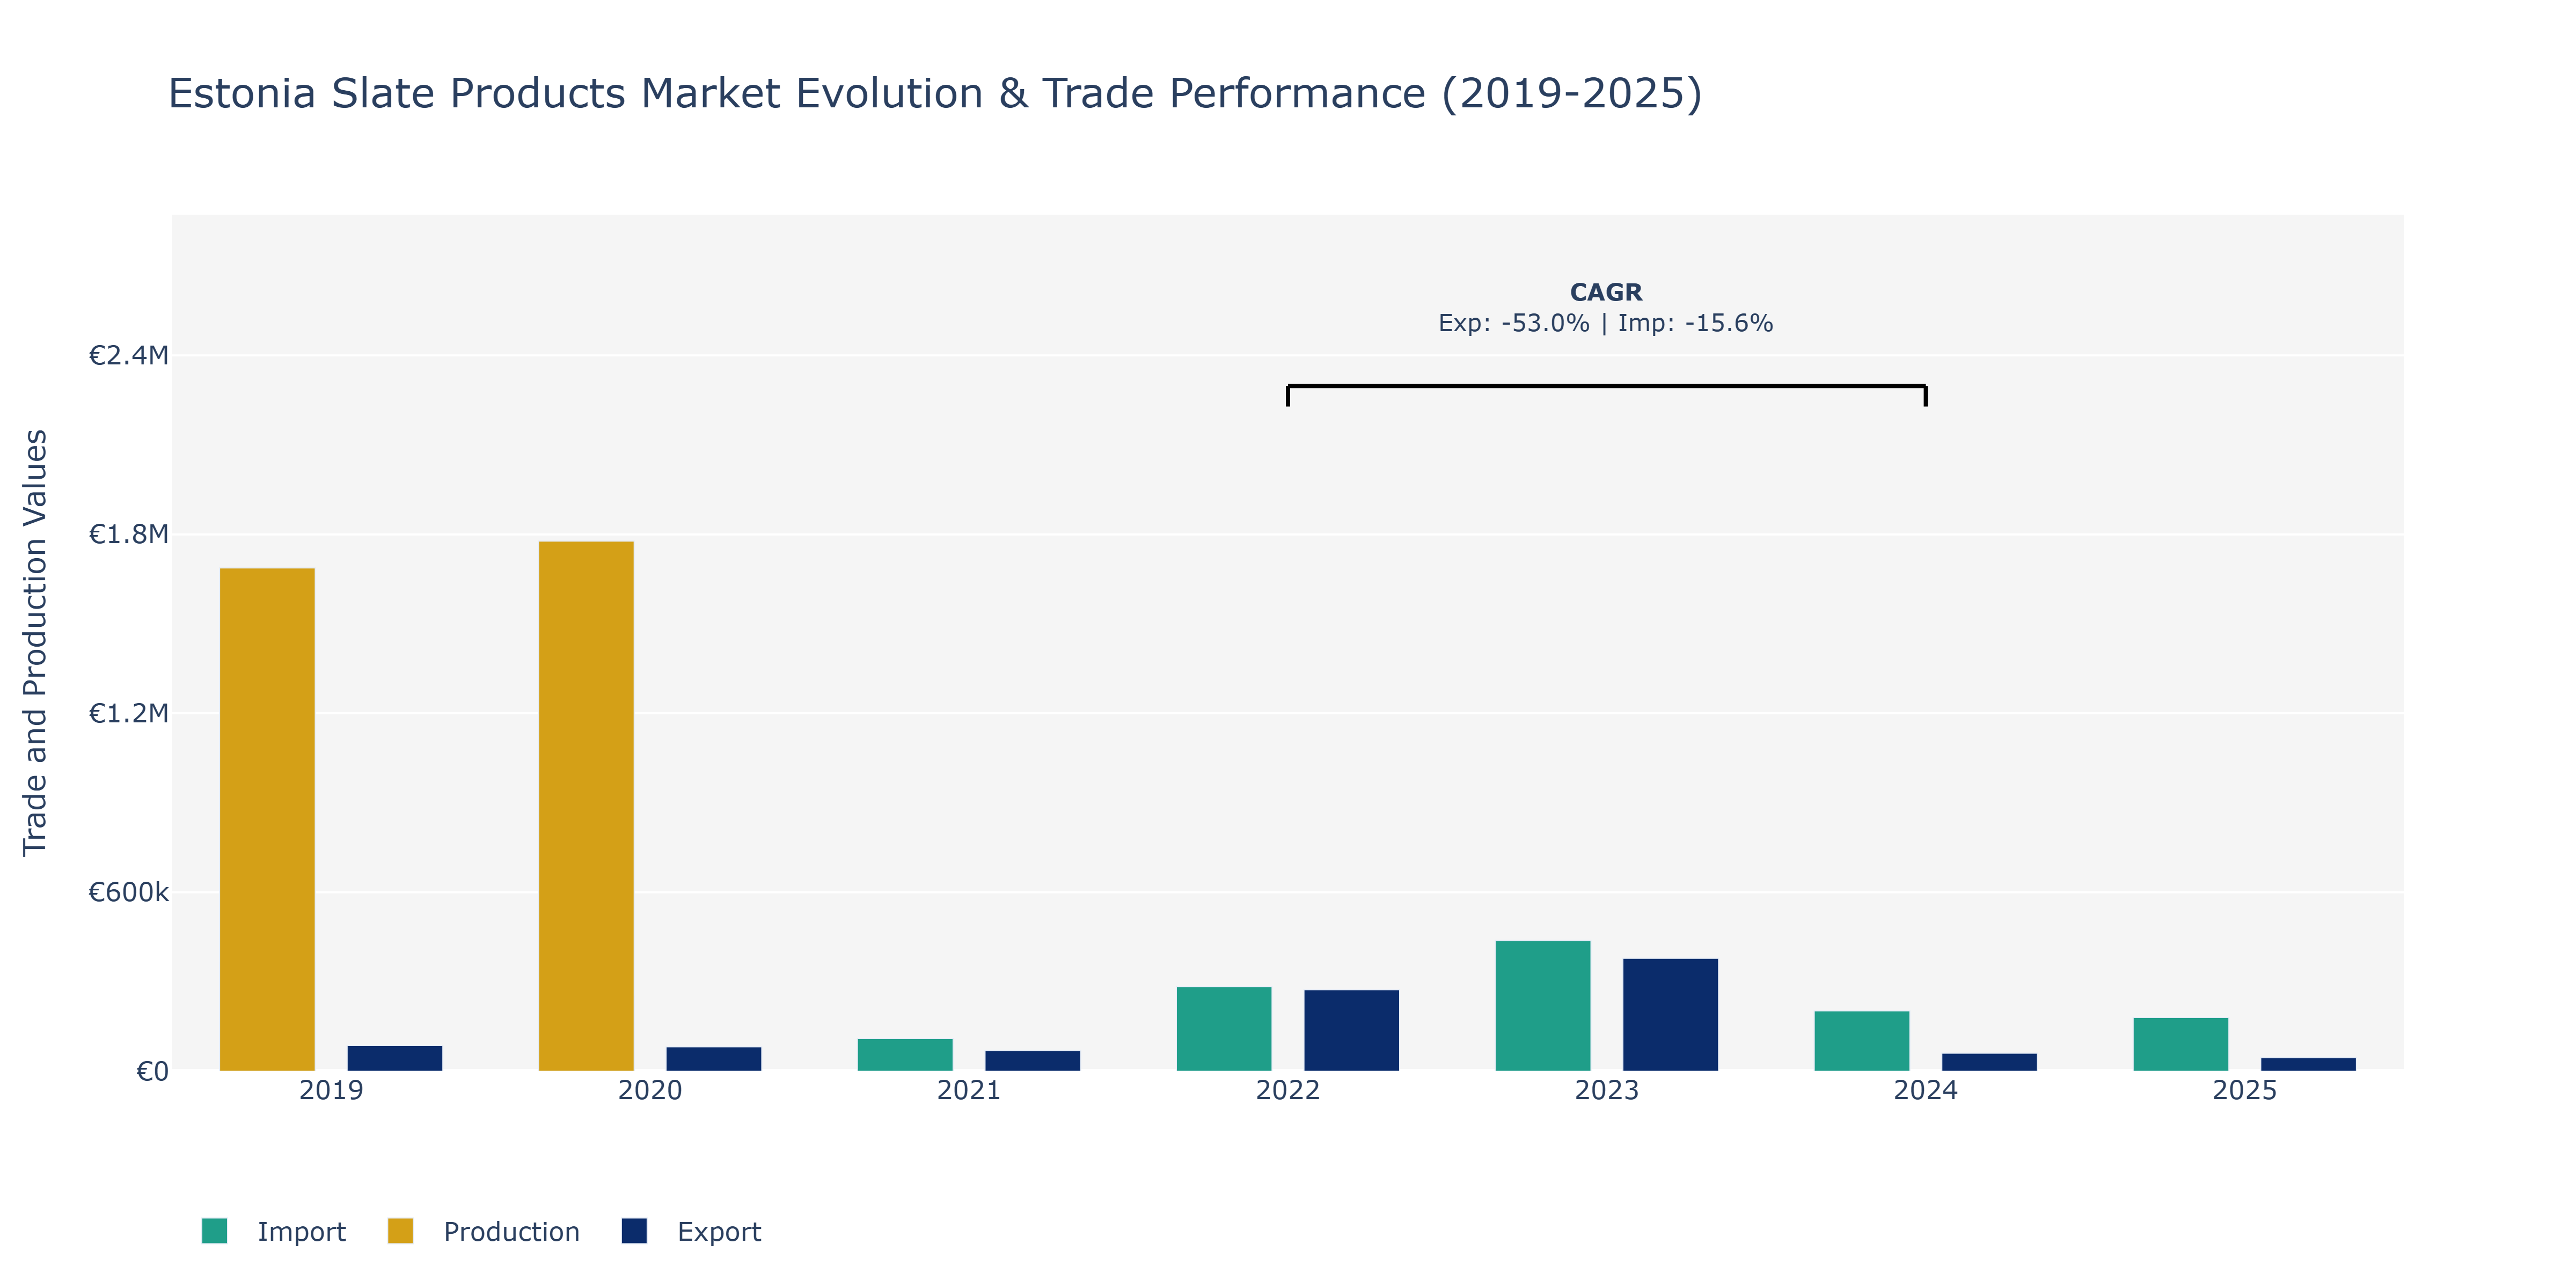
Between 2019 and 2025, the Estonia Slate Products Market saw notable variations in exports, imports, and production. Exports experienced a decline from €86.44 thousand in 2019 to a low of €45.39 thousand in 2025. This drop may be attributed to global economic uncertainties impacting demand for slate products. Imports followed a similar trend, decreasing from €363.75 thousand in 2019 to €180.00 thousand in 2025. The reduction in imports could be due to a shift towards domestic production or changes in consumer preferences favoring local products. Production, on the other hand, showed an overall increasing trend from €1.69 billion in 2019 to €1.77 billion in 2020, indicating a positive domestic manufacturing capacity. The market's reliance on imports might have decreased as local production capacity improved, impacting both import and export numbers. These changes suggest a dynamic market adapting to both international and domestic factors.
Key Highlights of the Report:
- Estonia Slate Products Market Outlook
- Market Size of Estonia Slate Products Market, 2025
- Forecast of Estonia Slate Products Market, 2032
- Historical Data and Forecast of Estonia Slate Products Revenues & Volume for the Period 2022 - 2032F
- Estonia Slate Products Market Trend Evolution
- Estonia Slate Products Market Drivers and Challenges
- Estonia Slate Products Price Trends
- Estonia Slate Products Porter`s Five Forces
- Estonia Slate Products Industry Life Cycle
- Historical Data and Forecast of Estonia Slate Products Market Revenues & Volume By Type for the Period 2022 - 2032F
- Historical Data and Forecast of Estonia Slate Products Market Revenues & Volume By Natural for the Period 2022 - 2032F
- Historical Data and Forecast of Estonia Slate Products Market Revenues & Volume By Synthetic Slate for the Period 2022 - 2032F
- Historical Data and Forecast of Estonia Slate Products Market Revenues & Volume By Application for the Period 2022 - 2032F
- Historical Data and Forecast of Estonia Slate Products Market Revenues & Volume By Roof for the Period 2022 - 2032F
- Historical Data and Forecast of Estonia Slate Products Market Revenues & Volume By Floor for the Period 2022 - 2032F
- Historical Data and Forecast of Estonia Slate Products Market Revenues & Volume By Wall for the Period 2022 - 2032F
- Historical Data and Forecast of Estonia Slate Products Market Revenues & Volume By Others for the Period 2022 - 2032F
- Estonia Slate Products Import Export Trade Statistics
- Market Opportunity Assessment By Type
- Market Opportunity Assessment By Application
- Estonia Slate Products Top Companies Market Share
- Estonia Slate Products Competitive Benchmarking By Technical and Operational Parameters
- Estonia Slate Products Company Profiles
- Estonia Slate Products Key Strategic Recommendations
Frequently Asked Questions About the Market Study (FAQs):
6Wresearch actively monitors the Estonia Slate Products Market and publishes its comprehensive annual report, highlighting emerging trends, growth drivers, revenue analysis, and forecast outlook. Our insights help businesses to make data-backed strategic decisions with ongoing market dynamics. Our analysts track relevent industries related to the Estonia Slate Products Market, allowing our clients with actionable intelligence and reliable forecasts tailored to emerging regional needs.
Yes, we provide customisation as per your requirements. To learn more, feel free to contact us on sales@6wresearch.com
1 Executive Summary |
2 Introduction |
2.1 Key Highlights of the Report |
2.2 Report Description |
2.3 Market Scope & Segmentation |
2.4 Research Methodology |
2.5 Assumptions |
3 Estonia Slate Products Market Overview |
3.1 Estonia Country Macro Economic Indicators |
3.2 Estonia Slate Products Market Revenues & Volume, 2022 & 2032F |
3.3 Estonia Slate Products Market - Industry Life Cycle |
3.4 Estonia Slate Products Market - Porter's Five Forces |
3.5 Estonia Slate Products Market Revenues & Volume Share, By Type, 2022 & 2032F |
3.6 Estonia Slate Products Market Revenues & Volume Share, By Application, 2022 & 2032F |
4 Estonia Slate Products Market Dynamics |
4.1 Impact Analysis |
4.2 Market Drivers |
4.2.1 Increasing demand for eco-friendly and sustainable construction materials |
4.2.2 Growing popularity of natural stone products in interior design and landscaping |
4.2.3 Rise in construction activities and infrastructure development projects in Estonia |
4.3 Market Restraints |
4.3.1 Limited availability of high-quality slate reserves in Estonia |
4.3.2 Fluctuating raw material prices impacting production costs |
4.3.3 Intense competition from alternative construction materials such as ceramic tiles and engineered stone products |
5 Estonia Slate Products Market Trends |
6 Estonia Slate Products Market Segmentations |
6.1 Estonia Slate Products Market, By Type |
6.1.1 Overview and Analysis |
6.1.2 Estonia Slate Products Market Revenues & Volume, By Natural, 2022 - 2032F |
6.1.3 Estonia Slate Products Market Revenues & Volume, By Synthetic Slate, 2022 - 2032F |
6.2 Estonia Slate Products Market, By Application |
6.2.1 Overview and Analysis |
6.2.2 Estonia Slate Products Market Revenues & Volume, By Roof, 2022 - 2032F |
6.2.3 Estonia Slate Products Market Revenues & Volume, By Floor, 2022 - 2032F |
6.2.4 Estonia Slate Products Market Revenues & Volume, By Wall, 2022 - 2032F |
6.2.5 Estonia Slate Products Market Revenues & Volume, By Others, 2022 - 2032F |
7 Estonia Slate Products Market Import-Export Trade Statistics |
7.1 Estonia Slate Products Market Export to Major Countries |
7.2 Estonia Slate Products Market Imports from Major Countries |
8 Estonia Slate Products Market Key Performance Indicators |
8.1 Percentage increase in the number of construction projects utilizing slate products |
8.2 Growth in the number of retail outlets offering slate products |
8.3 Adoption rate of eco-certifications and sustainability standards by slate product manufacturers |
9 Estonia Slate Products Market - Opportunity Assessment |
9.1 Estonia Slate Products Market Opportunity Assessment, By Type, 2022 & 2032F |
9.2 Estonia Slate Products Market Opportunity Assessment, By Application, 2022 & 2032F |
10 Estonia Slate Products Market - Competitive Landscape |
10.1 Estonia Slate Products Market Revenue Share, By Companies, 2025 |
10.2 Estonia Slate Products Market Competitive Benchmarking, By Operating and Technical Parameters |
11 Company Profiles |
12 Recommendations | 13 Disclaimer |
Export potential assessment - trade Analytics for 2030
Export potential enables firms to identify high-growth global markets with greater confidence by combining advanced trade intelligence with a structured quantitative methodology. The framework analyzes emerging demand trends and country-level import patterns while integrating macroeconomic and trade datasets such as GDP and population forecasts, bilateral import–export flows, tariff structures, elasticity differentials between developed and developing economies, geographic distance, and import demand projections. Using weighted trade values from 2020–2024 as the base period to project country-to-country export potential for 2030, these inputs are operationalized through calculated drivers such as gravity model parameters, tariff impact factors, and projected GDP per-capita growth. Through an analysis of hidden potentials, demand hotspots, and market conditions that are most favorable to success, this method enables firms to focus on target countries, maximize returns, and global expansion with data, backed by accuracy.
By factoring in the projected importer demand gap that is currently unmet and could be potential opportunity, it identifies the potential for the Exporter (Country) among 190 countries, against the general trade analysis, which identifies the biggest importer or exporter.
To discover high-growth global markets and optimize your business strategy:
Click Here
Pricing
- Single User License$ 1,995
- Department License$ 2,400
- Site License$ 3,120
- Global License$ 3,795

Search
Thought Leadership and Analyst Meet


Our Clients
Latest Reports
- China Electric Appliance Rental Market (2026-2032) | Trends, Revenue, Growth, Challenges, Size, Value, Outlook, Pricing, Strategy, Insights, Restraints, segmentation, Companies, Investment Opportunities, Analysis, Demand, Drivers, Competition, Forecast, Share
- Chile Electric Appliance Rental Market (2026-2032) | Outlook, Competition, Drivers, Strategy, Revenue, Analysis, Value, Pricing, Restraints, Size, Demand, Share, Growth, Forecast, Challenges, Insights, Investment Opportunities, Companies, Trends, segmentation
- Cambodia Electric Appliance Rental Market (2026-2032) | Companies, Analysis, Restraints, Pricing, Insights, Challenges, Outlook, Strategy, Forecast, Trends, Competition, Value, Revenue, Investment Opportunities, segmentation, Drivers, Size, Demand, Growth, Share
- Brazil Electric Appliance Rental Market (2026-2032) | Revenue, Strategy, Forecast, Companies, segmentation, Competition, Size, Investment Opportunities, Pricing, Restraints, Outlook, Challenges, Analysis, Drivers, Value, Demand, Insights, Trends, Growth, Share
- Bangladesh Electric Appliance Rental Market (2026-2032) | Drivers, Forecast, Investment Opportunities, Strategy, Insights, Demand, Challenges, Outlook, Trends, Competition, Value, Revenue, Size, Pricing, Analysis, Companies, Restraints, segmentation, Share, Growth
- Bahrain Electric Appliance Rental Market (2026-2032) | Outlook, Size, Competition, Restraints, Drivers, Value, Trends, Investment Opportunities, Insights, Forecast, Revenue, Strategy, Growth, Share, Demand, Analysis, Challenges, Companies, segmentation, Pricing
- Azerbaijan Electric Appliance Rental Market (2026-2032) | Trends, Investment Opportunities, Restraints, Insights, Strategy, Competition, Value, Growth, Demand, Drivers, Analysis, Forecast, Size, Share, Outlook, segmentation, Pricing, Challenges, Revenue, Companies
- Australia Electric Appliance Rental Market (2026-2032) | Challenges, Restraints, Forecast, Demand, Size, Competition, Pricing, Investment Opportunities, Revenue, Trends, Drivers, Growth, Outlook, Analysis, Strategy, Value, segmentation, Insights, Companies, Share
- Argentina Electric Appliance Rental Market (2026-2032) | Growth, Trends, Insights, Outlook, Forecast, Size, Drivers, Analysis, Restraints, Challenges, Share, Revenue, Investment Opportunities, Strategy, Demand, Value, Companies, segmentation, Competition, Pricing
- Algeria Electric Appliance Rental Market (2026-2032) | Share, Size, Value, Strategy, Competition, Outlook, Challenges, Companies, Trends, Pricing, Insights, Forecast, Investment Opportunities, Revenue, Growth, Restraints, segmentation, Analysis, Demand, Drivers
Industry Events and Analyst Meet

HIMTEX 2026

India Refining Summit 2026

India EV Show 2026

EV tech India Expo 2026

Auto Tech Asia 2026
Whitepaper
- Middle East & Africa Commercial Security Market Click here to view more.
- Middle East & Africa Fire Safety Systems & Equipment Market Click here to view more.
- GCC Drone Market Click here to view more.
- Middle East Lighting Fixture Market Click here to view more.
- GCC Physical & Perimeter Security Market Click here to view more.
6WResearch In News
- Doha a strategic location for EV manufacturing hub: IPA Qatar
- Demand for luxury TVs surging in the GCC, says Samsung
- Empowering Growth: The Thriving Journey of Bangladesh’s Cable Industry
- Demand for luxury TVs surging in the GCC, says Samsung
- Video call with a traditional healer? Once unthinkable, it’s now common in South Africa
- Intelligent Buildings To Smooth GCC’s Path To Net Zero