Estonia Soup Market (2026-2032) | Growth, Share, Industry, Competitive Landscape, Companies, Trends, Analysis, Segmentation, Outlook, Size & Revenue, Forecast, Value
Market Forecast By Category (Vegetarian Soup, Non-Vegetarian Soup), By Type (Dehydrated, Instant, Canned/Preserved, Chilled, Frozen, UHT, Others), By Packaging (Canned, Pouch, Other), By Distribution Channels (Supermarket/Hypermarkets, Convenience Stores, Online Retail Stores, Others) And Competitive Landscape
| Product Code: ETC7143327 | Publication Date: Sep 2024 | Updated Date: Apr 2026 | Product Type: Market Research Report | |
| Publisher: 6Wresearch | Author: Summon Dutta | No. of Pages: 75 | No. of Figures: 35 | No. of Tables: 20 |
Estonia Soup Market Size (2020-2030)
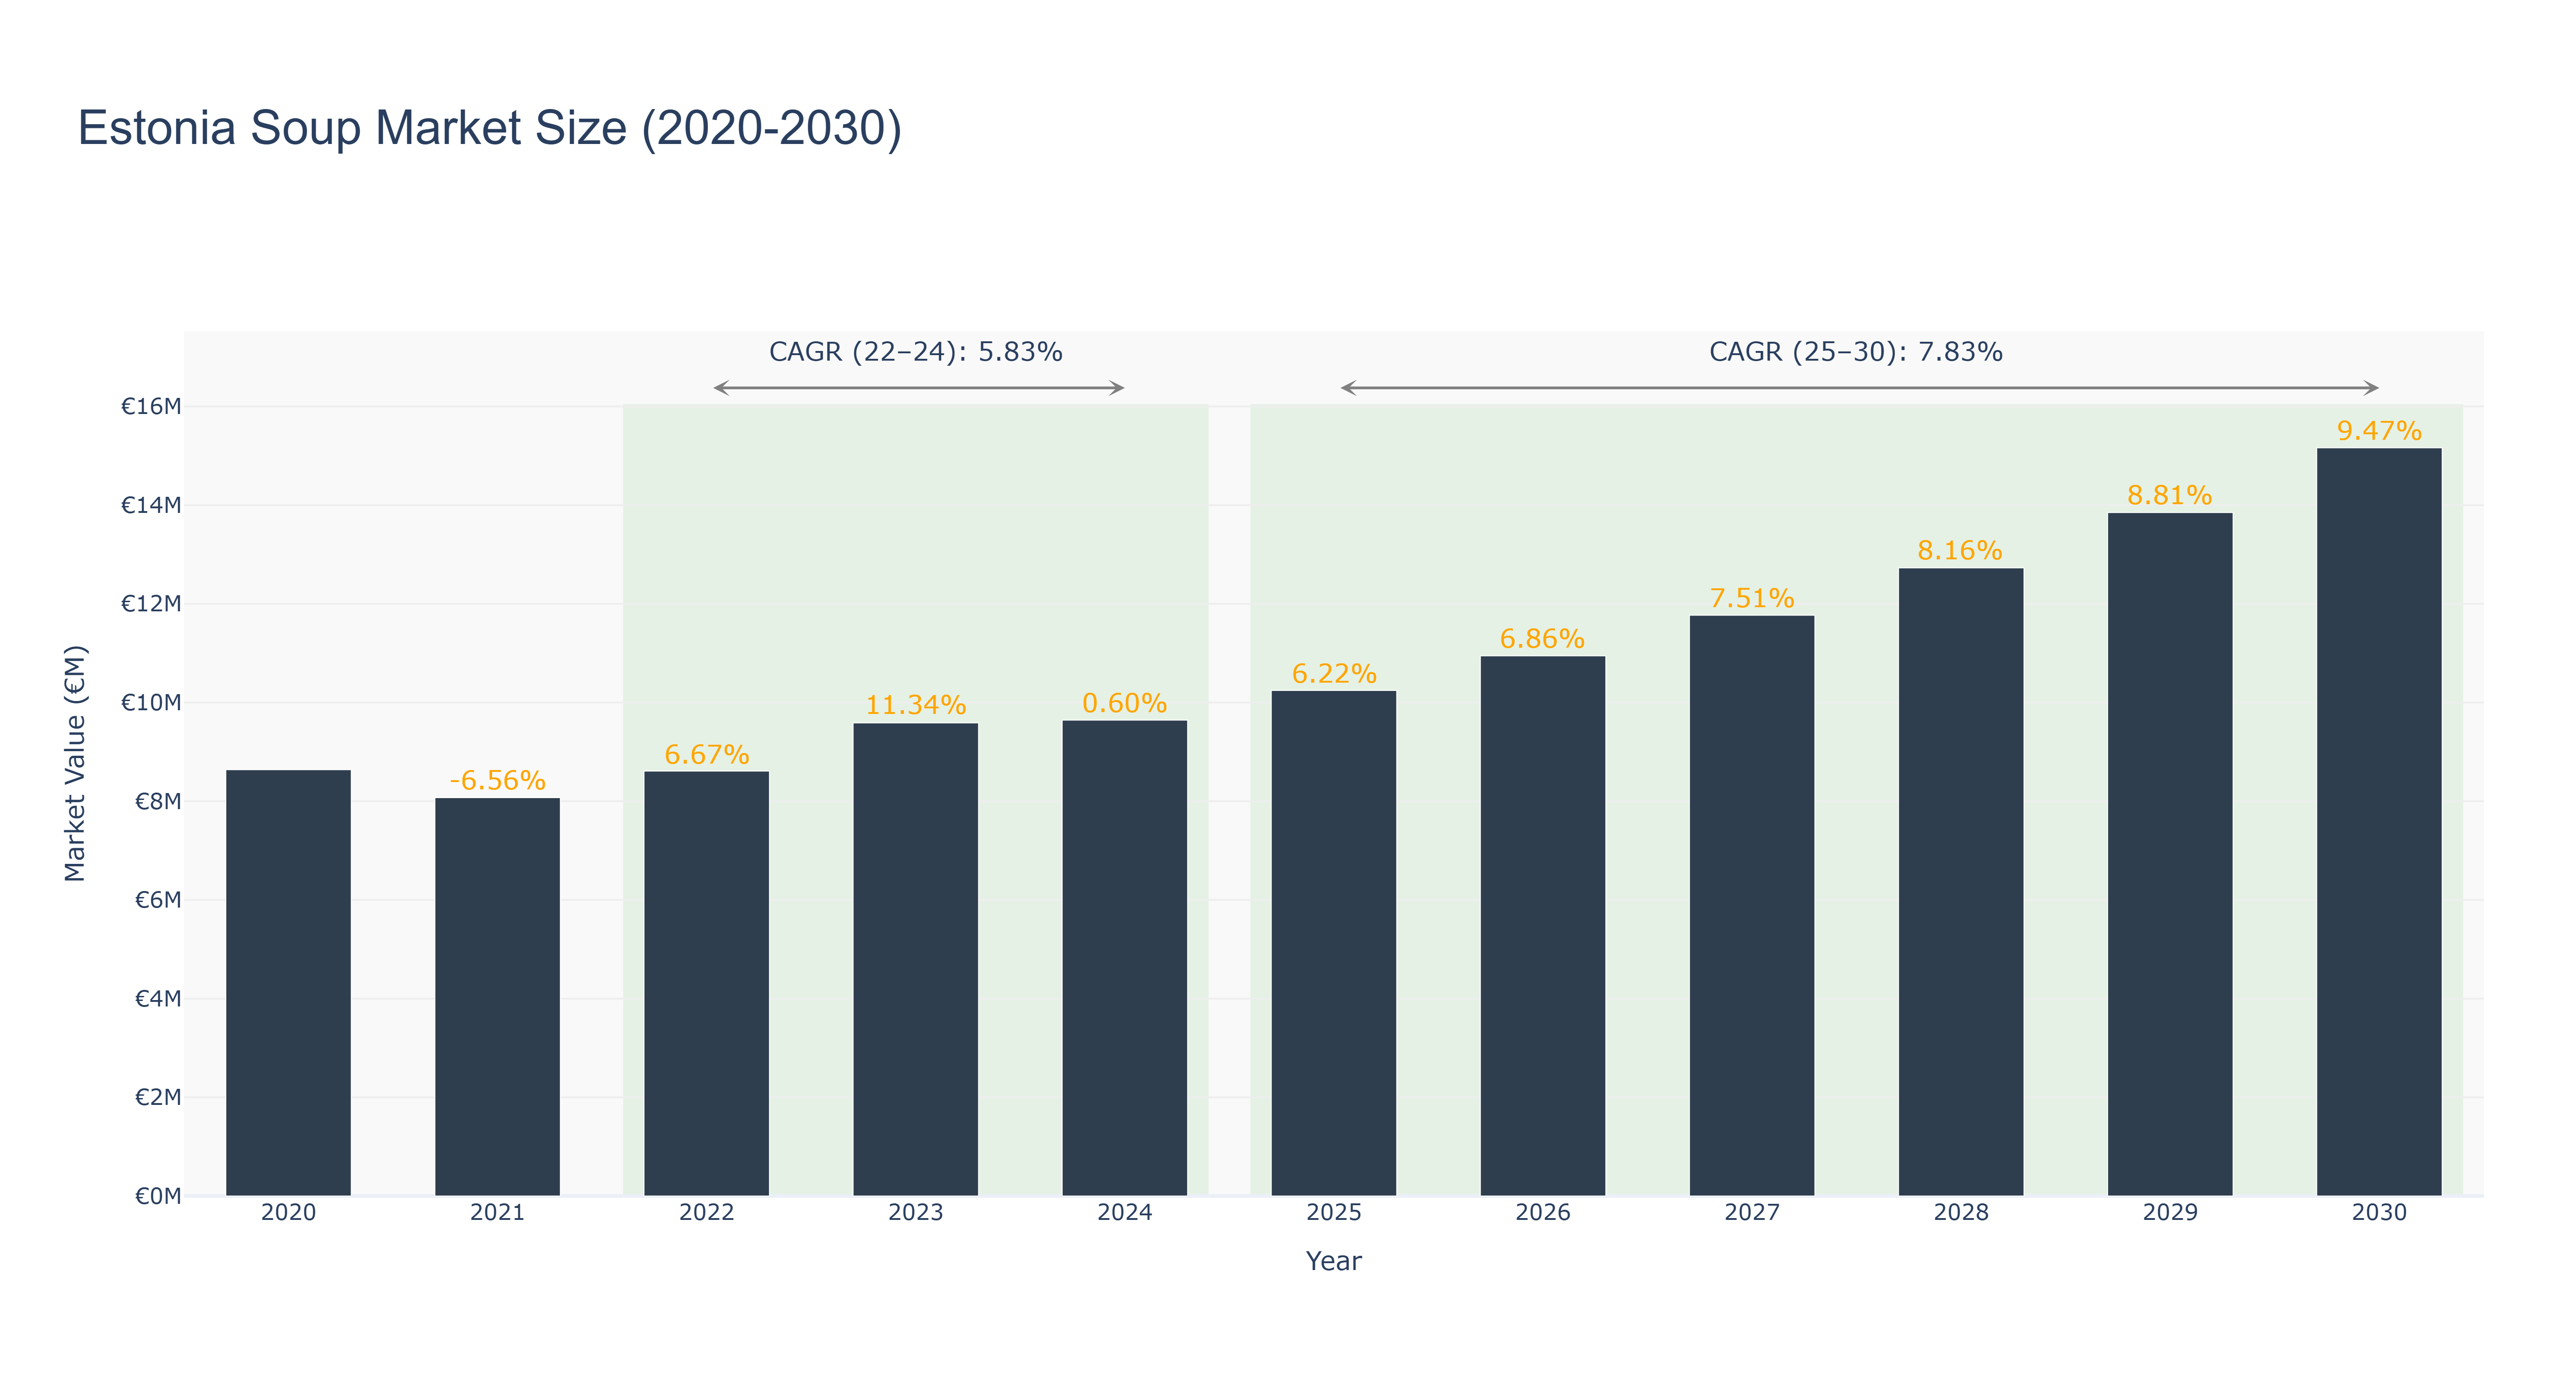
The Estonia Soup Market experienced steady growth over the past decade. The market size peaked at €15.16 million in 2030, showing a consistent upward trend. From 2020 to 2024, the market size increased from €8.64 million to €9.64 million, with a notable spike in 2023 due to increased consumer demand for convenient and healthy food options. The forecasted market size from 2025 to 2030 is expected to continue growing, with a CAGR of 7.83% during this period. The market's growth can be attributed to factors such as rising health consciousness among consumers and a growing preference for convenient meal solutions. Looking ahead, Estonia is set to launch a national campaign promoting local food products, which is expected to further boost the soup market's growth. Industry drivers include changing consumer preferences towards healthier food options, convenience, and the increasing popularity of ready-to-eat meals.
Estonia Soup Market: Production & Trade Performance (2019-2025)
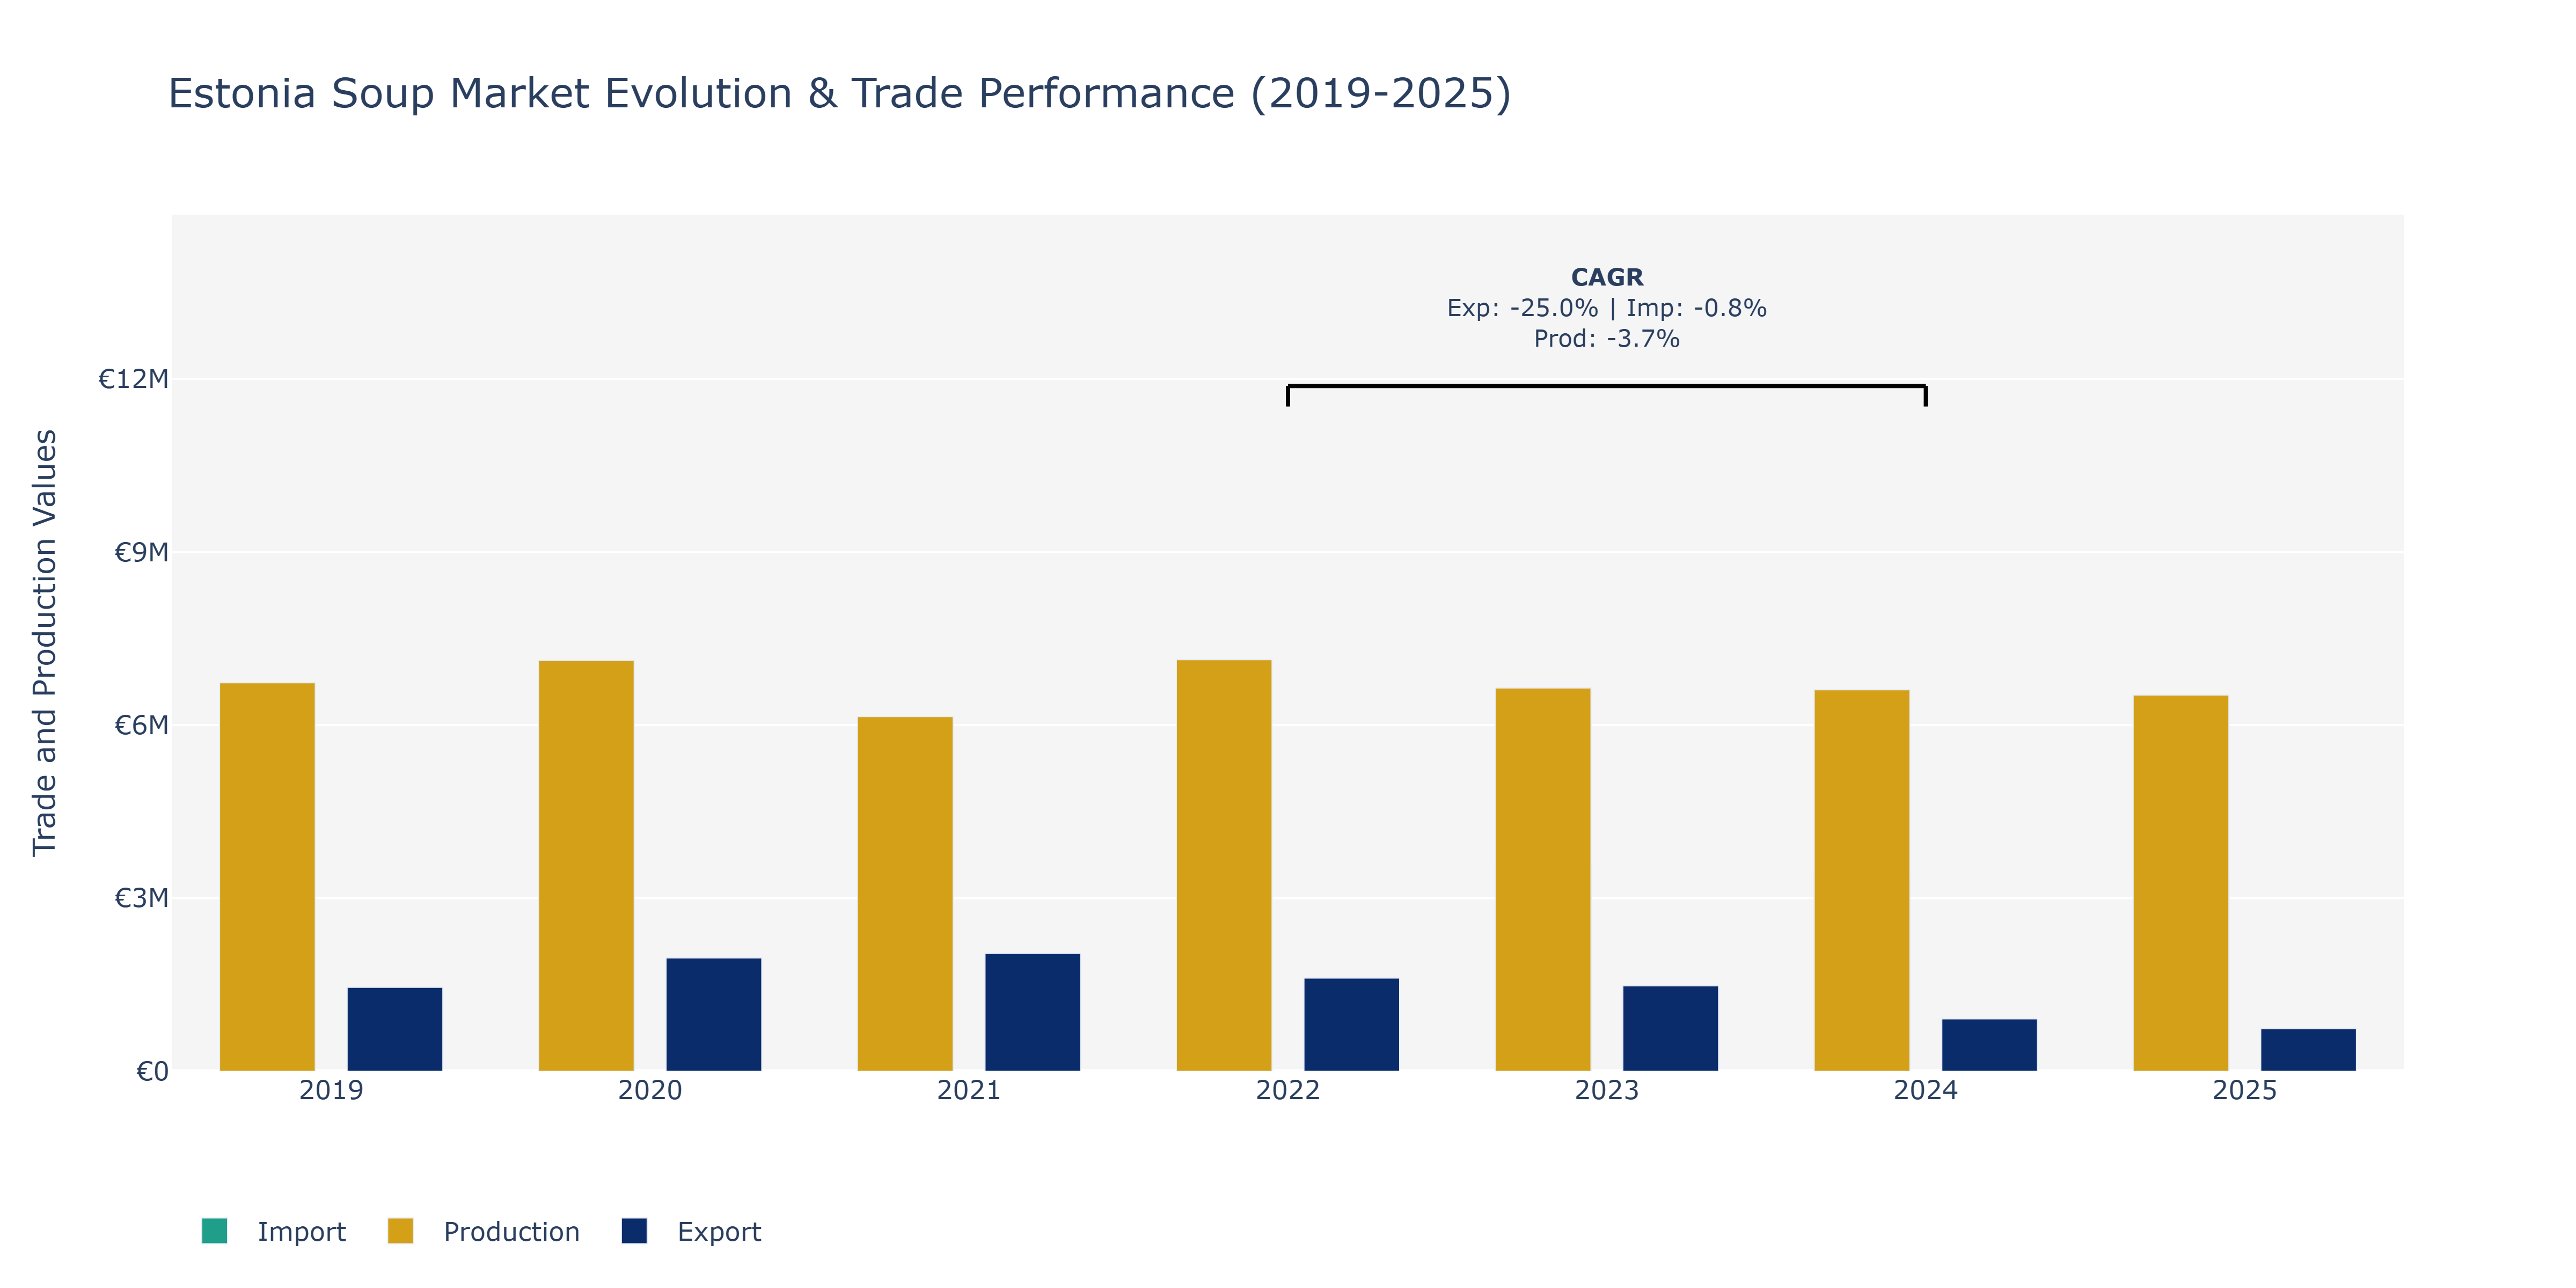
Between 2019 and 2025, the Estonia Soup Market saw varying trends in Exports, Imports, and Production. Exports peaked in 2021 at €2.04 million, then experienced a notable decline to €736.47 thousand in 2025. In contrast, Imports remained relatively stable, with a slight increase from €2.82 million in 2019 to €3.45 million in 2023 before decreasing slightly to €3.45 million in 2025. Production peaked in 2020 at €7.12 billion before gradually decreasing to €6.52 billion in 2025. The market may have experienced a decline in Exports due to changing consumer preferences towards more diverse food options or economic factors impacting trading partners. Stable Imports suggest consistent demand or efficient supply chain management. The fluctuation in Production could be influenced by factors like raw material costs or technological advancements affecting manufacturing processes in the soup industry, aligning with global trends towards healthier eating habits or sustainability in food production.
Key Highlights of the Report:
- Estonia Soup Market Outlook
- Market Size of Estonia Soup Market, 2025
- Forecast of Estonia Soup Market, 2032
- Historical Data and Forecast of Estonia Soup Revenues & Volume for the Period 2022 - 2032
- Estonia Soup Market Trend Evolution
- Estonia Soup Market Drivers and Challenges
- Estonia Soup Price Trends
- Estonia Soup Porter's Five Forces
- Estonia Soup Industry Life Cycle
- Historical Data and Forecast of Estonia Soup Market Revenues & Volume By Category for the Period 2022 - 2032
- Historical Data and Forecast of Estonia Soup Market Revenues & Volume By Vegetarian Soup for the Period 2022 - 2032
- Historical Data and Forecast of Estonia Soup Market Revenues & Volume By Non-Vegetarian Soup for the Period 2022 - 2032
- Historical Data and Forecast of Estonia Soup Market Revenues & Volume By Type for the Period 2022 - 2032
- Historical Data and Forecast of Estonia Soup Market Revenues & Volume By Dehydrated for the Period 2022 - 2032
- Historical Data and Forecast of Estonia Soup Market Revenues & Volume By Instant for the Period 2022 - 2032
- Historical Data and Forecast of Estonia Soup Market Revenues & Volume By Canned/Preserved for the Period 2022 - 2032
- Historical Data and Forecast of Estonia Soup Market Revenues & Volume By Chilled for the Period 2022 - 2032
- Historical Data and Forecast of Estonia Soup Market Revenues & Volume By Frozen for the Period 2022 - 2032
- Historical Data and Forecast of Estonia Soup Market Revenues & Volume By UHT for the Period 2022 - 2032
- Historical Data and Forecast of Estonia Soup Market Revenues & Volume By Others for the Period 2022 - 2032
- Historical Data and Forecast of Estonia Soup Market Revenues & Volume By Packaging for the Period 2022 - 2032
- Historical Data and Forecast of Estonia Soup Market Revenues & Volume By Canned for the Period 2022 - 2032
- Historical Data and Forecast of Estonia Soup Market Revenues & Volume By Pouch for the Period 2022 - 2032
- Historical Data and Forecast of Estonia Soup Market Revenues & Volume By Other for the Period 2022 - 2032
- Historical Data and Forecast of Estonia Soup Market Revenues & Volume By Distribution Channels for the Period 2022 - 2032
- Historical Data and Forecast of Estonia Soup Market Revenues & Volume By Supermarket/Hypermarkets for the Period 2022 - 2032
- Historical Data and Forecast of Estonia Soup Market Revenues & Volume By Convenience Stores for the Period 2022 - 2032
- Historical Data and Forecast of Estonia Soup Market Revenues & Volume By Online Retail Stores for the Period 2022 - 2032
- Historical Data and Forecast of Estonia Soup Market Revenues & Volume By Others for the Period 2022 - 2032
- Estonia Soup Import Export Trade Statistics
- Market Opportunity Assessment By Category
- Market Opportunity Assessment By Type
- Market Opportunity Assessment By Packaging
- Market Opportunity Assessment By Distribution Channels
- Estonia Soup Top Companies Market Share
- Estonia Soup Competitive Benchmarking By Technical and Operational Parameters
- Estonia Soup Company Profiles
- Estonia Soup Key Strategic Recommendations
Frequently Asked Questions About the Market Study (FAQs):
6Wresearch actively monitors the Estonia Soup Market and publishes its comprehensive annual report, highlighting emerging trends, growth drivers, revenue analysis, and forecast outlook. Our insights help businesses to make data-backed strategic decisions with ongoing market dynamics. Our analysts track relevent industries related to the Estonia Soup Market, allowing our clients with actionable intelligence and reliable forecasts tailored to emerging regional needs.
Yes, we provide customisation as per your requirements. To learn more, feel free to contact us on sales@6wresearch.com
1 Executive Summary |
2 Introduction |
2.1 Key Highlights of the Report |
2.2 Report Description |
2.3 Market Scope & Segmentation |
2.4 Research Methodology |
2.5 Assumptions |
3 Estonia Soup Market Overview |
3.1 Estonia Country Macro Economic Indicators |
3.2 Estonia Soup Market Revenues & Volume, 2022 & 2032F |
3.3 Estonia Soup Market - Industry Life Cycle |
3.4 Estonia Soup Market - Porter's Five Forces |
3.5 Estonia Soup Market Revenues & Volume Share, By Category, 2022 & 2032F |
3.6 Estonia Soup Market Revenues & Volume Share, By Type, 2022 & 2032F |
3.7 Estonia Soup Market Revenues & Volume Share, By Packaging, 2022 & 2032F |
3.8 Estonia Soup Market Revenues & Volume Share, By Distribution Channels, 2022 & 2032F |
4 Estonia Soup Market Dynamics |
4.1 Impact Analysis |
4.2 Market Drivers |
4.3 Market Restraints |
5 Estonia Soup Market Trends |
6 Estonia Soup Market, By Types |
6.1 Estonia Soup Market, By Category |
6.1.1 Overview and Analysis |
6.1.2 Estonia Soup Market Revenues & Volume, By Category, 2022 - 2032F |
6.1.3 Estonia Soup Market Revenues & Volume, By Vegetarian Soup, 2022 - 2032F |
6.1.4 Estonia Soup Market Revenues & Volume, By Non-Vegetarian Soup, 2022 - 2032F |
6.2 Estonia Soup Market, By Type |
6.2.1 Overview and Analysis |
6.2.2 Estonia Soup Market Revenues & Volume, By Dehydrated, 2022 - 2032F |
6.2.3 Estonia Soup Market Revenues & Volume, By Instant, 2022 - 2032F |
6.2.4 Estonia Soup Market Revenues & Volume, By Canned/Preserved, 2022 - 2032F |
6.2.5 Estonia Soup Market Revenues & Volume, By Chilled, 2022 - 2032F |
6.2.6 Estonia Soup Market Revenues & Volume, By Frozen, 2022 - 2032F |
6.2.7 Estonia Soup Market Revenues & Volume, By UHT, 2022 - 2032F |
6.3 Estonia Soup Market, By Packaging |
6.3.1 Overview and Analysis |
6.3.2 Estonia Soup Market Revenues & Volume, By Canned, 2022 - 2032F |
6.3.3 Estonia Soup Market Revenues & Volume, By Pouch, 2022 - 2032F |
6.3.4 Estonia Soup Market Revenues & Volume, By Other, 2022 - 2032F |
6.4 Estonia Soup Market, By Distribution Channels |
6.4.1 Overview and Analysis |
6.4.2 Estonia Soup Market Revenues & Volume, By Supermarket/Hypermarkets, 2022 - 2032F |
6.4.3 Estonia Soup Market Revenues & Volume, By Convenience Stores, 2022 - 2032F |
6.4.4 Estonia Soup Market Revenues & Volume, By Online Retail Stores, 2022 - 2032F |
6.4.5 Estonia Soup Market Revenues & Volume, By Others, 2022 - 2032F |
7 Estonia Soup Market Import-Export Trade Statistics |
7.1 Estonia Soup Market Export to Major Countries |
7.2 Estonia Soup Market Imports from Major Countries |
8 Estonia Soup Market Key Performance Indicators |
9 Estonia Soup Market - Opportunity Assessment |
9.1 Estonia Soup Market Opportunity Assessment, By Category, 2022 & 2032F |
9.2 Estonia Soup Market Opportunity Assessment, By Type, 2022 & 2032F |
9.3 Estonia Soup Market Opportunity Assessment, By Packaging, 2022 & 2032F |
9.4 Estonia Soup Market Opportunity Assessment, By Distribution Channels, 2022 & 2032F |
10 Estonia Soup Market - Competitive Landscape |
10.1 Estonia Soup Market Revenue Share, By Companies, 2025 |
10.2 Estonia Soup Market Competitive Benchmarking, By Operating and Technical Parameters |
11 Company Profiles |
12 Recommendations |
13 Disclaimer |
Global Go To Market Strategy - 2030
Export potential enables firms to identify high-growth global markets with greater confidence by combining advanced trade intelligence with a structured quantitative methodology. The framework analyzes emerging demand trends and country-level import patterns while integrating macroeconomic and trade datasets such as GDP and population forecasts, bilateral import–export flows, tariff structures, elasticity differentials between developed and developing economies, geographic distance, and import demand projections. Using weighted trade values from 2020–2024 as the base period to project country-to-country export potential for 2030, these inputs are operationalized through calculated drivers such as gravity model parameters, tariff impact factors, and projected GDP per-capita growth. Through an analysis of hidden potentials, demand hotspots, and market conditions that are most favorable to success, this method enables firms to focus on target countries, maximize returns, and global expansion with data, backed by accuracy.
By factoring in the projected importer demand gap that is currently unmet and could be potential opportunity, it identifies the potential for the Exporter (Country) among 190 countries, against the general trade analysis, which identifies the biggest importer or exporter.
To discover high-growth global markets and optimize your business strategy:
Click Here
Pricing
- Single User License$ 1,995
- Department License$ 2,400
- Site License$ 3,120
- Global License$ 3,795

Leadership Perspectives from Industry Events
Search
Thought Leadership and Analyst Meet


Our Clients
6WResearch In News
- Doha a strategic location for EV manufacturing hub: IPA Qatar
- Demand for luxury TVs surging in the GCC, says Samsung
- Empowering Growth: The Thriving Journey of Bangladesh’s Cable Industry
- Demand for luxury TVs surging in the GCC, says Samsung
- Video call with a traditional healer? Once unthinkable, it’s now common in South Africa
- Intelligent Buildings To Smooth GCC’s Path To Net Zero
Latest Reports
- Cape Verde Portable Hand-Thrown Extinguisher Market (2026-2032)
- Canada Portable Hand-Thrown Extinguisher Market (2026-2032)
- Cameroon Portable Hand-Thrown Extinguisher Market (2026-2032)
- Burundi Portable Hand-Thrown Extinguisher Market (2026-2032)
- Burkina Faso Portable Hand-Thrown Extinguisher Market (2026-2032)
- Bulgaria Portable Hand-Thrown Extinguisher Market (2026-2032)
- Brunei Portable Hand-Thrown Extinguisher Market (2026-2032)
- Botswana Portable Hand-Thrown Extinguisher Market (2026-2032)
- Bosnia and Herzegovina Portable Hand-Thrown Extinguisher Market (2026-2032)
- Bolivia Portable Hand-Thrown Extinguisher Market (2026-2032)
Industry Events and Analyst Meet

HIMTEX 2026

India Refining Summit 2026

India EV Show 2026

EV tech India Expo 2026

Auto Tech Asia 2026
Whitepaper
- Middle East & Africa Commercial Security Market Click here to view more.
- Middle East & Africa Fire Safety Systems & Equipment Market Click here to view more.
- GCC Drone Market Click here to view more.
- Middle East Lighting Fixture Market Click here to view more.
- GCC Physical & Perimeter Security Market Click here to view more.