Finland Action Figures Market (2025-2031) | Growth, Value, Forecast, Competitive Landscape, Share, Analysis, Outlook, Trends, Companies, Industry, Size & Revenue, Segmentation
Market Forecast By Type (Superheroes, Anime Characters, Movie Characters), By Distribution Channel (Online, Offline), By End Users (Up to 8 years, 9-15 years, 15 years and Above) And Competitive Landscape
| Product Code: ETC7189872 | Publication Date: Sep 2024 | Updated Date: Apr 2026 | Product Type: Market Research Report | |
| Publisher: 6Wresearch | Author: Sumit Sagar | No. of Pages: 75 | No. of Figures: 35 | No. of Tables: 20 |
Finland Action Figures Market Size (2020-2030)
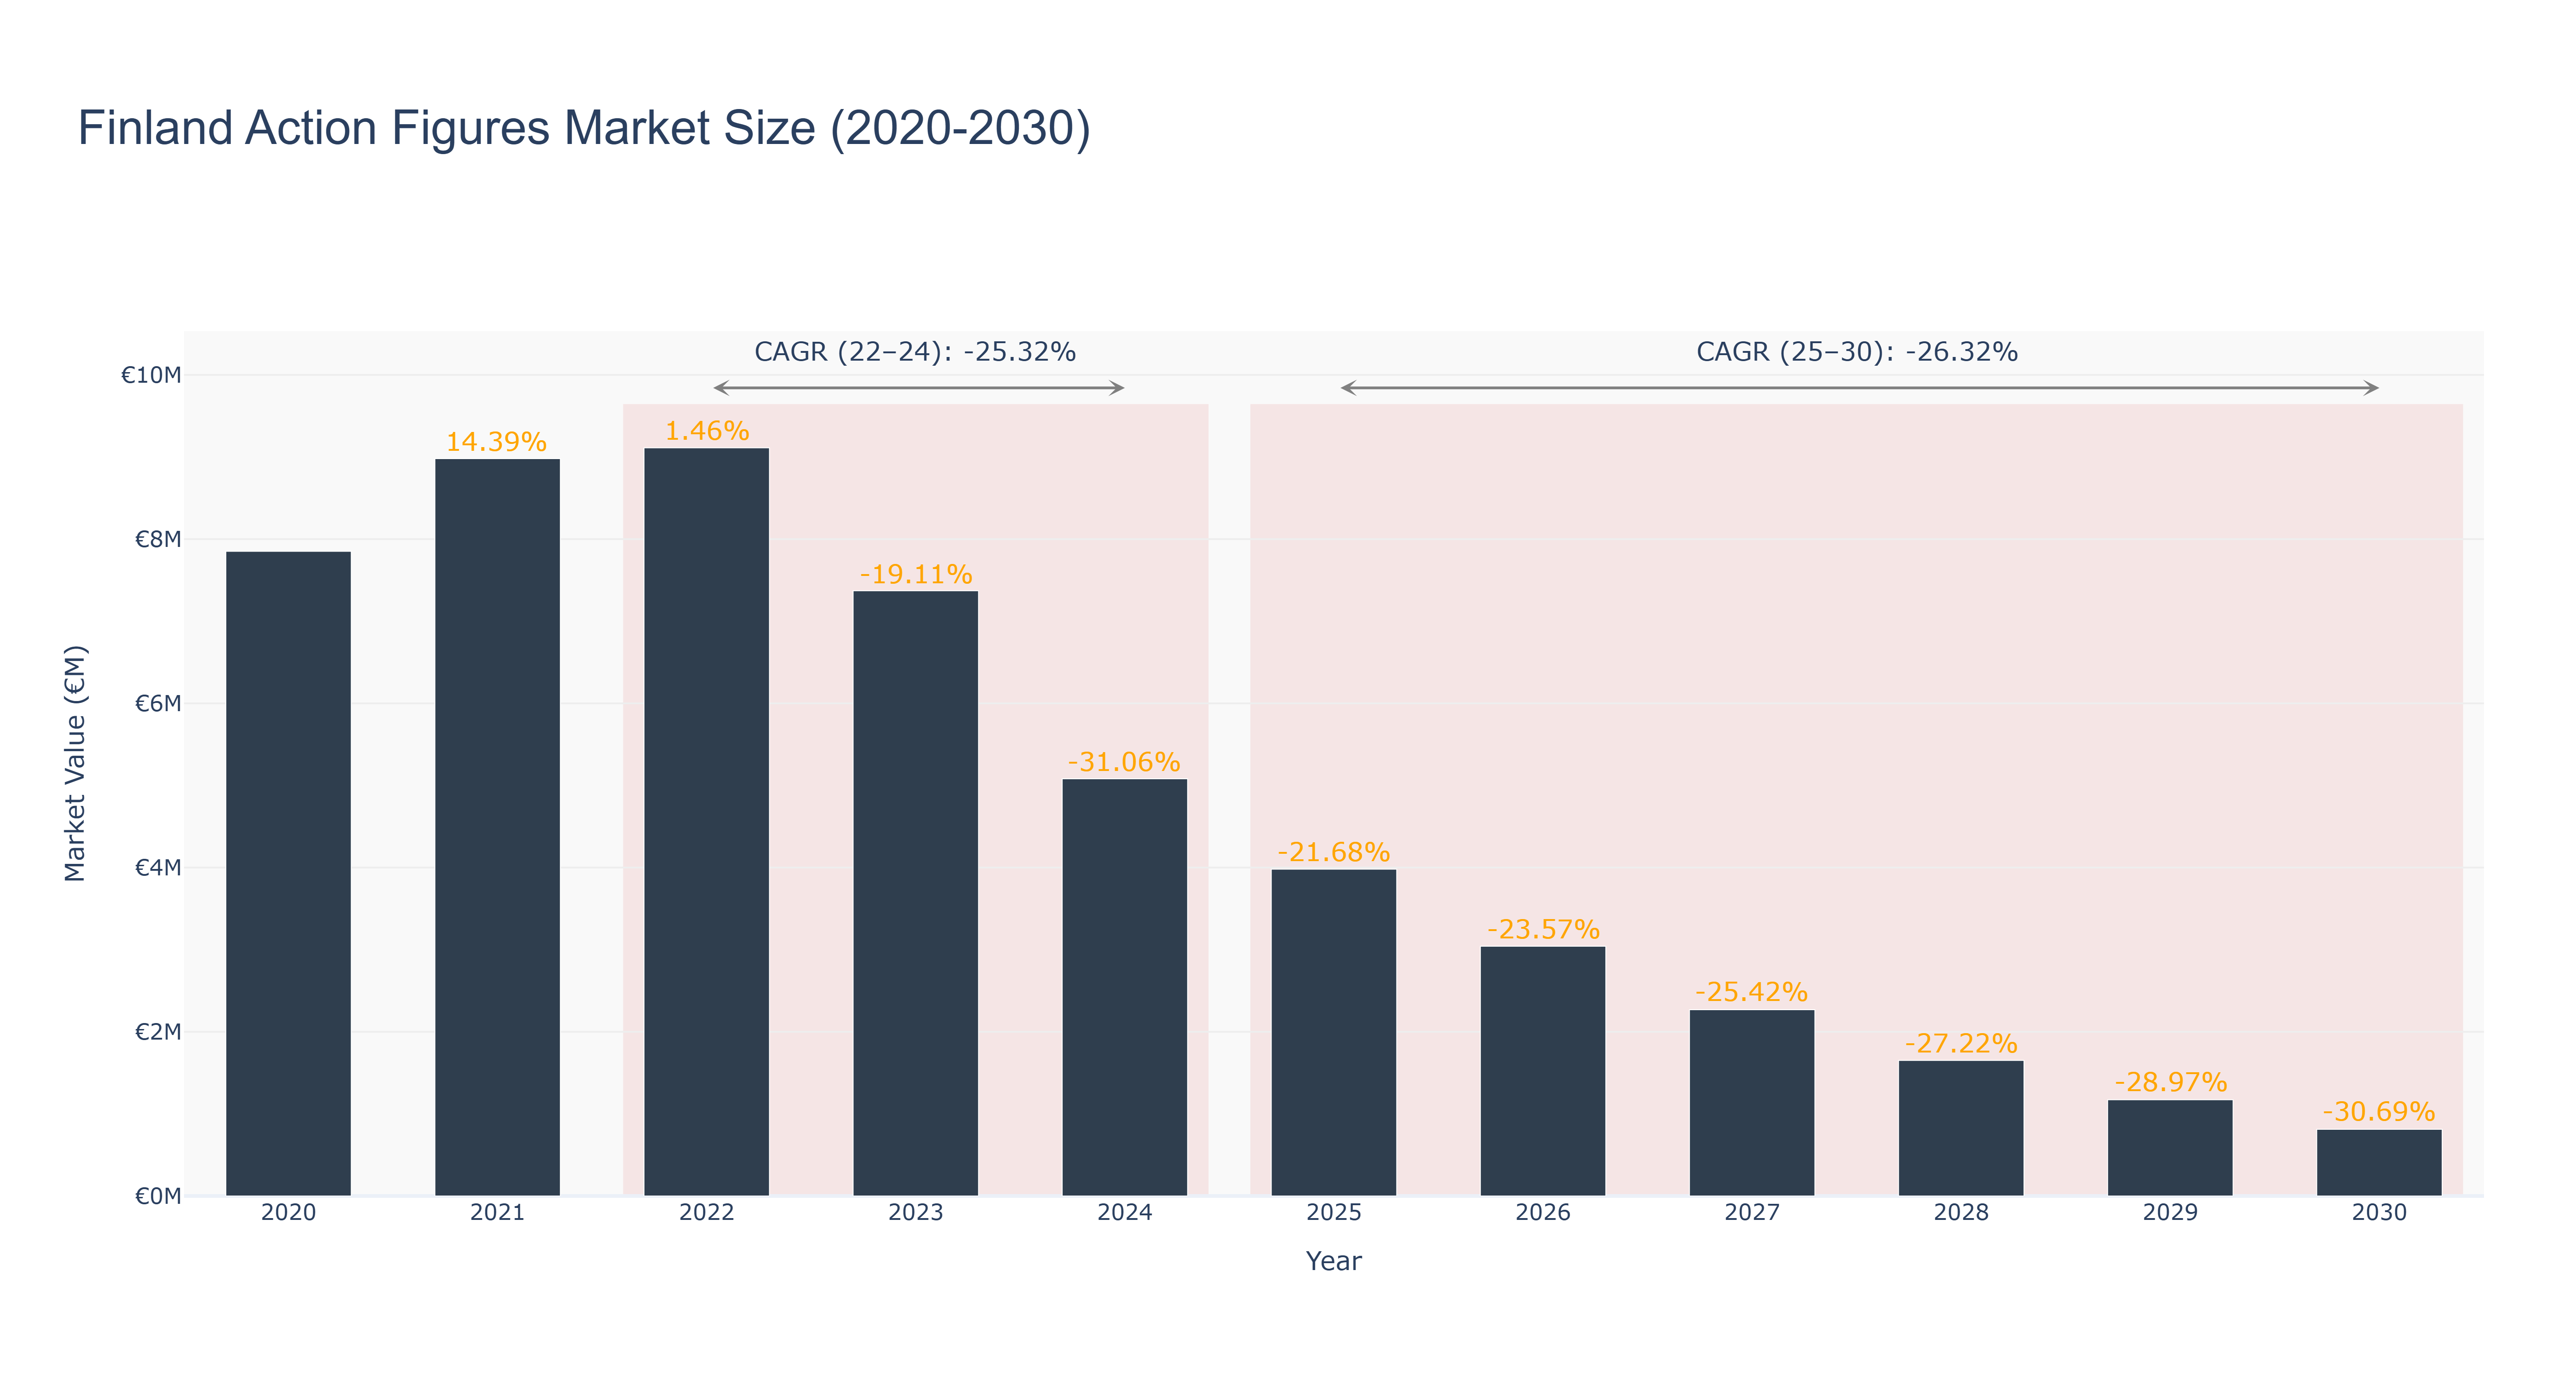
The Finland Action Figures Market witnessed a peak market size of €9.11 million in 2022. However, the market experienced a significant decline, with the market size dropping to €3.04 million in 2026. This downward trend is attributed to a combination of factors such as changing consumer preferences, economic uncertainties, and increased competition. The forecasted market size from 2025 to 2030 indicates a continued downward trajectory, with a CAGR of -26.32%. Despite the current challenges, the market is poised for potential growth with upcoming initiatives to enhance product innovation, expand distribution channels, and strengthen marketing strategies. These industry drivers aim to revitalize the market and drive future growth, positioning Finland as a key player in the action figures market segment.
Finland Action Figures Market: Production & Trade Performance (2019-2025)
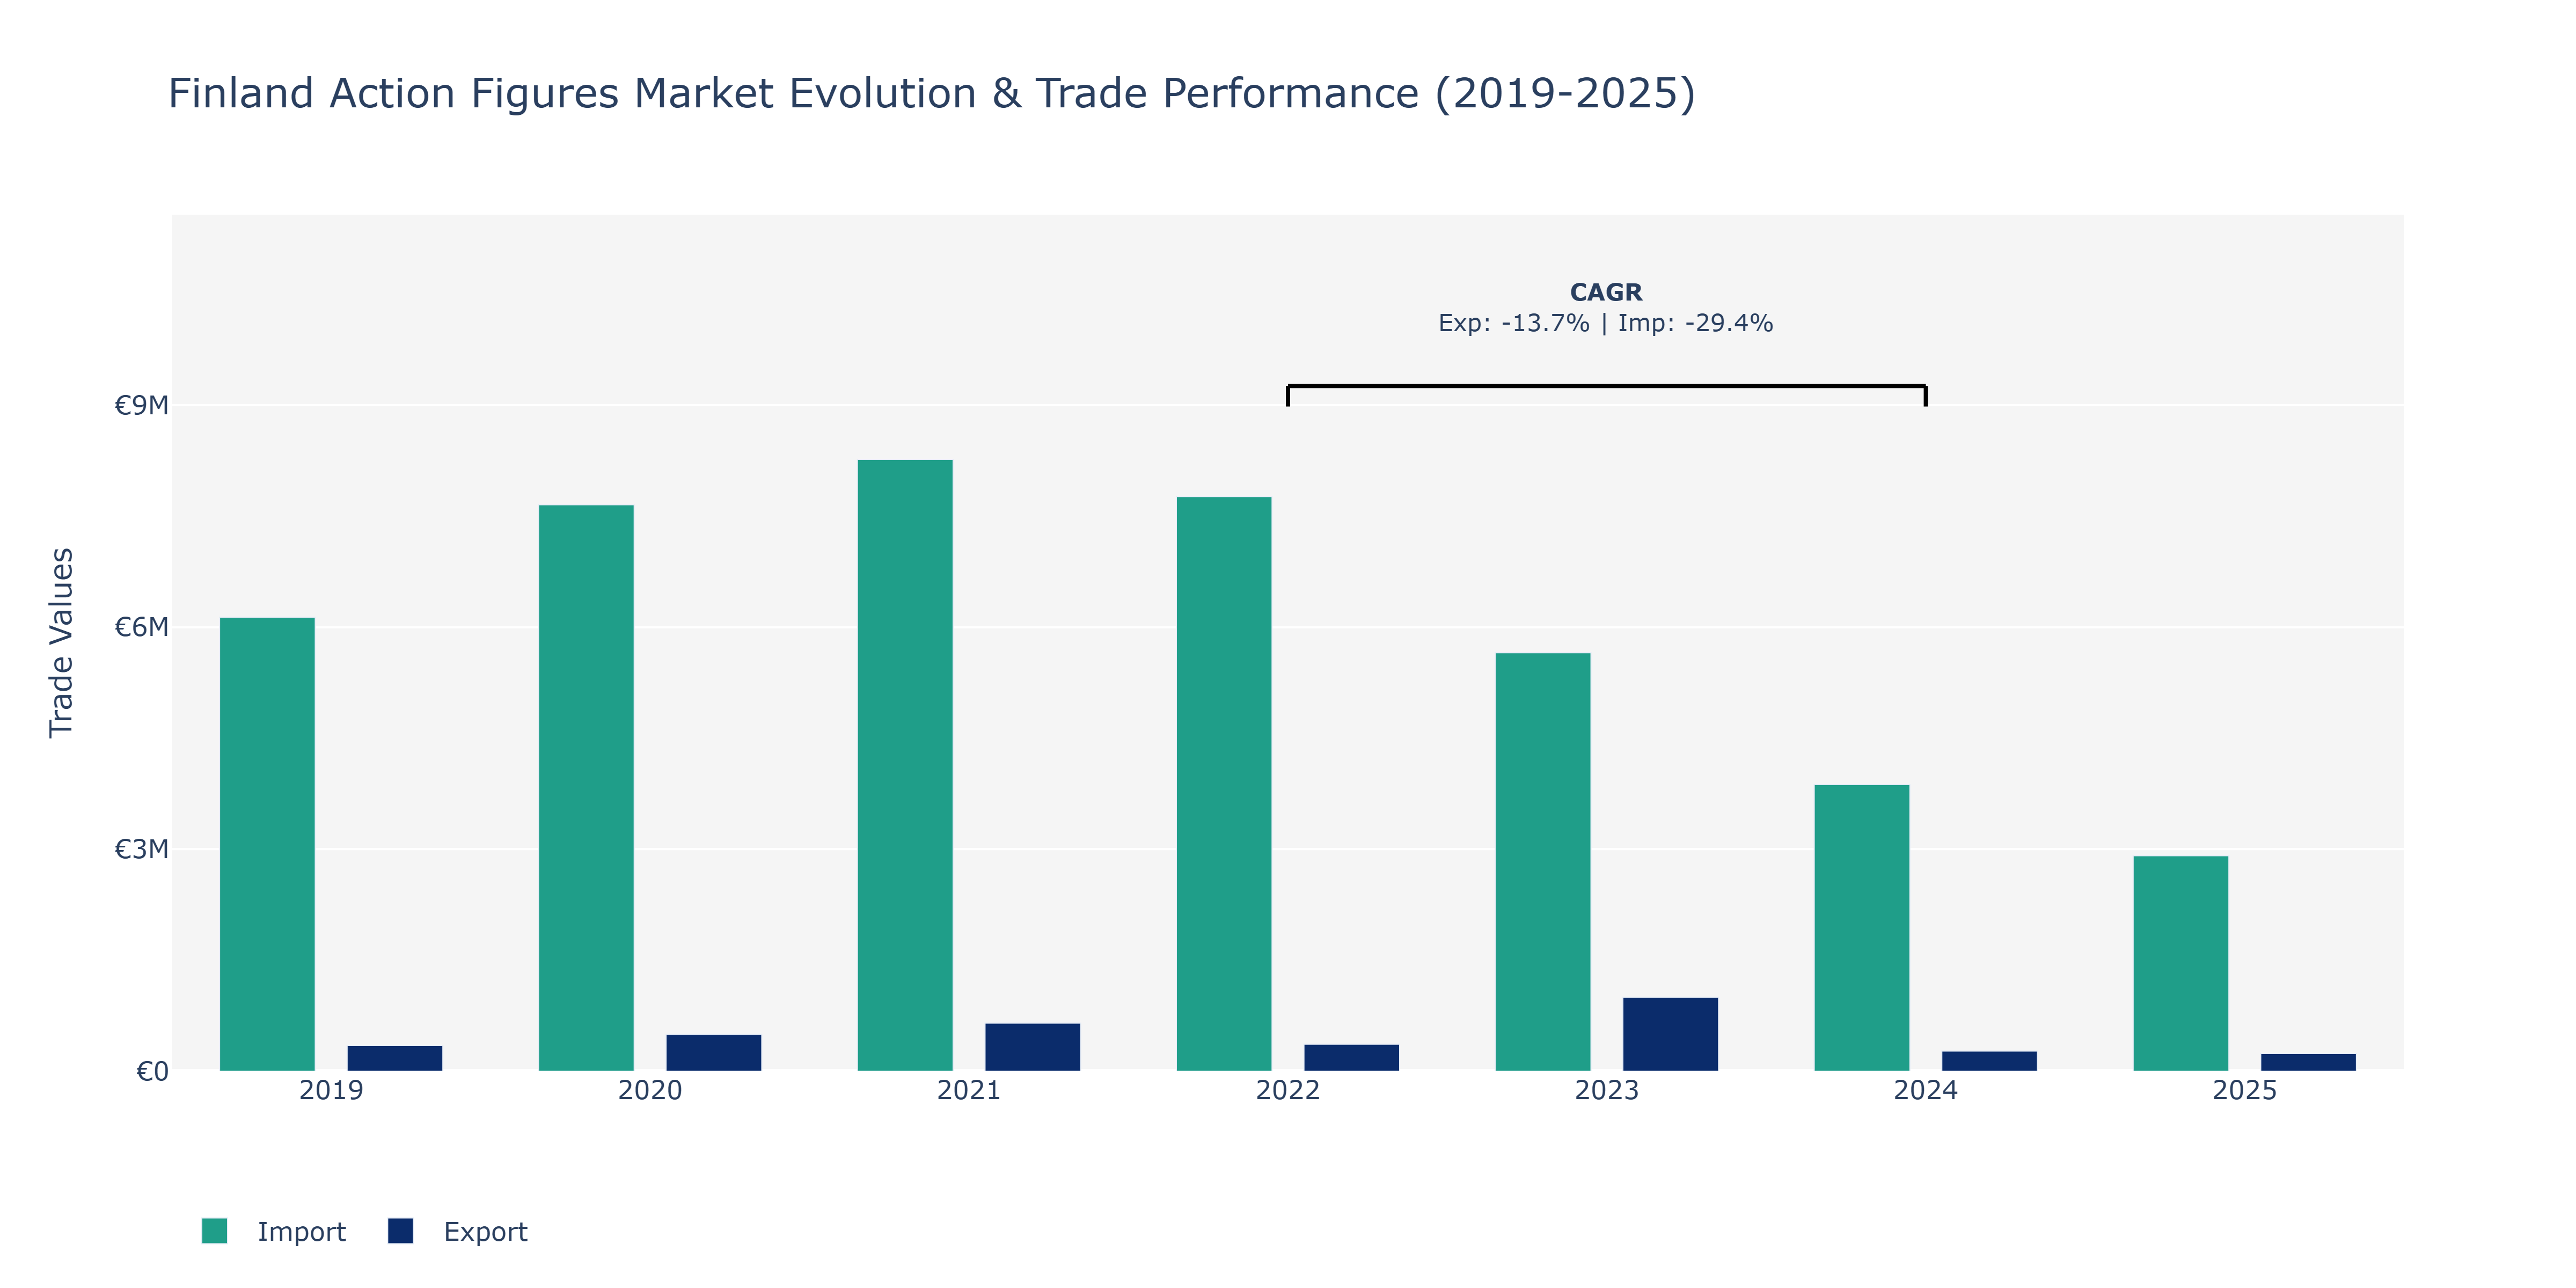
In the Finland Action Figures Market, both exports and imports exhibited notable fluctuations during the period analyzed. Exports peaked in 2023, reaching approximately €997.56 thousand before experiencing a sharp decline in 2024 to €271.74 thousand. This significant drop could be attributed to various factors such as changes in consumer demand, global economic conditions, or shifts in market dynamics impacting the export of action figures. On the other hand, imports also saw fluctuations, with the highest value recorded in 2021 at €8.27 million. The subsequent decrease in imports in 2025 to around €2.91 million might indicate shifts in sourcing strategies, changes in trade agreements, or adjustments in inventory management. These movements highlight the market's sensitivity to external factors and the need for players in the industry to adapt swiftly to changing conditions to maintain competitiveness.
Key Highlights of the Report:
- Finland Action Figures Market Outlook
- Market Size of Finland Action Figures Market, 2024
- Forecast of Finland Action Figures Market, 2031
- Historical Data and Forecast of Finland Action Figures Revenues & Volume for the Period 2021- 2031
- Finland Action Figures Market Trend Evolution
- Finland Action Figures Market Drivers and Challenges
- Finland Action Figures Price Trends
- Finland Action Figures Porter's Five Forces
- Finland Action Figures Industry Life Cycle
- Historical Data and Forecast of Finland Action Figures Market Revenues & Volume By Type for the Period 2021- 2031
- Historical Data and Forecast of Finland Action Figures Market Revenues & Volume By Superheroes for the Period 2021- 2031
- Historical Data and Forecast of Finland Action Figures Market Revenues & Volume By Anime Characters for the Period 2021- 2031
- Historical Data and Forecast of Finland Action Figures Market Revenues & Volume By Movie Characters for the Period 2021- 2031
- Historical Data and Forecast of Finland Action Figures Market Revenues & Volume By Distribution Channel for the Period 2021- 2031
- Historical Data and Forecast of Finland Action Figures Market Revenues & Volume By Online for the Period 2021- 2031
- Historical Data and Forecast of Finland Action Figures Market Revenues & Volume By Offline for the Period 2021- 2031
- Historical Data and Forecast of Finland Action Figures Market Revenues & Volume By End Users for the Period 2021- 2031
- Historical Data and Forecast of Finland Action Figures Market Revenues & Volume By Up to 8 years for the Period 2021- 2031
- Historical Data and Forecast of Finland Action Figures Market Revenues & Volume By 9-15 years for the Period 2021- 2031
- Historical Data and Forecast of Finland Action Figures Market Revenues & Volume By 15 years and Above for the Period 2021- 2031
- Finland Action Figures Import Export Trade Statistics
- Market Opportunity Assessment By Type
- Market Opportunity Assessment By Distribution Channel
- Market Opportunity Assessment By End Users
- Finland Action Figures Top Companies Market Share
- Finland Action Figures Competitive Benchmarking By Technical and Operational Parameters
- Finland Action Figures Company Profiles
- Finland Action Figures Key Strategic Recommendations
Frequently Asked Questions About the Market Study (FAQs):
6Wresearch actively monitors the Finland Action Figures Market and publishes its comprehensive annual report, highlighting emerging trends, growth drivers, revenue analysis, and forecast outlook. Our insights help businesses to make data-backed strategic decisions with ongoing market dynamics. Our analysts track relevent industries related to the Finland Action Figures Market, allowing our clients with actionable intelligence and reliable forecasts tailored to emerging regional needs.
Yes, we provide customisation as per your requirements. To learn more, feel free to contact us on sales@6wresearch.com
1 Executive Summary |
2 Introduction |
2.1 Key Highlights of the Report |
2.2 Report Description |
2.3 Market Scope & Segmentation |
2.4 Research Methodology |
2.5 Assumptions |
3 Finland Action Figures Market Overview |
3.1 Finland Country Macro Economic Indicators |
3.2 Finland Action Figures Market Revenues & Volume, 2021 & 2031F |
3.3 Finland Action Figures Market - Industry Life Cycle |
3.4 Finland Action Figures Market - Porter's Five Forces |
3.5 Finland Action Figures Market Revenues & Volume Share, By Type, 2021 & 2031F |
3.6 Finland Action Figures Market Revenues & Volume Share, By Distribution Channel, 2021 & 2031F |
3.7 Finland Action Figures Market Revenues & Volume Share, By End Users, 2021 & 2031F |
4 Finland Action Figures Market Dynamics |
4.1 Impact Analysis |
4.2 Market Drivers |
4.2.1 Increasing popularity of action figures among children and collectors |
4.2.2 Growing disposable income in Finland leading to higher purchasing power |
4.2.3 Innovation in design and features of action figures attracting consumers |
4.3 Market Restraints |
4.3.1 Competition from other toy categories such as electronic toys and video games |
4.3.2 Impact of economic downturn on consumer spending |
5 Finland Action Figures Market Trends |
6 Finland Action Figures Market, By Types |
6.1 Finland Action Figures Market, By Type |
6.1.1 Overview and Analysis |
6.1.2 Finland Action Figures Market Revenues & Volume, By Type, 2021- 2031F |
6.1.3 Finland Action Figures Market Revenues & Volume, By Superheroes, 2021- 2031F |
6.1.4 Finland Action Figures Market Revenues & Volume, By Anime Characters, 2021- 2031F |
6.1.5 Finland Action Figures Market Revenues & Volume, By Movie Characters, 2021- 2031F |
6.2 Finland Action Figures Market, By Distribution Channel |
6.2.1 Overview and Analysis |
6.2.2 Finland Action Figures Market Revenues & Volume, By Online, 2021- 2031F |
6.2.3 Finland Action Figures Market Revenues & Volume, By Offline, 2021- 2031F |
6.3 Finland Action Figures Market, By End Users |
6.3.1 Overview and Analysis |
6.3.2 Finland Action Figures Market Revenues & Volume, By Up to 8 years, 2021- 2031F |
6.3.3 Finland Action Figures Market Revenues & Volume, By 9-15 years, 2021- 2031F |
6.3.4 Finland Action Figures Market Revenues & Volume, By 15 years and Above, 2021- 2031F |
7 Finland Action Figures Market Import-Export Trade Statistics |
7.1 Finland Action Figures Market Export to Major Countries |
7.2 Finland Action Figures Market Imports from Major Countries |
8 Finland Action Figures Market Key Performance Indicators |
8.1 Average selling price of action figures |
8.2 Number of new product launches in the market |
8.3 Consumer engagement and brand loyalty through social media campaigns and events |
8.4 Retail presence and distribution channels for action figures in Finland |
8.5 Market penetration rate of action figures among different age groups and demographics |
9 Finland Action Figures Market - Opportunity Assessment |
9.1 Finland Action Figures Market Opportunity Assessment, By Type, 2021 & 2031F |
9.2 Finland Action Figures Market Opportunity Assessment, By Distribution Channel, 2021 & 2031F |
9.3 Finland Action Figures Market Opportunity Assessment, By End Users, 2021 & 2031F |
10 Finland Action Figures Market - Competitive Landscape |
10.1 Finland Action Figures Market Revenue Share, By Companies, 2024 |
10.2 Finland Action Figures Market Competitive Benchmarking, By Operating and Technical Parameters |
11 Company Profiles |
12 Recommendations |
13 Disclaimer |
Global Go To Market Strategy - 2030
Export potential enables firms to identify high-growth global markets with greater confidence by combining advanced trade intelligence with a structured quantitative methodology. The framework analyzes emerging demand trends and country-level import patterns while integrating macroeconomic and trade datasets such as GDP and population forecasts, bilateral import–export flows, tariff structures, elasticity differentials between developed and developing economies, geographic distance, and import demand projections. Using weighted trade values from 2020–2024 as the base period to project country-to-country export potential for 2030, these inputs are operationalized through calculated drivers such as gravity model parameters, tariff impact factors, and projected GDP per-capita growth. Through an analysis of hidden potentials, demand hotspots, and market conditions that are most favorable to success, this method enables firms to focus on target countries, maximize returns, and global expansion with data, backed by accuracy.
By factoring in the projected importer demand gap that is currently unmet and could be potential opportunity, it identifies the potential for the Exporter (Country) among 190 countries, against the general trade analysis, which identifies the biggest importer or exporter.
To discover high-growth global markets and optimize your business strategy:
Click Here
Pricing
- Single User License$ 1,995
- Department License$ 2,400
- Site License$ 3,120
- Global License$ 3,795

Leadership Perspectives from Industry Events
Search
Thought Leadership and Analyst Meet


Our Clients
6WResearch In News
- Doha a strategic location for EV manufacturing hub: IPA Qatar
- Demand for luxury TVs surging in the GCC, says Samsung
- Empowering Growth: The Thriving Journey of Bangladesh’s Cable Industry
- Demand for luxury TVs surging in the GCC, says Samsung
- Video call with a traditional healer? Once unthinkable, it’s now common in South Africa
- Intelligent Buildings To Smooth GCC’s Path To Net Zero
Latest Reports
- Cape Verde Portable Hand-Thrown Extinguisher Market (2026-2032)
- Canada Portable Hand-Thrown Extinguisher Market (2026-2032)
- Cameroon Portable Hand-Thrown Extinguisher Market (2026-2032)
- Burundi Portable Hand-Thrown Extinguisher Market (2026-2032)
- Burkina Faso Portable Hand-Thrown Extinguisher Market (2026-2032)
- Bulgaria Portable Hand-Thrown Extinguisher Market (2026-2032)
- Brunei Portable Hand-Thrown Extinguisher Market (2026-2032)
- Botswana Portable Hand-Thrown Extinguisher Market (2026-2032)
- Bosnia and Herzegovina Portable Hand-Thrown Extinguisher Market (2026-2032)
- Bolivia Portable Hand-Thrown Extinguisher Market (2026-2032)
Industry Events and Analyst Meet

HIMTEX 2026

India Refining Summit 2026

India EV Show 2026

EV tech India Expo 2026

Auto Tech Asia 2026
Whitepaper
- Middle East & Africa Commercial Security Market Click here to view more.
- Middle East & Africa Fire Safety Systems & Equipment Market Click here to view more.
- GCC Drone Market Click here to view more.
- Middle East Lighting Fixture Market Click here to view more.
- GCC Physical & Perimeter Security Market Click here to view more.