Finland Cocoa butter Market (2026-2032) | Segmentation, Forecast, Trends, Outlook, Analysis, Value, Size, Revenue, Growth, Industry, Share & Companies
Market Forecast By Types (organic, conventional, deodorized), By Form (solid, Liquid), By End-user (Food Industry, Pharmaceutical Industry, Aromatherapy, Cosmetics, Personal Care Industry), By Packaging (Tins, Cartons, Plastic Containers, Paper Containers, Others), By Distribution Channel (Direct Sales, Indirect Sales) And Competitive Landscape
| Product Code: ETC4711427 | Publication Date: Nov 2023 | Updated Date: Apr 2026 | Product Type: Market Research Report | |
| Publisher: 6Wresearch | Author: Shubham Padhi | No. of Pages: 60 | No. of Figures: 30 | No. of Tables: 5 |
Finland Cocoa Butter Market Size (2020-2030)
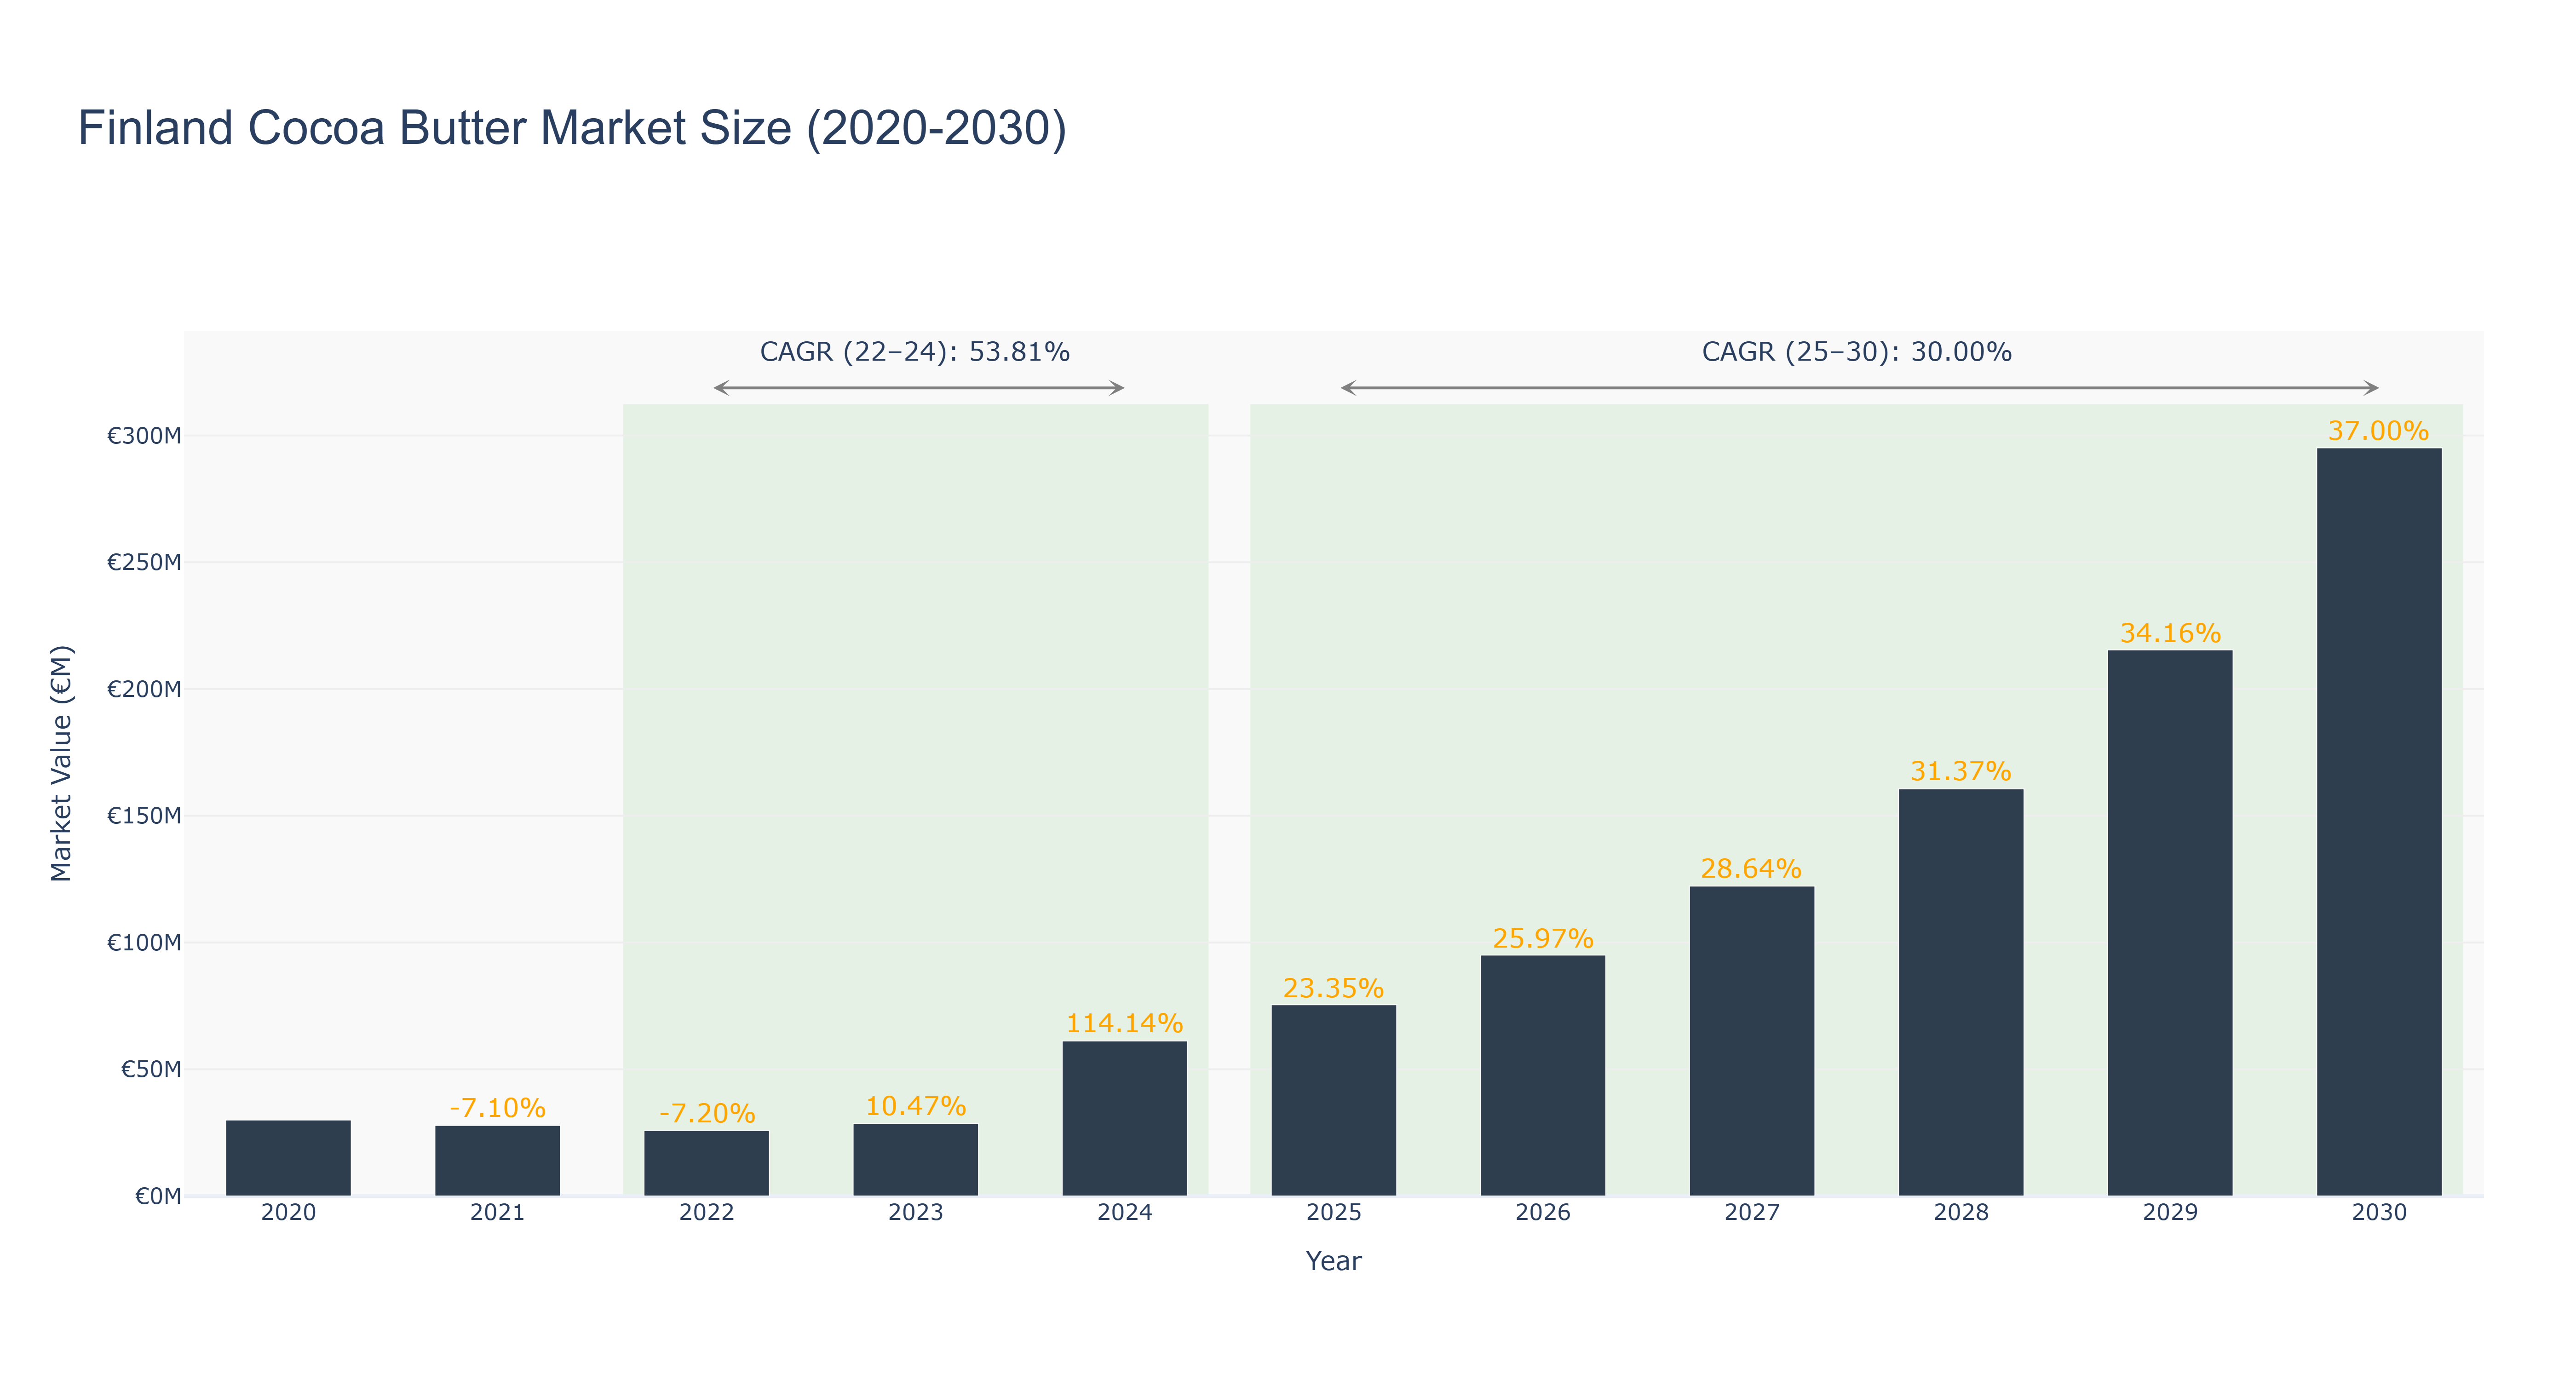
Finland Cocoa Butter Market has shown a remarkable growth trajectory over the years. The market peaked in 2030 with a size of €295.17 million. From 2020 to 2024, the market size saw substantial growth, reaching €61.15 million in 2024. The forecasted market size from 2025 to 2030 is expected to continue this upward trend, with a CAGR of 30.0%. The market experienced a significant downturn in 2021 and 2022, possibly due to external economic factors impacting consumer spending. However, the subsequent years saw impressive growth rates driven by increasing consumer awareness of health benefits associated with cocoa butter products. Looking ahead, Finland is set to introduce new sustainability initiatives in the cocoa industry, focusing on ethical sourcing practices and environmental conservation efforts to meet growing consumer demands for responsible products.
Finland Cocoa Butter Market: Production & Trade Performance (2019-2025)
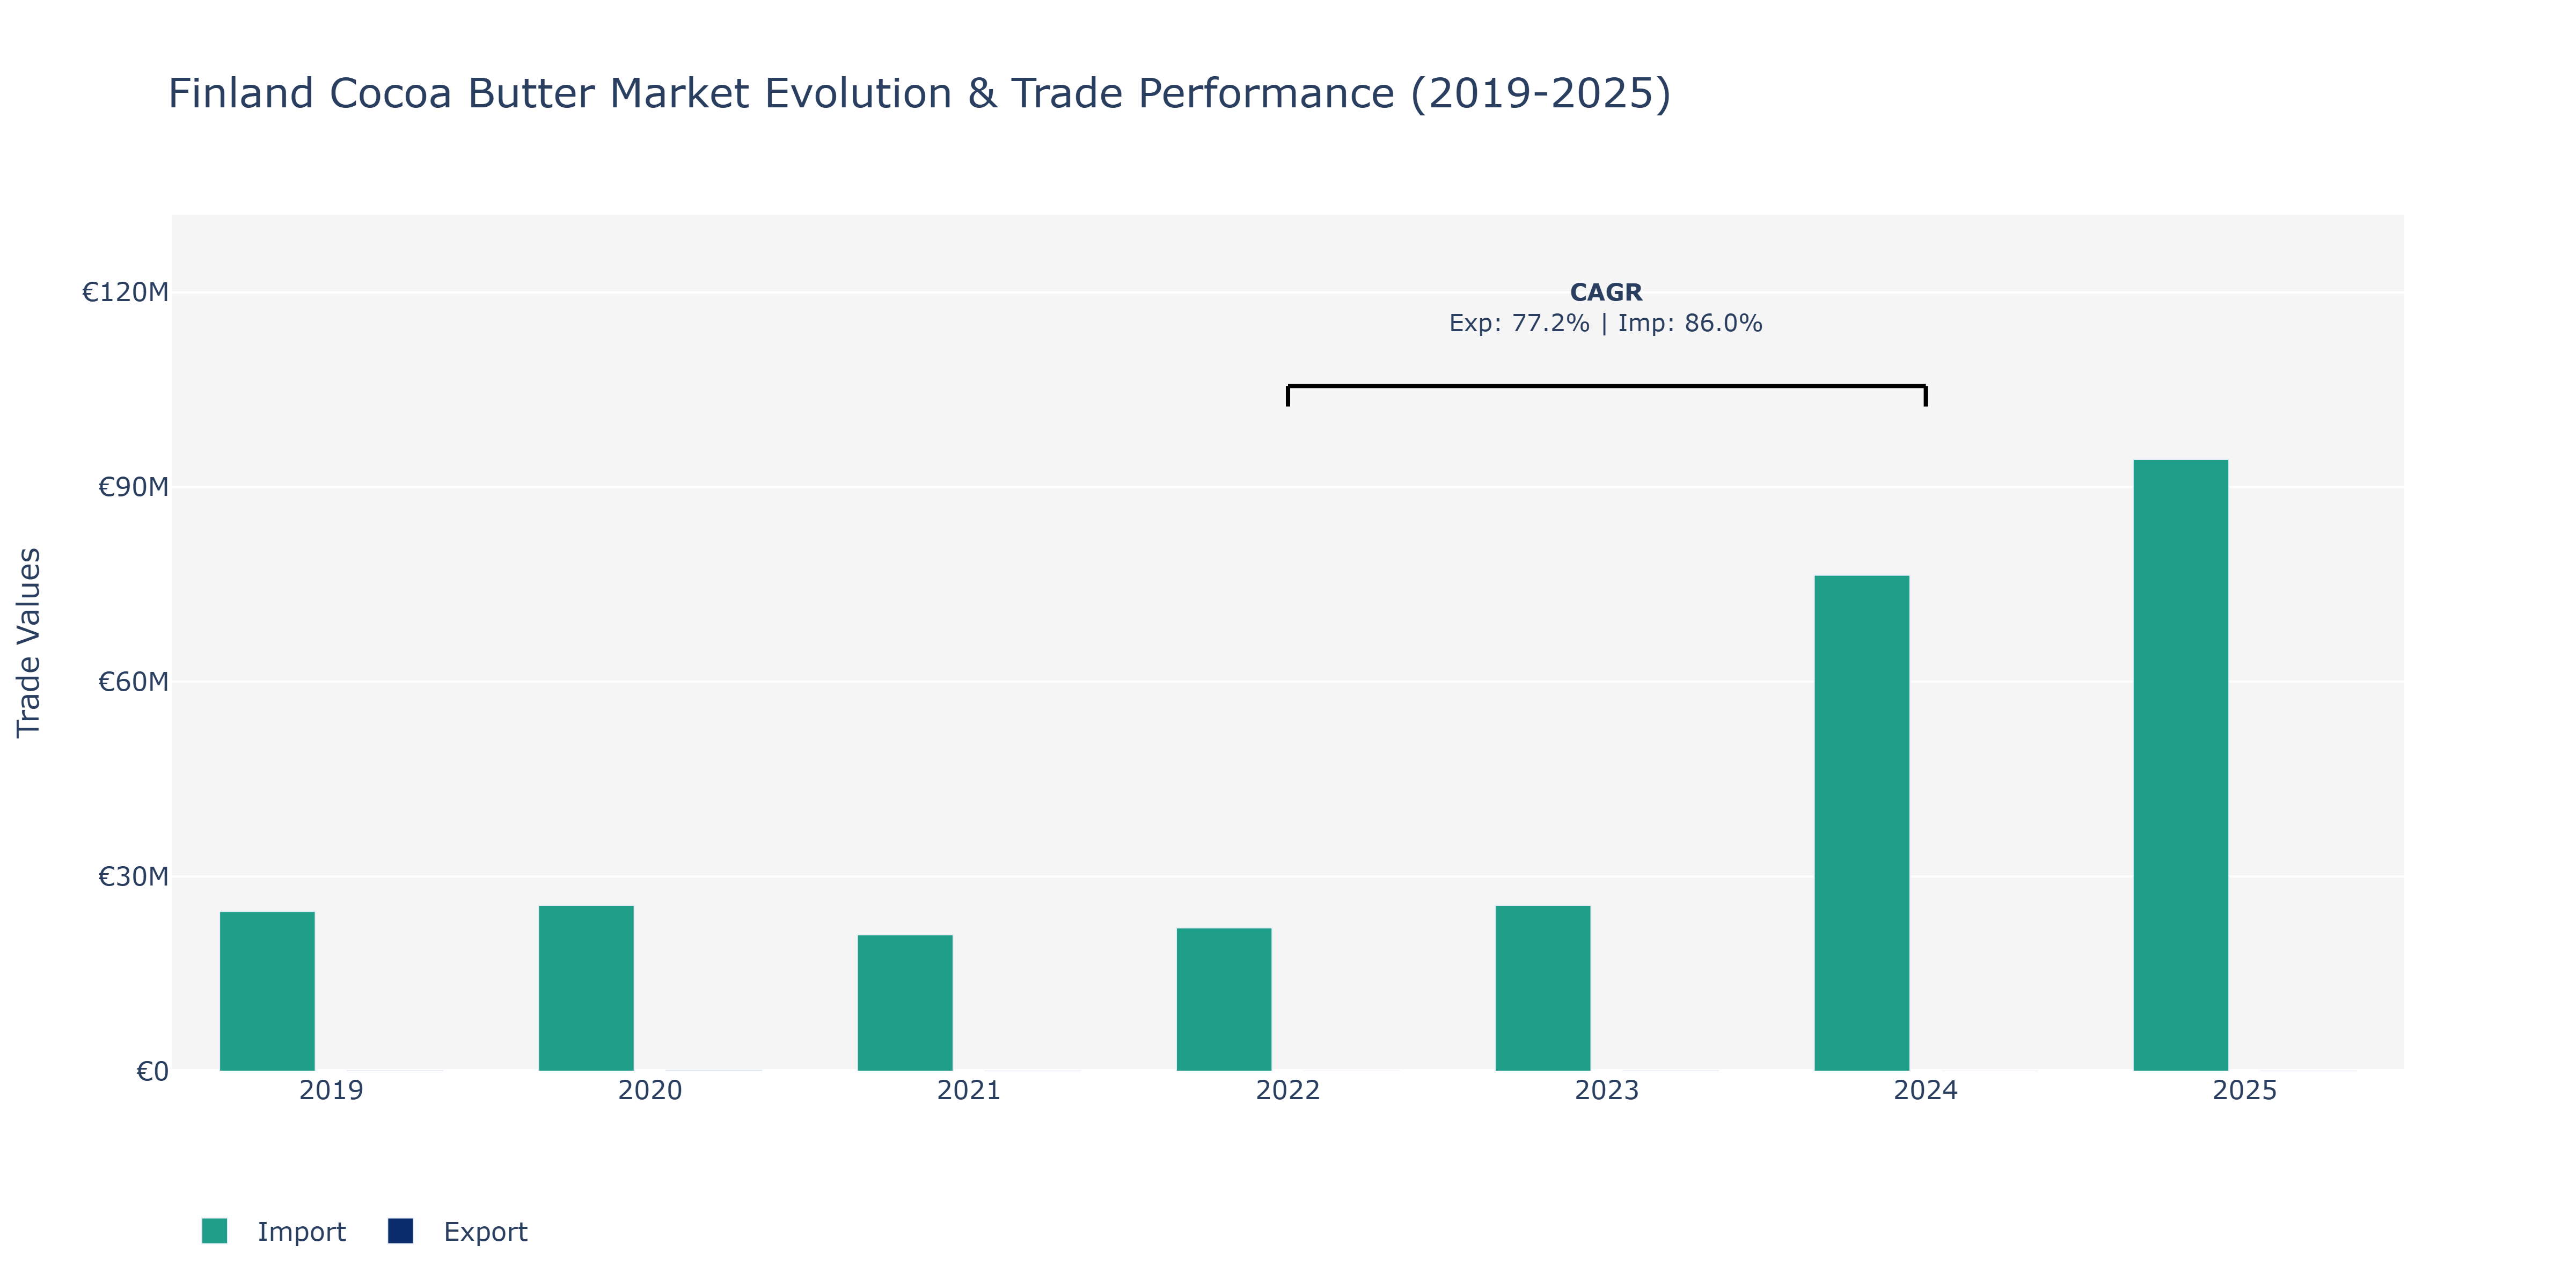
Between 2019 and 2025, Finland's Cocoa Butter market witnessed notable fluctuations in both exports and imports. In 2019, exports were at €67.64 thousand, dropping significantly in 2021 to €26.49 thousand before a slight recovery in 2023 to €45.03 thousand. Conversely, imports displayed a contrasting trend, starting at €24.61 million in 2019, reaching a peak of €94.26 million in 2025. The market experienced a substantial increase in imports from 2022 to 2024, with a notable Compound Annual Growth Rate (CAGR) of 86.02%. These fluctuations can be attributed to various factors such as global demand shifts, changes in consumer preferences, and supply chain disruptions. For instance, the surge in imports could be linked to increased demand for cocoa butter-based products in Finland, possibly due to changing consumer tastes or growth in the food and cosmetic industries. These trends highlight the market's sensitivity to external factors and the importance of adaptability for businesses operating in the cocoa butter sector.
Key Highlights of the Report:
- Finland Cocoa butter Market Outlook
- Market Size of Finland Cocoa butter Market, 2025
- Forecast of Finland Cocoa butter Market, 2032
- Historical Data and Forecast of Finland Cocoa butter Revenues & Volume for the Period 2022 - 2032F
- Finland Cocoa butter Market Trend Evolution
- Finland Cocoa butter Market Drivers and Challenges
- Finland Cocoa butter Price Trends
- Finland Cocoa butter Porter`s Five Forces
- Finland Cocoa butter Industry Life Cycle
- Historical Data and Forecast of Finland Cocoa butter Market Revenues & Volume By Types for the Period 2022 - 2032F
- Historical Data and Forecast of Finland Cocoa butter Market Revenues & Volume By organic for the Period 2022 - 2032F
- Historical Data and Forecast of Finland Cocoa butter Market Revenues & Volume By conventional for the Period 2022 - 2032F
- Historical Data and Forecast of Finland Cocoa butter Market Revenues & Volume By deodorized for the Period 2022 - 2032F
- Historical Data and Forecast of Finland Cocoa butter Market Revenues & Volume By Form for the Period 2022 - 2032F
- Historical Data and Forecast of Finland Cocoa butter Market Revenues & Volume By solid for the Period 2022 - 2032F
- Historical Data and Forecast of Finland Cocoa butter Market Revenues & Volume By Liquid for the Period 2022 - 2032F
- Historical Data and Forecast of Finland Cocoa butter Market Revenues & Volume By End-user for the Period 2022 - 2032F
- Historical Data and Forecast of Finland Cocoa butter Market Revenues & Volume By Food Industry for the Period 2022 - 2032F
- Historical Data and Forecast of Finland Cocoa butter Market Revenues & Volume By Pharmaceutical Industry for the Period 2022 - 2032F
- Historical Data and Forecast of Finland Cocoa butter Market Revenues & Volume By Aromatherapy for the Period 2022 - 2032F
- Historical Data and Forecast of Finland Cocoa butter Market Revenues & Volume By Cosmetics for the Period 2022 - 2032F
- Historical Data and Forecast of Finland Cocoa butter Market Revenues & Volume By Personal Care Industry for the Period 2022 - 2032F
- Historical Data and Forecast of Finland Cocoa butter Market Revenues & Volume By Packaging for the Period 2022 - 2032F
- Historical Data and Forecast of Finland Cocoa butter Market Revenues & Volume By Tins for the Period 2022 - 2032F
- Historical Data and Forecast of Finland Cocoa butter Market Revenues & Volume By Cartons for the Period 2022 - 2032F
- Historical Data and Forecast of Finland Cocoa butter Market Revenues & Volume By Plastic Containers for the Period 2022 - 2032F
- Historical Data and Forecast of Finland Cocoa butter Market Revenues & Volume By Paper Containers for the Period 2022 - 2032F
- Historical Data and Forecast of Finland Cocoa butter Market Revenues & Volume By Others for the Period 2022 - 2032F
- Historical Data and Forecast of Finland Cocoa butter Market Revenues & Volume By Distribution Channel for the Period 2022 - 2032F
- Historical Data and Forecast of Finland Cocoa butter Market Revenues & Volume By Direct Sales for the Period 2022 - 2032F
- Historical Data and Forecast of Finland Cocoa butter Market Revenues & Volume By Indirect Sales for the Period 2022 - 2032F
- Finland Cocoa butter Import Export Trade Statistics
- Market Opportunity Assessment By Types
- Market Opportunity Assessment By Form
- Market Opportunity Assessment By End-user
- Market Opportunity Assessment By Packaging
- Market Opportunity Assessment By Distribution Channel
- Finland Cocoa butter Top Companies Market Share
- Finland Cocoa butter Competitive Benchmarking By Technical and Operational Parameters
- Finland Cocoa butter Company Profiles
- Finland Cocoa butter Key Strategic Recommendations
Frequently Asked Questions About the Market Study (FAQs):
6Wresearch actively monitors the Finland Cocoa butter Market and publishes its comprehensive annual report, highlighting emerging trends, growth drivers, revenue analysis, and forecast outlook. Our insights help businesses to make data-backed strategic decisions with ongoing market dynamics. Our analysts track relevent industries related to the Finland Cocoa butter Market, allowing our clients with actionable intelligence and reliable forecasts tailored to emerging regional needs.
Yes, we provide customisation as per your requirements. To learn more, feel free to contact us on sales@6wresearch.com
1 Executive Summary |
2 Introduction |
2.1 Key Highlights of the Report |
2.2 Report Description |
2.3 Market Scope & Segmentation |
2.4 Research Methodology |
2.5 Assumptions |
3 Finland Cocoa butter Market Overview |
3.1 Finland Country Macro Economic Indicators |
3.2 Finland Cocoa butter Market Revenues & Volume, 2022 & 2032F |
3.3 Finland Cocoa butter Market - Industry Life Cycle |
3.4 Finland Cocoa butter Market - Porter's Five Forces |
3.5 Finland Cocoa butter Market Revenues & Volume Share Segmentations, 2022 & 2032F |
3.6 Finland Cocoa butter Market Revenues & Volume Share, By Form, 2022 & 2032F |
3.7 Finland Cocoa butter Market Revenues & Volume Share, By End-user, 2022 & 2032F |
3.8 Finland Cocoa butter Market Revenues & Volume Share, By Packaging, 2022 & 2032F |
3.9 Finland Cocoa butter Market Revenues & Volume Share, By Distribution Channel, 2022 & 2032F |
4 Finland Cocoa butter Market Dynamics |
4.1 Impact Analysis |
4.2 Market Drivers |
4.2.1 Increasing consumer awareness about the health benefits of cocoa butter |
4.2.2 Growing demand for natural and organic skincare products containing cocoa butter |
4.2.3 Rising disposable income leading to higher spending on premium cosmetic products |
4.3 Market Restraints |
4.3.1 Fluctuating raw material prices impacting production costs |
4.3.2 Competition from alternative plant-based butter substitutes |
4.3.3 Regulatory challenges and compliance requirements in the cosmetics industry |
5 Finland Cocoa butter Market Trends |
6 Finland Cocoa butter Market Segmentations |
6.1 Finland Cocoa butter Market Segmentations |
6.1.1 Overview and Analysis |
6.1.2 Finland Cocoa butter Market Revenues & Volume, By organic, 2022 - 2032F |
6.1.3 Finland Cocoa butter Market Revenues & Volume, By conventional, 2022 - 2032F |
6.1.4 Finland Cocoa butter Market Revenues & Volume, By deodorized, 2022 - 2032F |
6.2 Finland Cocoa butter Market, By Form |
6.2.1 Overview and Analysis |
6.2.2 Finland Cocoa butter Market Revenues & Volume, By solid, 2022 - 2032F |
6.2.3 Finland Cocoa butter Market Revenues & Volume, By Liquid, 2022 - 2032F |
6.3 Finland Cocoa butter Market, By End-user |
6.3.1 Overview and Analysis |
6.3.2 Finland Cocoa butter Market Revenues & Volume, By Food Industry, 2022 - 2032F |
6.3.3 Finland Cocoa butter Market Revenues & Volume, By Pharmaceutical Industry, 2022 - 2032F |
6.3.4 Finland Cocoa butter Market Revenues & Volume, By Aromatherapy, 2022 - 2032F |
6.3.5 Finland Cocoa butter Market Revenues & Volume, By Cosmetics, 2022 - 2032F |
6.3.6 Finland Cocoa butter Market Revenues & Volume, By Personal Care Industry, 2022 - 2032F |
6.4 Finland Cocoa butter Market, By Packaging |
6.4.1 Overview and Analysis |
6.4.2 Finland Cocoa butter Market Revenues & Volume, By Tins, 2022 - 2032F |
6.4.3 Finland Cocoa butter Market Revenues & Volume, By Cartons, 2022 - 2032F |
6.4.4 Finland Cocoa butter Market Revenues & Volume, By Plastic Containers, 2022 - 2032F |
6.4.5 Finland Cocoa butter Market Revenues & Volume, By Paper Containers, 2022 - 2032F |
6.4.6 Finland Cocoa butter Market Revenues & Volume, By Others, 2022 - 2032F |
6.5 Finland Cocoa butter Market, By Distribution Channel |
6.5.1 Overview and Analysis |
6.5.2 Finland Cocoa butter Market Revenues & Volume, By Direct Sales, 2022 - 2032F |
6.5.3 Finland Cocoa butter Market Revenues & Volume, By Indirect Sales, 2022 - 2032F |
7 Finland Cocoa butter Market Import-Export Trade Statistics |
7.1 Finland Cocoa butter Market Export to Major Countries |
7.2 Finland Cocoa butter Market Imports from Major Countries |
8 Finland Cocoa butter Market Key Performance Indicators |
8.1 Cocoa butter price index |
8.2 Consumer satisfaction scores for cocoa butter products |
8.3 Number of new product launches containing cocoa butter in the skincare industry |
8.4 Percentage of market share held by cocoa butter products in the premium cosmetics segment |
8.5 Sustainability certifications obtained by cocoa butter manufacturers |
9 Finland Cocoa butter Market - Opportunity Assessment |
9.1 Finland Cocoa butter Market Opportunity Assessment Segmentations, 2022 & 2032F |
9.2 Finland Cocoa butter Market Opportunity Assessment, By Form, 2022 & 2032F |
9.3 Finland Cocoa butter Market Opportunity Assessment, By End-user, 2022 & 2032F |
9.4 Finland Cocoa butter Market Opportunity Assessment, By Packaging, 2022 & 2032F |
9.5 Finland Cocoa butter Market Opportunity Assessment, By Distribution Channel, 2022 & 2032F |
10 Finland Cocoa butter Market - Competitive Landscape |
10.1 Finland Cocoa butter Market Revenue Share, By Companies, 2025 |
10.2 Finland Cocoa butter Market Competitive Benchmarking, By Operating and Technical Parameters |
11 Company Profiles |
12 Recommendations | 13 Disclaimer |
Global Go To Market Strategy - 2030
Export potential enables firms to identify high-growth global markets with greater confidence by combining advanced trade intelligence with a structured quantitative methodology. The framework analyzes emerging demand trends and country-level import patterns while integrating macroeconomic and trade datasets such as GDP and population forecasts, bilateral import–export flows, tariff structures, elasticity differentials between developed and developing economies, geographic distance, and import demand projections. Using weighted trade values from 2020–2024 as the base period to project country-to-country export potential for 2030, these inputs are operationalized through calculated drivers such as gravity model parameters, tariff impact factors, and projected GDP per-capita growth. Through an analysis of hidden potentials, demand hotspots, and market conditions that are most favorable to success, this method enables firms to focus on target countries, maximize returns, and global expansion with data, backed by accuracy.
By factoring in the projected importer demand gap that is currently unmet and could be potential opportunity, it identifies the potential for the Exporter (Country) among 190 countries, against the general trade analysis, which identifies the biggest importer or exporter.
To discover high-growth global markets and optimize your business strategy:
Click Here
Pricing
- Single User License$ 1,995
- Department License$ 2,400
- Site License$ 3,120
- Global License$ 3,795

Leadership Perspectives from Industry Events
Search
Thought Leadership and Analyst Meet


Our Clients
6WResearch In News
- India Export Attractiveness Tracker 2026
- India Air Conditioner Market Set for Strong Rebound in 2026 After Weather-Led Correction and GST-Driven Recovery: 6Wresearch
- ADAS in India: How Automatic Emergency Braking, Blind Spot Detection & Driver Monitoring are Transforming Road Safety
- Doha a strategic location for EV manufacturing hub: IPA Qatar
- Demand for luxury TVs surging in the GCC, says Samsung
- Empowering Growth: The Thriving Journey of Bangladesh’s Cable Industry
Latest Reports
- Nicaragua RPG Gaming Market (2026-2032)
- New Zealand RPG Gaming Market (2026-2032)
- Netherlands RPG Gaming Market (2026-2032)
- Nauru RPG Gaming Market (2026-2032)
- Namibia RPG Gaming Market (2026-2032)
- Mozambique RPG Gaming Market (2026-2032)
- Montenegro RPG Gaming Market (2026-2032)
- Mongolia RPG Gaming Market (2026-2032)
- Monaco RPG Gaming Market (2026-2032)
- Micronesia RPG Gaming Market (2026-2032)
Industry Events and Analyst Meet

EV India Expo 2026

HIMTEX 2026

India Refining Summit 2026

India EV Show 2026

EV tech India Expo 2026
Whitepaper
- Middle East & Africa Commercial Security Market Click here to view more.
- Middle East & Africa Fire Safety Systems & Equipment Market Click here to view more.
- GCC Drone Market Click here to view more.
- Middle East Lighting Fixture Market Click here to view more.
- GCC Physical & Perimeter Security Market Click here to view more.